. 2018 Oct 9;115(41):E9600-E9609.
doi: 10.1073/pnas.1807112115. Epub 2018 Sep 25.

BRCA1-IRIS promotes human tumor progression through PTEN blockade and HIF-1α activation

Affiliations

BRCA1-IRIS promotes human tumor progression through PTEN blockade and HIF-1α activation

Andrew G Li et al. Proc Natl Acad Sci U S A. .

Abstract

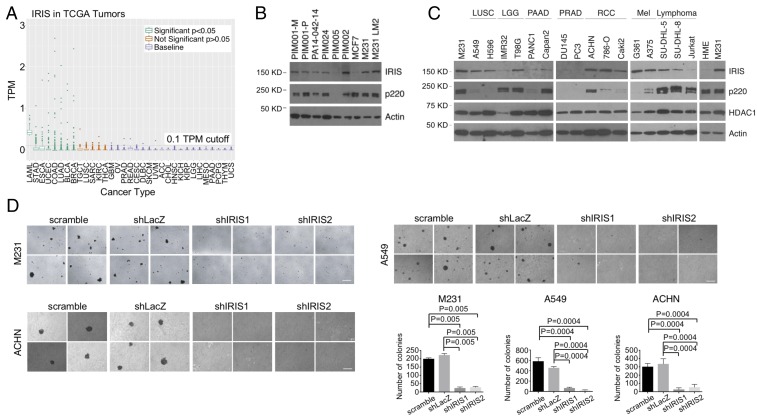
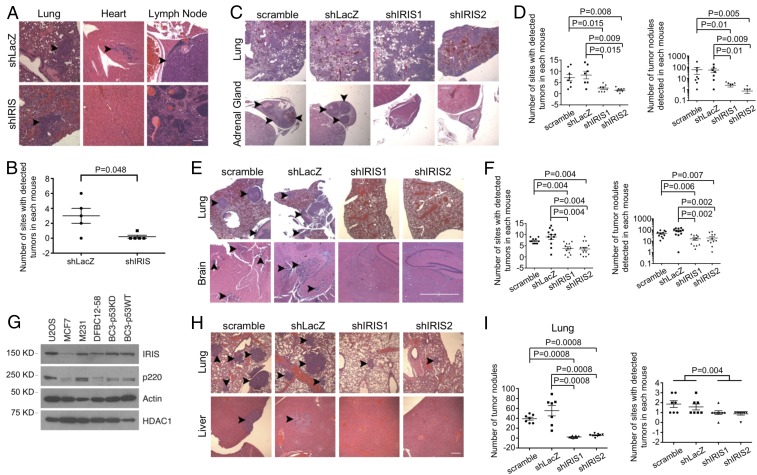
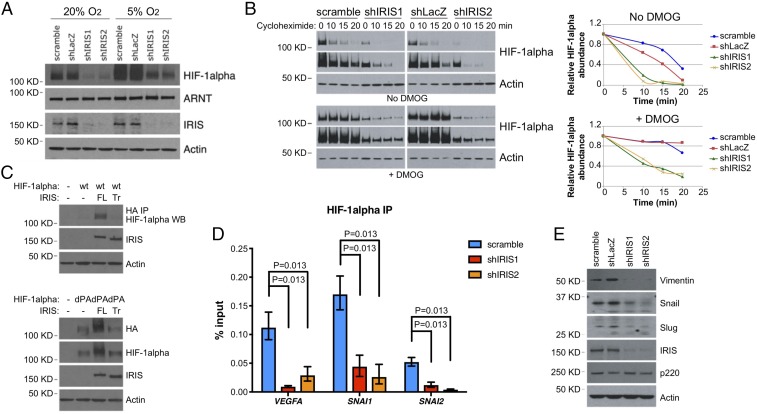
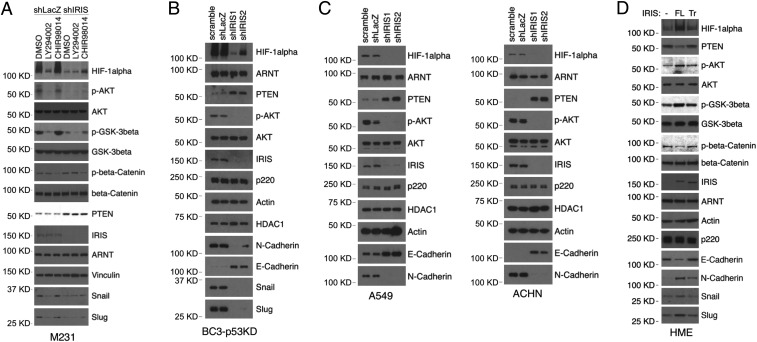
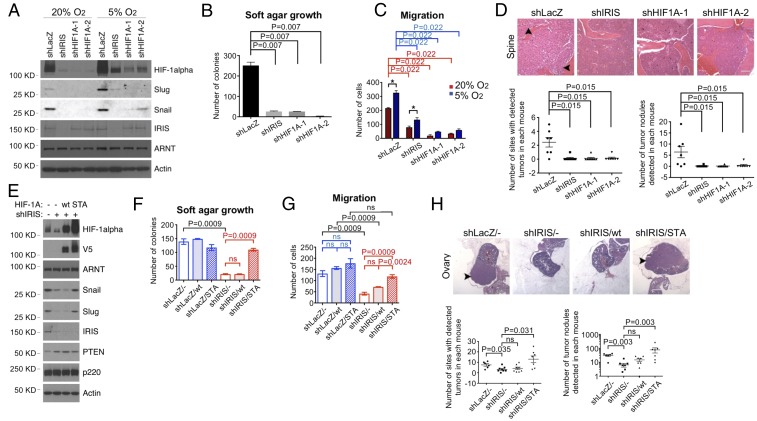
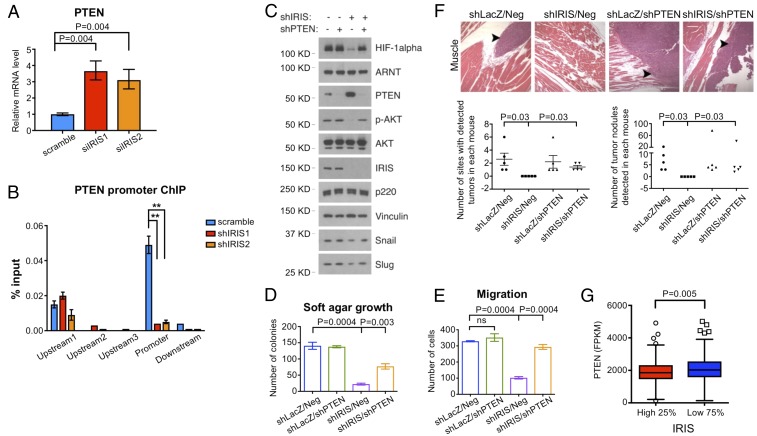
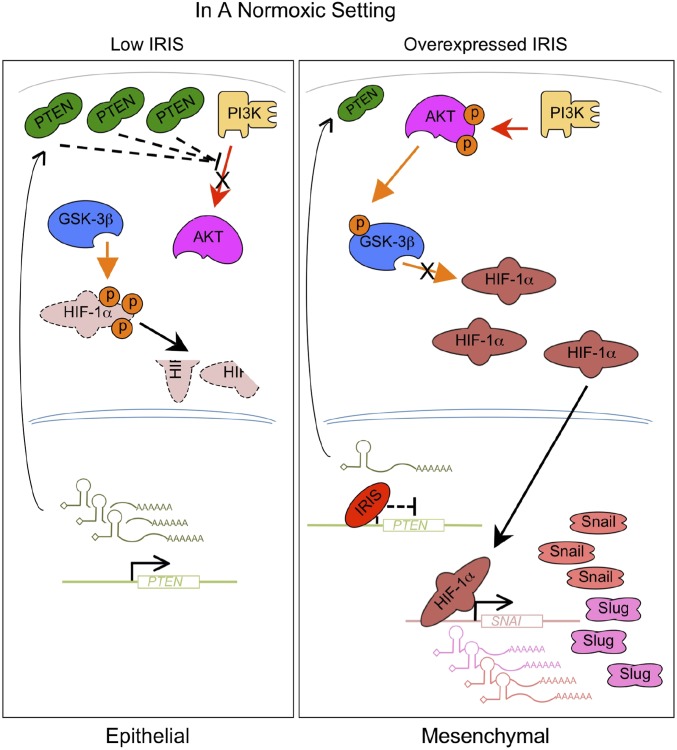
BRCA1 is an established breast and ovarian tumor suppressor gene that encodes multiple protein products whose individual contributions to human cancer suppression are poorly understood. BRCA1-IRIS (also known as "IRIS"), an alternatively spliced BRCA1 product and a chromatin-bound replication and transcription regulator, is overexpressed in various primary human cancers, including breast cancer, lung cancer, acute myeloid leukemia, and certain other carcinomas. Its naturally occurring overexpression can promote the metastasis of patient-derived xenograft (PDX) cells and other human cancer cells in mouse models. The IRIS-driven metastatic mechanism results from IRIS-dependent suppression of phosphatase and tensin homolog (PTEN) transcription, which in turn perturbs the PI3K/AKT/GSK-3β pathway leading to prolyl hydroxylase-independent HIF-1α stabilization and activation in a normoxic environment. Thus, despite the tumor-suppressing genetic origin of IRIS, its properties more closely resemble those of an oncoprotein that, when spontaneously overexpressed, can, paradoxically, drive human tumor progression.

Keywords: BRCA1-IRIS; HIF-1α; PTEN; metastasis.


Conflict of interest statement

Conflict of interest statement: D.M.L. is a grantee of and consultant to the Novartis Institute of Biomedical Research. W.G.K. owns equity in and consults for Lilly. A.L.K. was, during the course of some of this work, a grantee of and consultant to the Novartis Institute of Biomedical Research.

Figures

Fig. 1.
Fig. 1.
Expression of IRIS in sporadic human cancer. (A) Dot plot showing IRIS RNA-Seq data in various sporadic tumors in the TCGA data collection. TPM, transcripts per million. Refer to Dataset S2 for a description of abbreviations of each cancer type and P values. (B) Western blot showing IRIS protein levels in samples from multiple human breast cancer PDX models. (C) Western blot showing IRIS protein levels in various human cancer cell lines. LGG, lower grade glioma; LUSC, lung squamous cell carcinoma; Mel, melanoma; PAAD, pancreatic adenocarcinoma; PRAD, prostate adenocarcinoma; RCC, renal clear cell carcinoma. (D) Agar colony formation by M231, A549, and ACHN cells before and after IRIS depletion (n = 6). (Scale bars, 200 μm.)
Fig. 2.
Fig. 2.
IRIS depletion attenuates metastasis of breast cancer cells. (A) IRIS depletion reduced metastatic deposits arising from primary tumors of M231 cells. (Scale bar, 80 μm.) Arrowheads pointing at dense, H&E-stained cell collections identify tumor deposits. (B) Quantitation of metastatic deposits detected in the mammary fat pad injection experiments (n = 5). (C) IRIS depletion significantly reduced metastatic deposits of M231 cells in organs and tissue sites other than the lung in the i.v. model. (Scale bar, 400 μm.) (D) Summaries of metastatic deposit quantitation in mice injected and analyzed in the i.v. model (scramble: n = 8; shLacZ: n = 7; shIRIS1: n = 8; shIRIS2: n = 7). (Left) Quantitation of the number of organ sites that contained tumor deposits as reflected in a standard number of sections, excluding lung. (Right) Quantitation of the number of tumor deposits detected in a standard number of sections, excluding lung. (E) Depletion of IRIS significantly depressed M231 cell tumor growth following IC injection. (Scale bar, 200 μm.) (F) Quantitation of metastatic deposits in a standard number of sections (lung included) in the IC injection assays (scramble: n = 11; shLacZ: n = 12; shIRIS1: n = 12; shIRIS2: n = 13). (G) Western blot showing expression levels of certain proteins in various cell strains growing in culture. (H) IRIS depletion attenuated metastasis of BC3-p53KD cells. (Scale bar, 160 μm.) (I) Summaries of metastatic activity of BC3-p53KD cells (scramble: n = 7; shLacZ: n = 7; shIRIS1: n = 8; shIRIS2: n = 8).
Fig. 3.
Fig. 3.
IRIS regulates HIF-1α protein stability. (A) Down-regulation of HIF-1α protein by IRIS depletion under normoxic and hypoxic conditions in M231 cells. (B) Endogenous overexpression of IRIS increased the half-life of HIF-1α protein in the presence and absence of DMOG. (Left) Short and long exposures of HIF-1α and actin Western blots. (Right) Kinetics of HIF-1α protein degradation normalized over actin abundance. (C) The effect of FL or Tr mutant IRIS expression on the abundance of ectopically expressed HIF-1α. (D) IRIS depletion dramatically reduced the binding of HIF-1α to its target gene promoters as reflected by the results of a ChIP assay. Values are normalized mean ± SD (n = 6). (E) Abundance of various proteins in control and IRIS-depleted M231 cells.
Fig. 4.
Fig. 4.
IRIS inhibits HIF-1α degradation via the AKT/GSK-3β pathway. (A) Effects of various kinase inhibitors on HIF-1α protein expression in M231 cells. LY294002 is a PI3K inhibitor; CHIR98014 is a GSK-3β inhibitor. (B) Western blot showing expression levels of various proteins in BC3-p53KD cells before and after IRIS depletion. (C) Effects of IRIS expression on levels of HIF-1α, PTEN, and phospho-AKT in A549 and ACHN cells. (D) Effects of IRIS expression on the expression of the downstream PI3K pathway and certain other targets in HME cells.
Fig. 5.
Fig. 5.
HIF-1α is necessary and sufficient for IRIS neoplastic functions. (A) Immunoblots reflecting the expression of various proteins synthesized in M231 cells following the expression of various hairpins. (B) HIF-1α depletion inhibited the growth of M231 cells in soft agar (n = 6). (C) Changes in the migration of M231 cells incubated in two different oxygen environments after transduction with the indicated hairpins (n = 6). *P < 0.05. (D) HIF-1α depletion suppressed i.v.-injected M231 cell metastasis to sites and organs other than lung (shLacZ: n = 7; shIRIS: n = 8; shHIF1A-1: n = 8; shHIF1A-2: n = 7). (Scale bar, 160 μm.) (E) Immunoblot-based expression analysis of various proteins in M231 cells after transduction of shIRIS and, where indicated, transduction of WT vs. STA HIF-1α. (F) STA HIF-1α stimulated the growth of IRIS-depleted M231 cells in soft agar (n = 9). ns, not significant. (G) STA HIF-1α restored the high migratory activity of IRIS-depleted M231 cells (n = 9). ns, not significant. (H) STA HIF-1α rescued metastasis of IRIS-depleted M231 cells (shLacZ/-: n = 6; shIRIS/-: n = 8; shIRIS/wt: n = 8; shIRIS/STA: n = 7). (Scale bar, 400 μm.) ns, not significant.
Fig. 6.
Fig. 6.
PTEN depletion rescues phenotypic changes in IRIS-depleted cells. (A) PTEN mRNA levels increased after IRIS depletion in M231 cells. Values are normalized mean ± SD (n = 6). (B) Relative abundance of endogenous IRIS associated with the PTEN promoter in M231 cells as assayed by ChIP. Values are normalized mean ± SD (n = 6). **P < 0.01. (C) Western blot showing various protein levels in M231 cells under each knockdown condition. (D) PTEN depletion rescued the growth of IRIS-depleted M231 cells in soft agar (n = 9). Neg, negative control hairpin. (E) PTEN depletion restored the migratory activity of IRIS-depleted M231 cells (n = 12). ns, not significant. (F) IRIS-depleted M231 cells regained the ability to metastasize after codepletion of PTEN (n = 5). (Scale bar, 160 μm.) (G) Low PTEN expression correlated with relatively high IRIS messenger levels in the TCGA breast cancer dataset. High 25%: cases with IRIS mRNA levels in the top quartile. Low 75%: the remaining cases.
Fig. 7.
Fig. 7.
A schematic model illustrating the function of overexpressed IRIS in human breast cancer cells. In a normoxic setting, overexpressed IRIS represses PTEN gene transcription. The resulting low PTEN protein levels lead to the activation of AKT and inhibition of HIF-1α phosphorylation mediated by GSK-3β. HIF-1α becomes stabilized and accumulates to activate the transcription of its target genes, such as SNAI1 and SNAI2. Elevated Snail and Slug expression induces an EMT and promotes metastasis.

References

    1. Miki Y, et al. A strong candidate for the breast and ovarian cancer susceptibility gene BRCA1. Science. 1994;266:66–71. - PubMed
    1. ElShamy WM, Livingston DM. Identification of BRCA1-IRIS, a BRCA1 locus product. Nat Cell Biol. 2004;6:954–967. - PubMed
    1. Nakuci E, Mahner S, Direnzo J, ElShamy WM. BRCA1-IRIS regulates cyclin D1 expression in breast cancer cells. Exp Cell Res. 2006;312:3120–3131. - PubMed
    1. Paul BT, Blanchard Z, Ridgway M, ElShamy WM. BRCA1-IRIS inactivation sensitizes ovarian tumors to cisplatin. Oncogene. 2015;34:3036–3052. - PubMed
    1. Blanchard Z, Paul BT, Craft B, ElShamy WM. BRCA1-IRIS inactivation overcomes paclitaxel resistance in triple negative breast cancers. Breast Cancer Res. 2015;17:5. - PMC - PubMed

Publication types