. 2018 Oct 9;115(41):E9697-E9706.
doi: 10.1073/pnas.1806189115. Epub 2018 Sep 25.

Single-molecule analysis of endogenous β-actin mRNA trafficking reveals a mechanism for compartmentalized mRNA localization in axons

Affiliations

Single-molecule analysis of endogenous β-actin mRNA trafficking reveals a mechanism for compartmentalized mRNA localization in axons

Benita Turner-Bridger et al. Proc Natl Acad Sci U S A. .

Abstract

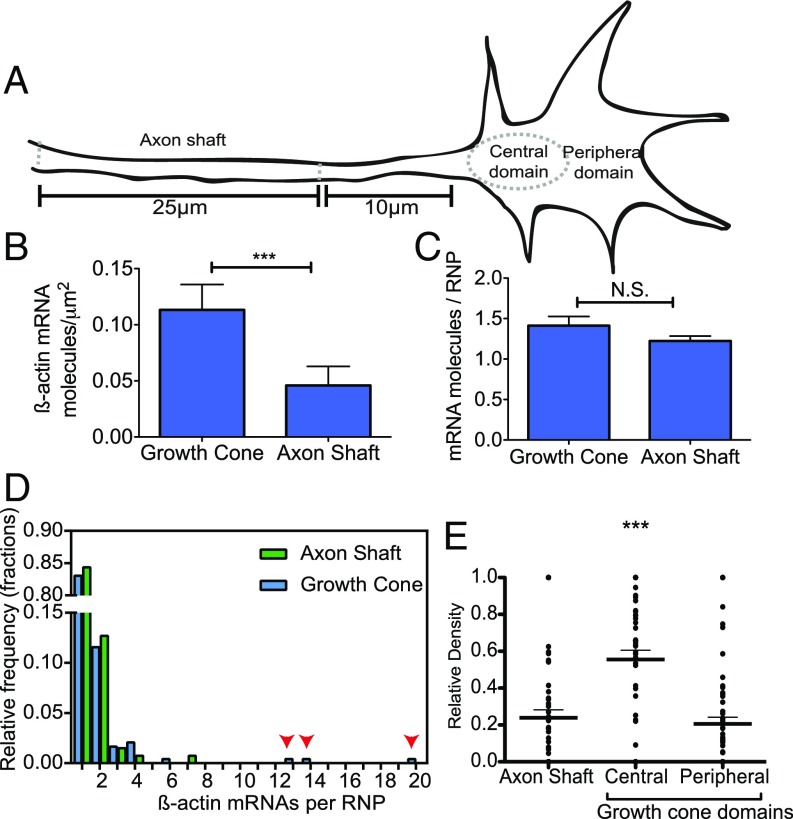
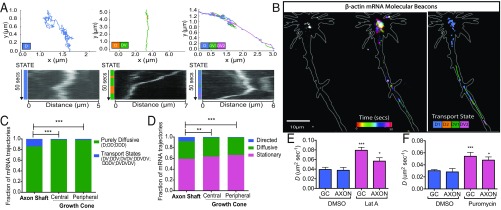
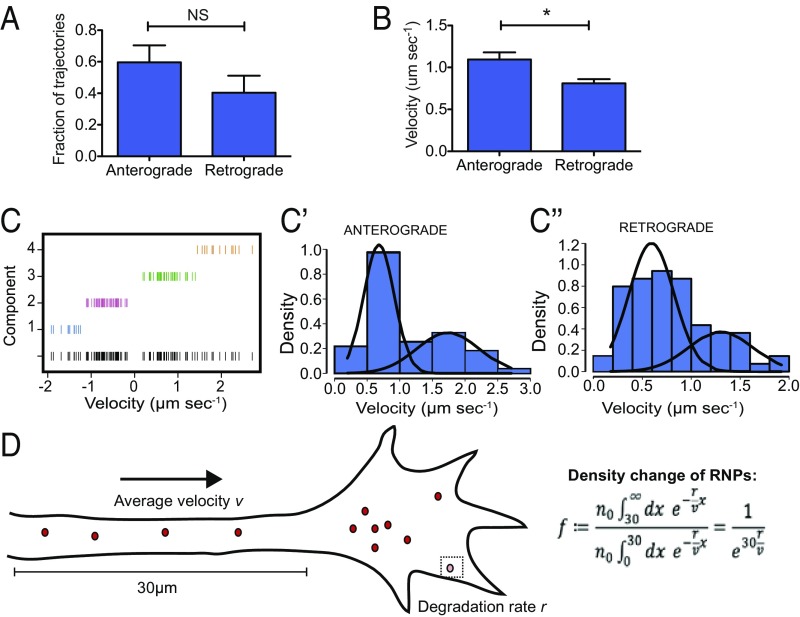
During embryonic nervous system assembly, mRNA localization is precisely regulated in growing axons, affording subcellular autonomy by allowing controlled protein expression in space and time. Different sets of mRNAs exhibit different localization patterns across the axon. However, little is known about how mRNAs move in axons or how these patterns are generated. Here, we couple molecular beacon technology with highly inclined and laminated optical sheet microscopy to image single molecules of identified endogenous mRNA in growing axons. By combining quantitative single-molecule imaging with biophysical motion models, we show that β-actin mRNA travels mainly as single copies and exhibits different motion-type frequencies in different axonal subcompartments. We find that β-actin mRNA density is fourfold enriched in the growth cone central domain compared with the axon shaft and that a modicum of directed transport is vital for delivery of mRNA to the axon tip. Through mathematical modeling we further demonstrate that directional differences in motor-driven mRNA transport speeds are sufficient to generate β-actin mRNA enrichment at the growth cone. Our results provide insight into how mRNAs are trafficked in axons and a mechanism for generating different mRNA densities across axonal subcompartments.

Keywords: RNA localization; axon; molecular beacon; single molecule; β-actin.


Conflict of interest statement

The authors declare no conflict of interest.

Figures

Fig. 1.
Fig. 1.
Molecular beacons selectively label β-actin mRNA to single-nucleotide precision in vitro. (A) Schematic showing the predicted secondary structure of the sequences of each molecular beacon used to target β-actin mRNA (mFOLD) and the molecular beacon sequences used to target predicted single-stranded regions in the mRNA. Arrowheads indicate the start site of the 5′ UTR, coding sequence (CDS), and 3′ UTR. (B) The addition of 2-μM β-actin mRNA to 1-μM solutions of MB1 or MB2 significantly increased the fluorescent intensity of the solutions compared with MBs in hybridization solution alone and cumulatively amplified fluorescence further when 2-μM β-actin mRNA was added to 1-μM solutions of MB1 and MB2 together (MB1 + MB2). Below the symbol (/) are the changes in fluorescence over time for 1 μM MB1 alone, 1 μM MB2 alone, hybridization buffer alone, 2 μM γ-actin + MB1, and 2 μM γ-actin + MB2. In contrast, the addition of 2-μM γ-actin mRNA did not elicit a change in fluorescent intensity in solutions containing 1 μM of either MB1 or MB2. (B′) For a clearer comparison, B′ shows the fluorescent intensity of each condition at 60 min. ***P < 0.0001 unpaired Students t test; N.S., not significant; n = 3 replicates per condition.
Fig. 2.
Fig. 2.
Molecular beacons label β-actin mRNA in growing axons. (A) MBs colocalize significantly more with exogenous fluorescently tagged β-actin mRNA than with exogenous fluorescently tagged γ-actin mRNA in growing RGC axons. (Scale bars: 5 μm.) (B) Quantification of colocalization between β-actin mRNA-targeting MBs and exogenous Cy5-UTP β-actin mRNA and Cy5-UTP γ-actin mRNA. P < 0.0001, n = 21 axons and 11 axons, respectively. (C) MBs targeting β-actin mRNA showed significantly more puncta per growth cone than control MBs targeting Brn3a mRNA or a scrambled sequence. **P = 0.0043, ***P = 0.001, unpaired t test. n = 64, 73, 82, and 86 axons for β-actin MB1, β-actin MB2, Brn3a, and the scrambled sequence, respectively. (D) MBs and smFISH puncta could be observed to mark the same place in nonsimultaneous images, similar to EGFP puncta and IHC against EGFP. (Scale bars: 5 μm.) (E) Schematic showing the workflow for the registration of nonsimultaneous images used to quantify colocalization. (F) Cumulative frequency distribution of ICP distance between matched puncta in MB and smFISH images (n = 14 axons) and in Vg1RBP-EGFP and IHC positive and randomized negative controls (n = 11 axons). (G) Quantification of colocalization based on an ICP distance threshold of 1. ***P < 0.0001, unpaired t test; N.S., not significant.
Fig. 3.
Fig. 3.
Endogenous β-actin mRNA stoichiometry in growing axons. (A) Single stepwise photobleaching events were observed using MB1 and HILO microscopy. Black lines represent background-subtracted intensity trace of MB puncta; colored lines show the median intensity of each step after filtering. (Scale bar: 5 μm.) (B) An example of two stepwise photobleaching events in one trace. (C) Representative image of β-actin mRNA distribution using smFISH. (Scale bar: 10 μm.) (D) Frequency distribution of the number of β-actin mRNAs per RNP calculated from smFISH spot intensity distributions. (E) Variability in the number of β-actin mRNAs within axonal growth cones was observed. n = 35 RNase-A–treated axons and n = 100 untreated axons.
Fig. 4.
Fig. 4.
smFISH reveals that the localization patterns of β-actin mRNA vary according to axonal subcompartment. (A) Cartoon representation of the different axonal regions analyzed. (B) A comparison of the density of β-actin mRNA molecules in the growth cone and axon shaft via smFISH shows significantly increased density of β-actin mRNA in the growth cone. (C) No difference between β-actin mRNA RNP stoichiometry was observed in the different subcompartments. N.S. not significant. (D) Histogram of β-actin mRNA stoichiometry. Arrowheads indicate more highly multiplexed copy numbers in the growth cone. (E) Relative density of β-actin mRNA across subcompartments of the same axon shows significant enrichment in the central domain of the growth cone. ***P < 0.0001; paired Student’s t test; n = 63 axons.
Fig. 5.
Fig. 5.
Differential subcompartmental trafficking of β-actin mRNA. (A) Examples of complex motion trajectories displayed by β-actin mRNA in axons. Different transport modes were characterized through HMM–Bayes. D, diffusive states; DV, directed transport states. (B) β-Actin mRNA dynamics within a representative axon. (Left) Initial β-actin mRNA distribution labeled by MBs. (Center) Temporally color-coded β-actin mRNA dynamics. (Right) Annotated mRNA trajectories. (C) Significantly more trajectories undergo motion with directed transport in the axon shaft than in the central and peripheral domains of the growth cone. (D) Trajectories annotated according to the predominant motion state again show a significantly greater fraction of directed transport of β-actin mRNA in the axon shaft. ***P < 0.001, **P < 0.0025; χ2 test; n = 6, 66 axons. (E) The addition of latrunculin A significantly increased the diffusive mobility of MB β-actin mRNA puncta compared with DMSO treatment only [***P < 0.0001 and *P = 0.0454 for growth cone (GC) and axon shaft; n = 12 axons for DMSO treatment, and n =11 axons for latrunculin A]. (F) Dissociation from ribosomes by puromycin addition increased the diffusion coefficient of MB puncta in both axons and growth cones compared with wild-type untreated axons [n = 11 puromycin-treated axons and n = 66 wild-type axons, ***P < 0.0001 (growth cone) and *P = 0.0253 (axon)].
Fig. 6.
Fig. 6.
Directional differences in β-actin mRNA-directed transport along the axon shaft are sufficient to confer localization patterns. (A) No significant difference (NS) was found in the frequency of anterograde- versus retrograde-directed transport of β-actin mRNA in axons. (B) A comparison of the velocity of anterograde- and retrograde-directed transport states shows that β-actin mRNA moves significantly faster in the anterograde direction. (C) Multimixture modeling of Gaussian modal distributions of directed transport speeds best fits a quadmodal distribution in which velocities exhibit a bimodal distribution in the anterograde (C′) and retrograde (C′′) directions. (D) A mathematical model shows that fold change in density resulting from an anterograde bias in directed transport speeds is sufficient to predict enriched β-actin mRNA density in the central domain of the growth cone. *P = 0.0167; Mann–Whitney U test; n = 124 puncta, and n =66 axons.

Similar articles

Cited by

References

    1. Holt CE, Bullock SL. Subcellular mRNA localization in animal cells and why it matters. Science. 2009;326:1212–1216. - PMC - PubMed
    1. Jung H, Yoon BC, Holt CE. Axonal mRNA localization and local protein synthesis in nervous system assembly, maintenance and repair. Nat Rev Neurosci. 2012;13:308–324. - PMC - PubMed
    1. Wu KY, et al. Local translation of RhoA regulates growth cone collapse. Nature. 2005;436:1020–1024. - PMC - PubMed
    1. Leung KM, et al. Asymmetrical beta-actin mRNA translation in growth cones mediates attractive turning to netrin-1. Nat Neurosci. 2006;9:1247–1256. - PMC - PubMed
    1. Yao J, Sasaki Y, Wen Z, Bassell GJ, Zheng JQ. An essential role for beta-actin mRNA localization and translation in Ca2+-dependent growth cone guidance. Nat Neurosci. 2006;9:1265–1273. - PubMed

Publication types

LinkOut - more resources