. 2018 Oct 9;115(41):10517-10522.
doi: 10.1073/pnas.1809973115. Epub 2018 Sep 25.

Structure of a PSI-LHCI-cyt b6f supercomplex in Chlamydomonas reinhardtii promoting cyclic electron flow under anaerobic conditions

Affiliations

Structure of a PSI-LHCI-cyt b6f supercomplex in Chlamydomonas reinhardtii promoting cyclic electron flow under anaerobic conditions

Janina Steinbeck et al. Proc Natl Acad Sci U S A. .

Abstract

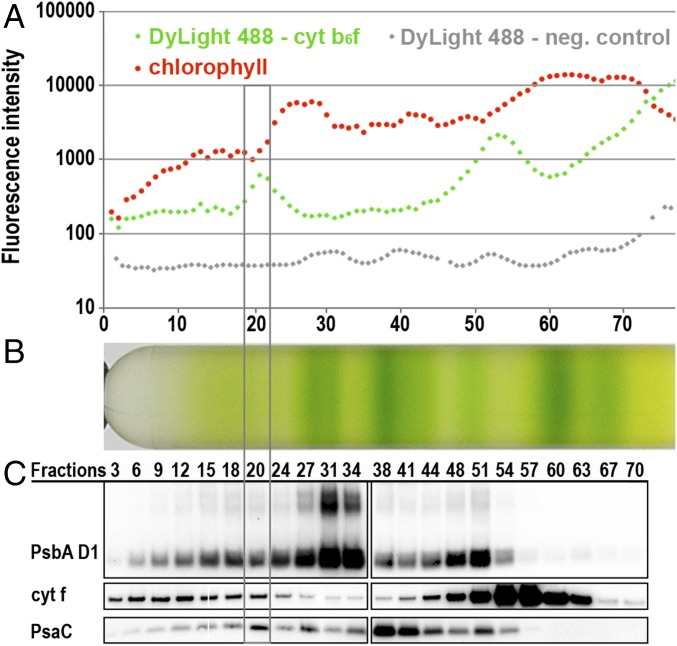
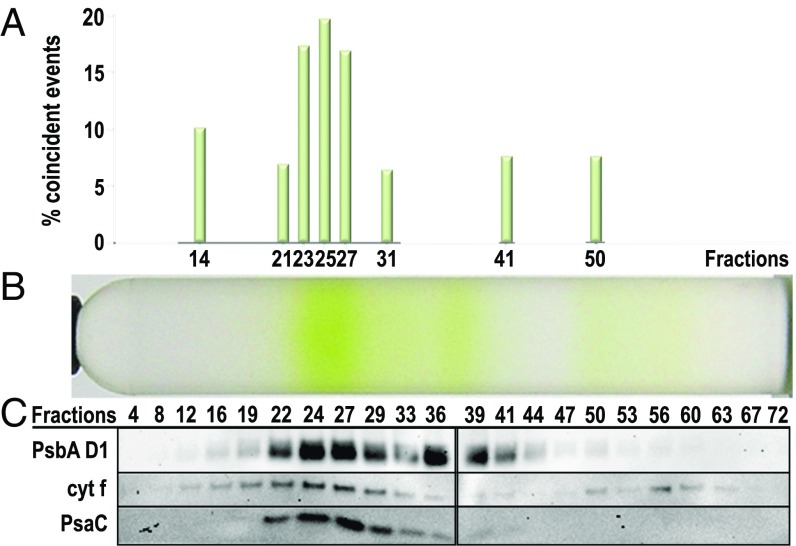
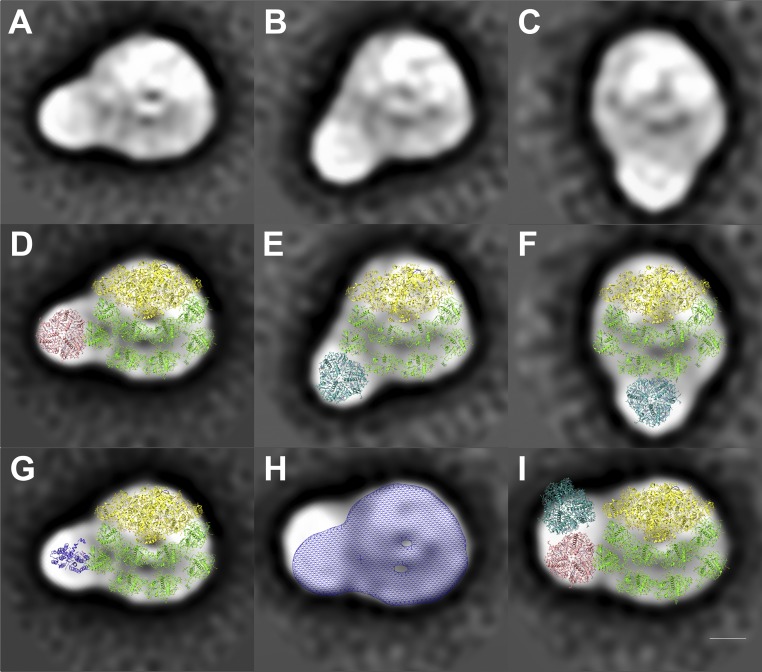
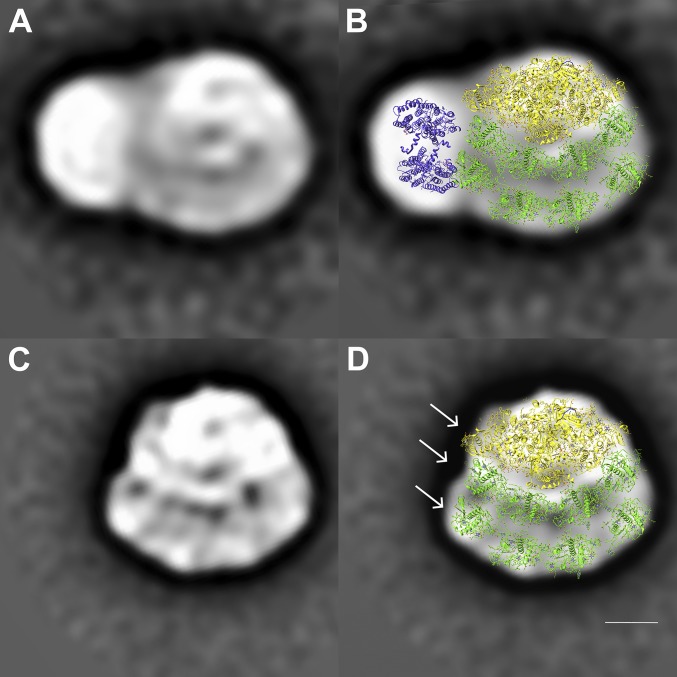
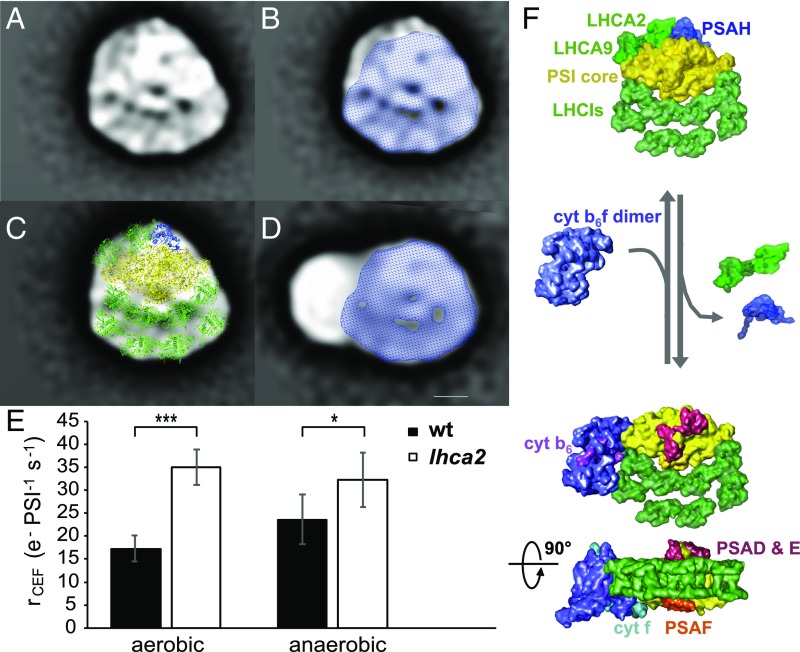
Photosynthetic linear electron flow (LEF) produces ATP and NADPH, while cyclic electron flow (CEF) exclusively drives photophosphorylation to supply extra ATP. The fine-tuning of linear and cyclic electron transport levels allows photosynthetic organisms to balance light energy absorption with cellular energy requirements under constantly changing light conditions. As LEF and CEF share many electron transfer components, a key question is how the same individual structural units contribute to these two different functional modes. Here, we report the structural identification of a photosystem I (PSI)-light harvesting complex I (LHCI)-cytochrome (cyt) b6f supercomplex isolated from the unicellular alga Chlamydomonas reinhardtii under anaerobic conditions, which induces CEF. This provides strong evidence for the model that enhanced CEF is induced by the formation of CEF supercomplexes, when stromal electron carriers are reduced, to generate additional ATP. The additional identification of PSI-LHCI-LHCII complexes is consistent with recent findings that both CEF enhancement and state transitions are triggered by similar conditions, but can occur independently from each other. Single molecule fluorescence correlation spectroscopy indicates a physical association between cyt b6f and fluorescent chlorophyll containing PSI-LHCI supercomplexes. Single particle analysis identified top-view projections of the corresponding PSI-LHCI-cyt b6f supercomplex. Based on molecular modeling and mass spectrometry analyses, we propose a model in which dissociation of LHCA2 and LHCA9 from PSI supports the formation of this CEF supercomplex. This is supported by the finding that a Δlhca2 knockout mutant has constitutively enhanced CEF.

Keywords: Chlamydomonas reinhardtii; cyclic electron flow; cytochrome b6f; photosystem I; supercomplex.


Conflict of interest statement

The authors declare no conflict of interest.

Figures

Fig. 1.
Fig. 1.
Identification of the CEF supercomplex peak fraction in SDG by SMF spectroscopy and Western blot analysis. (A) Fluorescence intensity screening of each SDG fraction (log scale) confirms good correlation of red chlorophyll fluorescence with the location of the photosynthetic complexes in the SDG (B) and reveals two main peaks of green fluorescent DyLight 488–trisNTA labeled cyt f. As control for the green fluorescent signal, a SDG of an unlabeled cyt f His-Tag strain was screened (displayed in gray). (B) SDG of anaerobic α-DDM solubilized cyt f His-Tag thylakoids separated into 77 fractions. (C) Immunoblot detection of cyt f, the PSI subunit PSAC, and the PSII subunit PsbA D1 show that the PSAC signal peaks with the higher molecular weight green fluorescent peak signal of the DyLight 488–trisNTA labeled cyt f at fraction 20.
Fig. 2.
Fig. 2.
Cytochrome b6f is physically associated with chlorophyll fluorescent proteins in the CEF supercomplex sucrose density region revealed by SMF coincidence analysis. (A) Coincident events, i.e., the simultaneous bursts of green and red fluorescence, indicative of the physical association of DyLight 488-labeled cyt f and chlorophyll fluorescent proteins, are most abundant in the CEF supercomplex region of the SDG. The frequency of coincident events relative to total fluorescent events recorded over a period of 60 s is plotted for selected fractions over the corresponding SDG. A false positive rate of 5% was applied to exclude the possible random excitation of two single fluorescent proteins as experimentally examined previously (13). (B) Pooled CEF supercomplex fractions from five SDGs of a cyt f His6-tag strain were concentrated, labeled with DyLight 488–trisNTA, and ultracentrifuged on a subsequent SDG to enrich for potential CEF supercomplexes. (C) Immunoblot detection of cyt f, PSAC, and Psba D1 over the SDG fractions confirms that the highest frequency of coincident events correlates with the localization of these proteins in the high molecular weight CEF supercomplex region.
Fig. 3.
Fig. 3.
Structural characterization of potential PSI–LHCI–LHCII supercomplexes from C. reinhardtii by single particle electron microscopy. AC show three of the projections from SI Appendix, Fig. S6, which have densities additional to those of the PSI–LHCI supercomplex. (DF) These projection maps have been overlaid with the densities of the PSI core complex [yellow (17), Protein Data Bank (PDB) 4Y28] and the LHCA proteins (green, PDB 4Y28). A LHCII trimer [magenta or cyan (42), PDB 1RWT] can be seen to fit well into these three densities. (G) Modeling a cyt b6f monomer [purple (19), PDB 1Q90] into the additional density next to PSI–LHCI supercomplex (A) shows a poor fit. (H) Overlay of the large PSI supercomplex projection map from Fig. 4A and a meshed density map of A. (I) Poor fit of two LHCII trimers (42) into the projection map from Fig. 4A next to the PSI–LHCI complex. This suggests that the additional densities in AC are likely LHCII trimers, while the new density in H and Fig. 4A best fits a cyt b6f dimer. (Scale bar: 5 nm.)
Fig. 4.
Fig. 4.
Structural characterization of a PSI–LHCI–cyt b6f supercomplex from C. reinhardtii by single particle transmission electron microscopy. (A) Averaged TEM projection map of a large supercomplex consisting of PSI and LHCI with an additional particle at its PSAG LHCA1 side (sum of 132 particles, representing 50% of classes in SI Appendix, Fig. S7). (B) Structural assignment of this supercomplex based on fitting with the crystal structures of the PSI–LHCI complex (17) and the cyt b6f complex (19) [Protein Data Bank (PDB) accession nos. 4Y28 and 1Q90, respectively]. The PSI core complex is shown in yellow with LHCA proteins highlighted in green. The cyt b6f complex is shown in purple. (C) Averaged projection map of a PSI–LHCI complex missing PSAH at its core. (D) Structural assignment of the PSI–LHCI complex similar to B. Eight LHCA proteins were modeled into the double-layered LHCI belt according to ref. . Arrows indicate the position of PSAG (yellow) and two LHCA1 subunits (green). (Scale bar: 5 nm.)
Fig. 5.
Fig. 5.
Dissociation of LHCA2 and LHCA9 from the PSI–LHCI complex favors the association of PSI–LHCI–cyt b6f supercomplexes and enhances cyclic electron flow. (A) Averaged TEM projection map of a PSI–LHCI complex with an additional density at its core. (B) Overlay of the PSI–LHCI complex from A with Fig. 4C. (C) Structural assignment of the PSI–LHCI complex from A based on fitting with the crystal structures of the PSI–LHCI complex (17). The additional densities compared with the smaller PSI–LHCI complex (B) were modeled with PSAH (blue) and two additional LHCA proteins (green) at the PSI core according to ref. . (D) Overlay of the CEF supercomplex projection map from Fig. 4A with the PSI–LHCI complex from Fig. 4C. (Scale bar: 5 nm.) (E) Cyclic electron transfer rates of a Δlhca2 mutant compared with wild-type levels in aerobic and anaerobic conditions. Rates were measured in steady state upon a transition from darkness to light with ∼130 μE m−2⋅s−1 light intensity. To exclude contribution of PSII to the electron transfer, cultures were treated with 40 μM DCMU. Anaerobic conditions were achieved by addition of 100 mM glucose and 2 mg⋅mL−1 glucose oxidase. To alleviate PSI acceptor side limitation upon transition to anaerobiosis, anaerobic samples were kept in the darkness for 40 min and continuously illuminated for 2 min before the rate measurements (n = 6 biological replicates ± SD). Statistical analysis: one-way ANOVA followed by a Tukey test for pairwise comparison of the means (***P < 0.001; *P < 0.05). (F) Structural model of CEF supercomplex formation upon dissociation of LHCA2, LHCA9, and PSAH from the PSI–LHCI complex. The PSI core is shown in yellow, LHCI proteins in bright green, cyt b6f in purple. Plastocyanin (cyt f in cyan, PSAF in orange) and ferredoxin (PSAD/E in red and cyt b6 in pink)-binding regions are indicated. All high-resolution components have been filtered to 20 Å to avoid overinterpretation.

References

    1. Arnon DI, Allen MB, Whatley FR. Photosynthesis by isolated chloroplasts. Nature. 1954;174:394–396. - PubMed
    1. Bassham JA, Benson AA, Calvin M. The path of carbon in photosynthesis. J Biol Chem. 1950;185:781–787. - PubMed
    1. Calvin M, Benson AA. The path of carbon in photosynthesis. Science. 1948;107:476–480. - PubMed
    1. Allen JF. Cyclic, pseudocyclic and noncyclic photophosphorylation: New links in the chain. Trends Plant Sci. 2003;8:15–19. - PubMed
    1. Munekage Y, et al. Cyclic electron flow around photosystem I is essential for photosynthesis. Nature. 2004;429:579–582. - PubMed

Publication types

MeSH terms

Substances