. 2018 Nov 6;8(11):3703-3713.
doi: 10.1534/g3.118.200446.

A Case Study of Genomic Instability in an Industrial Strain of Saccharomyces cerevisiae

Affiliations

A Case Study of Genomic Instability in an Industrial Strain of Saccharomyces cerevisiae

Aline Rodrigues-Prause et al. G3 (Bethesda). .

Abstract

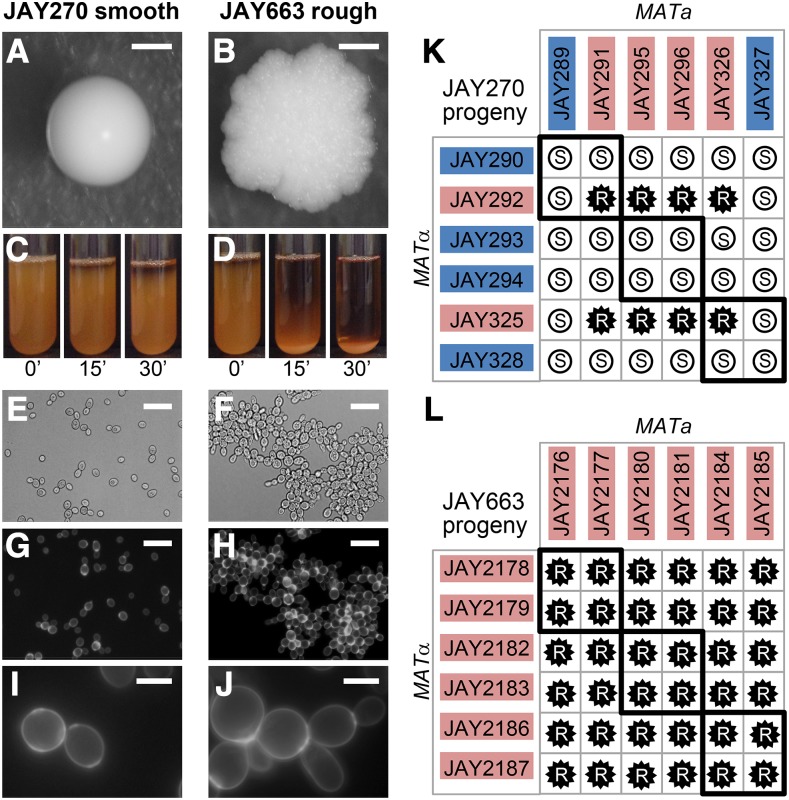
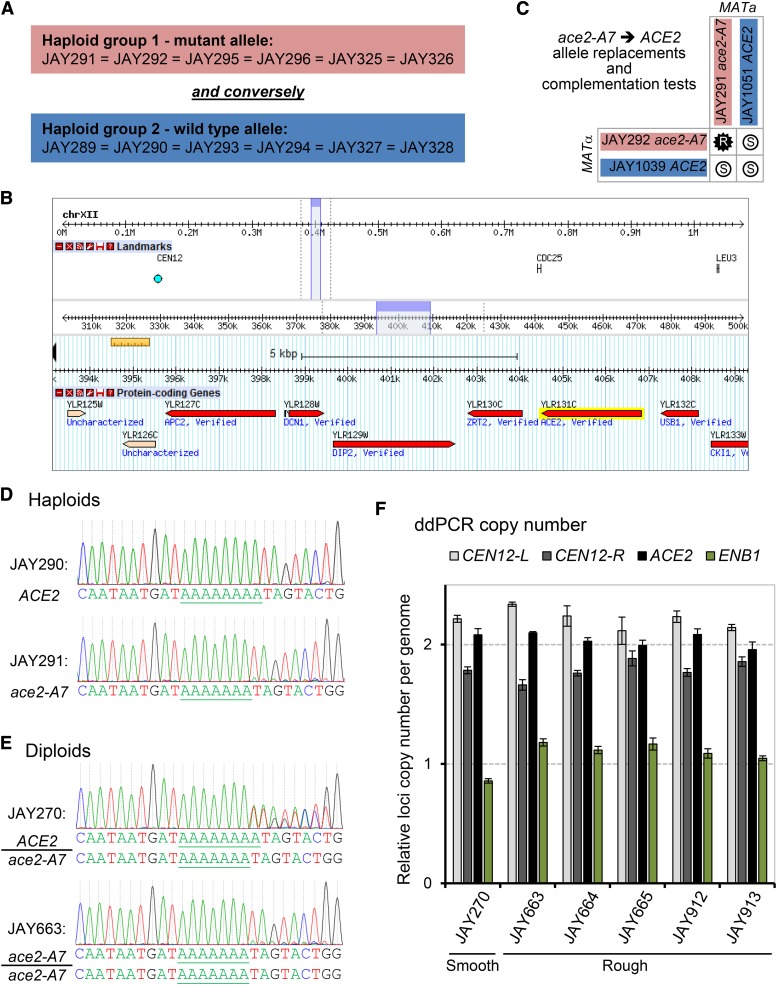
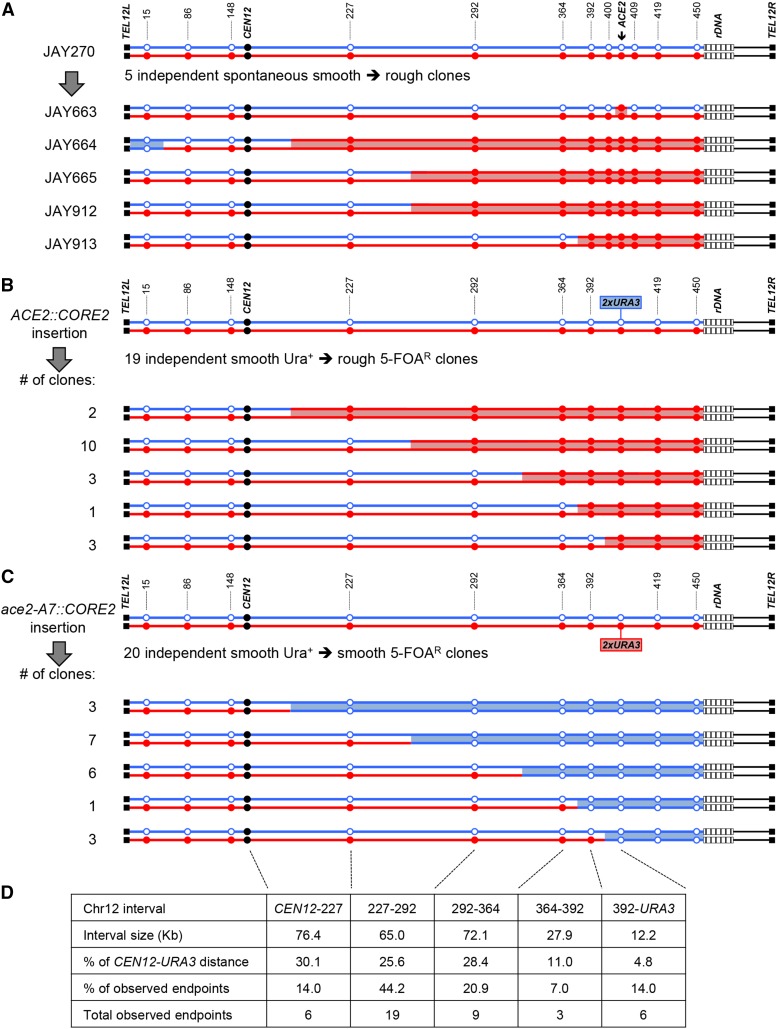
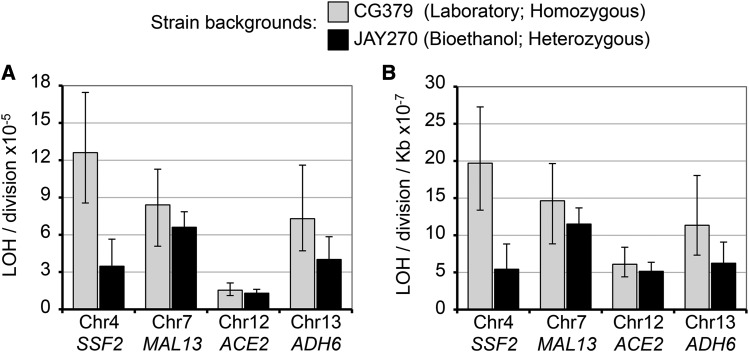
The Saccharomyces cerevisiae strain JAY270/PE2 is a highly efficient biocatalyst used in the production of bioethanol from sugarcane feedstock. This strain is heterothallic and diploid, and its genome is characterized by abundant structural and nucleotide polymorphisms between homologous chromosomes. One of the reasons it is favored by many distilleries is that its cells do not normally aggregate, a trait that facilitates cell recycling during batch-fed fermentations. However, long-term propagation makes the yeast population vulnerable to the effects of genomic instability, which may trigger the appearance of undesirable phenotypes such as cellular aggregation. In pure cultures of JAY270, we identified the recurrent appearance of mutants displaying a mother-daughter cell separation defect resulting in rough colonies in agar media and fast sedimentation in liquid culture. We investigated the genetic basis of the colony morphology phenotype and found that JAY270 is heterozygous for a frameshift mutation in the ACE2 gene (ACE2/ace2-A7), which encodes a transcriptional regulator of mother-daughter cell separation. All spontaneous rough colony JAY270-derived isolates analyzed carried copy-neutral loss-of-heterozygosity (LOH) at the region of chromosome XII where ACE2 is located (ace2-A7/ace2-A7). We specifically measured LOH rates at the ACE2 locus, and at three additional chromosomal regions in JAY270 and in a conventional homozygous diploid laboratory strain. This direct comparison showed that LOH rates at all sites were quite similar between the two strain backgrounds. In this case study of genomic instability in an industrial strain, we showed that the JAY270 genome is dynamic and that structural changes to its chromosomes can lead to new phenotypes. However, our analysis also indicated that the inherent level of genomic instability in this industrial strain is normal relative to a laboratory strain. Our work provides an important frame of reference to contextualize the interpretation of instability processes observed in the complex genomes of industrial yeast strains.

Keywords: ACE2; Colony morphology; Fermentation; Loss-of-heterozygosity; Mitotic recombination; Saccharomyces cerevisiae.


Figures

Figure 1
Figure 1
Smooth and rough colony morphologies, liquid sedimentation, mother-daughter cell attachment, and phenotypes of diploids derived from mating specific haploids. A-J show images of the JAY270 smooth parent diploid strain (left panels) and its spontaneous rough derivative JAY663 (right panels). A and B, colony morphologies on YPD agar after 3 days growth at 30C. C and D, cell sedimentation kinetics. 5 ml liquid YPD cultures were grown overnight at 30C in a rotating drum. Test tubes were vortexed vigorously for 10 sec to fully resuspend the cells, then were left to rest and photographed at 15 min intervals (the 0’ pictures were taken immediately after vortexing). E and F, bright field, and G-J, fluorescence microscopy of cells stained with calcofluor white to highlight chitin septa and the mother-daughter cell attachment. Scale bars are 1mm (A-B), 20µm (E-F) and 5µm (G-J). K and L, Smooth (S, white circles) and rough (R, black stars) phenotypes of diploids formed by crossing the indicated MATa and MATα haploids isolated from three tetrads of each JAY270 (K) and JAY663 (L). Thick black lines indicate the four diploids derived from matings of intra-tetrad sibling haploids. The colored backgrounds for each haploid correspond to their inferred genotype (Blue, dominant wild type allele; Red, recessive mutant allele). All 12 haploids from panel K had their whole genomes sequenced. Co-segregation analysis with JAY270 HetSNPs (Fig. S1) was used for identification of the causal mutation at the ACE2 locus (Fig. 2).
Figure 2
Figure 2
Mapping and characterization of the ace2-A7 mutation. A The genetic mapping approach consisted of identifying HetSNP linkage regions in which one allele (M or P) co-segregated in all six haploids inferred to carry the rough mutant allele (red), while the other allele (P or M) co-segregated in all six haploids inferred to contain the smooth wild type allele (blue) (see Fig. 1K). B Genome Browser view of a Chr12 candidate region that satisfied the strict co-segregation criterion. This region spans 13 Kb and contains 9 genes (from YLR125W to CKI1). Review of the functional annotations of the genes in this region identified the ACE2 locus (highlighted in yellow) as a likely candidate, and further sequence review uncovered the ace2-A7 mutation. A second candidate region on Chr11 (not shown) was also identified through co-segregation analysis, but was not pursued further. C Allele replacements and complementation tests. The ace2-A7 allele from two haploid strains JAY291 (MATa) and JAY292 (MATα) was replaced with the ACE2 allele, generating JAY1051 and JAY1039, respectively. Matings between the ace2-A7 and ACE2 haploids confirmed the restoration of the smooth phenotype in diploid strains derived from at least one haploid parent containing the ACE2 allele. D and E Sanger DNA sequencing analysis of ACE2 locus. D shows segments of PCR-Sanger sequencing chromatograms for the ACE2 locus from haploids with the wild type ACE2 (JAY290) and mutant ace2-A7 (JAY291) alleles. Note the difference in the A-homopolymer runs, with eight consecutive peaks in ACE2 and seven consecutive peaks in ace2-A7. E shows PCR-Sanger chromatograms from diploids (primer extension was from left to right in all cases). The JAY270 chromatogram is a mixture of the two alleles (heterozygous), while the rough colony clone JAY663 only had the ace2-A7 pattern. The inferred DNA sequences in D and E are shown below the chromatograms. The chromatograms from rough clones JAY664, JAY665, JAY912 and JAY913 were indistinguishable from JAY663 (not shown). F Gene copy number analysis of the ACE2 locus. Plots show the calculated copy number for the four genomic regions probed, relative to the average of the signal between the control probes flanking the Chr12 centromere (CEN12-L and CEN12-R), both known to be present in two copies in the JAY270 genome. The ENB1 region was another control probe, known to be present as one copy in JAY270.
Figure 3
Figure 3
LOH tract maps of the ACE2 and Chr12 heterozygous regions. A The genotypes at twelve phased JAY270 Chr12 HetSNP marker loci were determined using PCR and RFLP or Sanger sequencing analyses (Table S3). The approximate coordinates of the markers are shown in Kb. The Chr12 homolog containing the ace2-A7 allele was arbitrarily designated as maternal (Chr12-M, red) and the homolog containing the wild type ACE2 allele as paternal (Chr12-P, blue). JAY270 was heterozygous at all markers, and all rough colony isolates were homozygous for the ace2-A7 allele. White boxes distal to the 450 Kb HetSNP represent ∼1,500 Kb of ribosomal DNA repeats (rDNA). Chr12 right arm regions distal to the rDNA do not contain any heterozygous markers in JAY270. The red or blue shading between homologs corresponds to the directions (M or P, respectively) and approximate endpoint positions of the LOH tracts (midpoint between HetSNP markers). Panels B and C show the patterns of LOH found in independent 5-FOA resistant clones derived from JAY270 with hemizygous insertions of the CORE2 cassette (KlURA3-ScURA3-KanMX4) either adjacent to the ACE2 allele in the paternal Chr12 homolog (B) or adjacent to the ace2-A7 allele in the maternal Chr12 homolog (C). The clones selected in B were ace2-A7/ace2-A7 and formed rough colonies, whereas the clones selected in C were ACE2/ACE2 and formed smooth colonies. The genotypes at the nine HetSNP loci at the indicated positions were determined by PCR-RFLP. The clones showing continuous LOH tracts were grouped according to the endpoint interval between HetSNPs, and the number of clones in each group is indicated to the left. Panel D shows a representation of the endpoint distribution among clones with Chr12 LOH. These clones were arranged in groups according to the PCR-RFLP HetSNPs marker positions used in A, B and C. The table shows the analysis of absolute interval size, relative size compared to the CEN12 to CORE2 distance, and the number and frequency of endpoints (combined from A, B and C) for each Chr12 interval. Note that only clones with uninterrupted tracts are shown in B-C. Two clones with complex tracts (non-contiguous or bidirectional) were omitted from this figure and the endpoint distribution analysis.
Figure 4
Figure 4
Quantitative analyses of LOH. The median absolute rates of LOH events (A) and normalized LOH rates per kilobase (respective CEN to CORE2 distance) (B) at four different genomic positions were measured in the CG379 laboratory strain background (gray bars) and in the JAY270 bioethanol strain background (black bars). CG379-derived diploids were homozygous at all genomic positions, except at the MAT locus and at the indicated marker positions. JAY270-derived diploids were heterozygous at multiple sites across the genome (Fig. S1), and at the indicated marker positions. In the X axis, Chr4, Chr7, Chr12, and Chr13 indicate diploids with hemizygous insertions of the CORE2 cassette (KlURA3-ScURA3-KanMX4) at each of those chromosomes. The LOH rate shown for Chr12 in JAY270 was derived from the strain carrying the ACE2/ace2-A7::CORE2 insertion (smooth Ura+ to smooth 5-FOAR transition). Error bars indicate 95% confidence intervals (CI) for each rate measurement.

Similar articles

Cited by

References

    1. Argueso J. L., Carazzolle M. F., Mieczkowski P. A., Duarte F. M., Netto O. V. C., et al. , 2009. Genome structure of a Saccharomyces cerevisiae strain widely used in bioethanol production. Genome Res. 19: 2258–2270. 10.1101/gr.091777.109 - DOI - PMC - PubMed
    1. Argueso J. L., Westmoreland J., Mieczkowski P. A., Gawel M., Petes T. D., et al. , 2008. Double-strand breaks associated with repetitive DNA can reshape the genome. Proc. Natl. Acad. Sci. USA 105: 11845–11850. 10.1073/pnas.0804529105 - DOI - PMC - PubMed
    1. Ausubel F. M., Brent R., Kingston R. E., Moore D. D., Seidman J. G., et al. , 1998. Current Protocols in Molecular Biology, John Wiley & Sons, New York.
    1. Basso L. C., de Amorim H. V., de Oliveira A. J., Lopes M. L., 2008. Yeast selection for fuel ethanol production in Brazil. FEMS Yeast Res. 8: 1155–1163. 10.1111/j.1567-1364.2008.00428.x - DOI - PubMed
    1. Borneman A. R., Desany B. A., Riches D., Affourtit J. P., Forgan A. H., et al. , 2011. Whole-genome comparison reveals novel genetic elements that characterize the genome of industrial strains of Saccharomyces cerevisiae. PLoS Genet. 7: e1001287 10.1371/journal.pgen.1001287 - DOI - PMC - PubMed

Publication types

MeSH terms

Substances

LinkOut - more resources