. 2018 Sep 25;9(1):3906.
doi: 10.1038/s41467-018-06206-0.

Analysis of extracellular mRNA in human urine reveals splice variant biomarkers of muscular dystrophies

Affiliations

Analysis of extracellular mRNA in human urine reveals splice variant biomarkers of muscular dystrophies

Layal Antoury et al. Nat Commun. .

Abstract

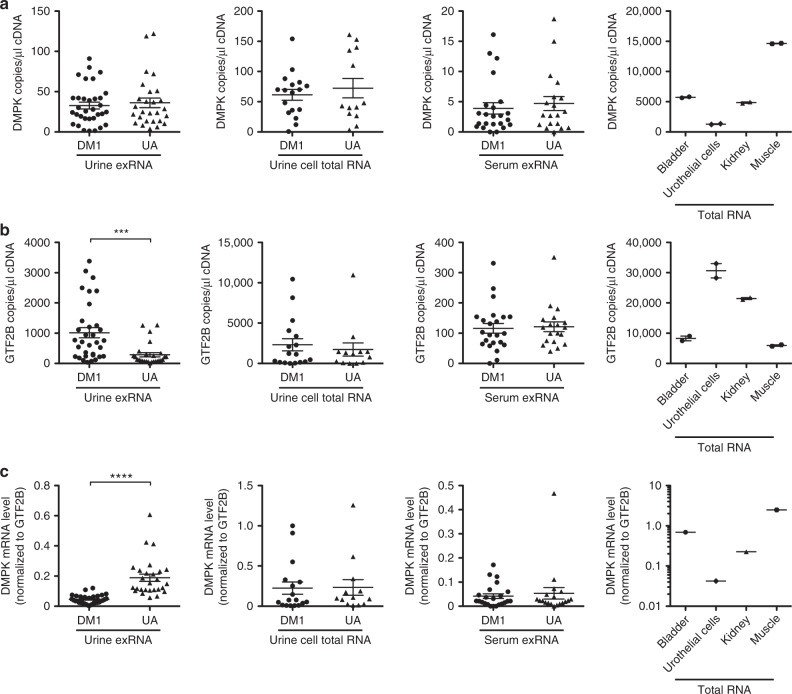
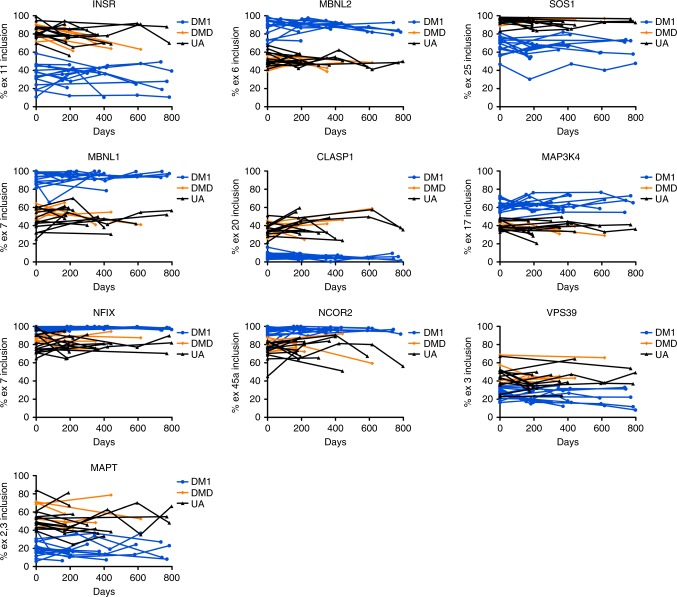
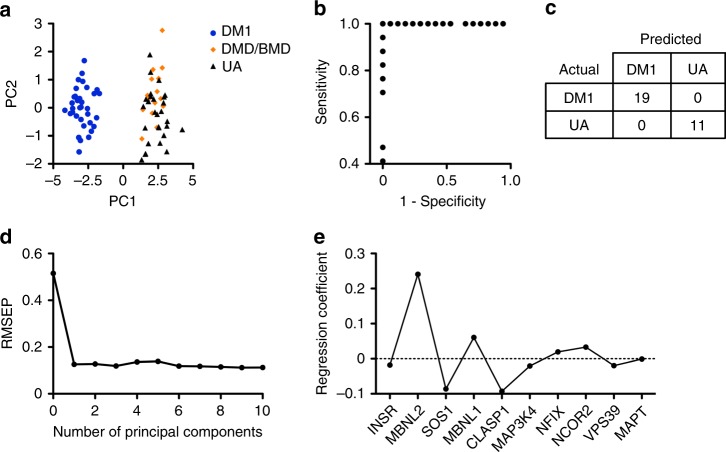
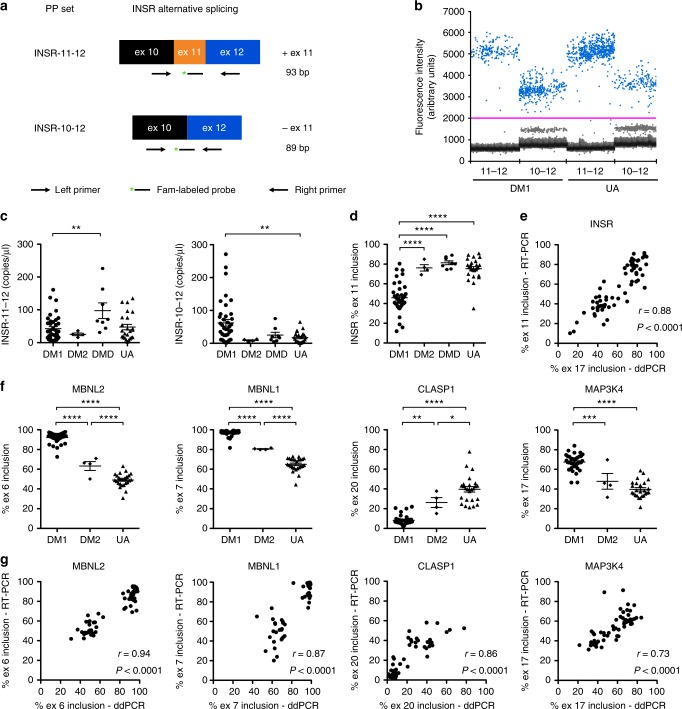
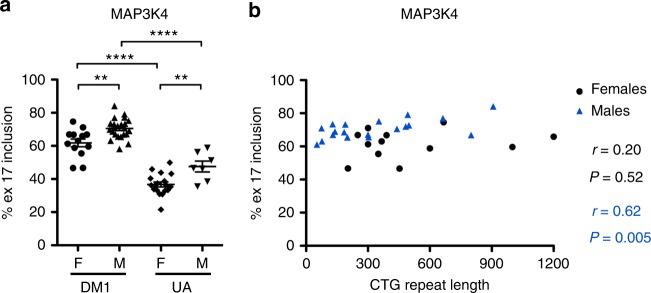
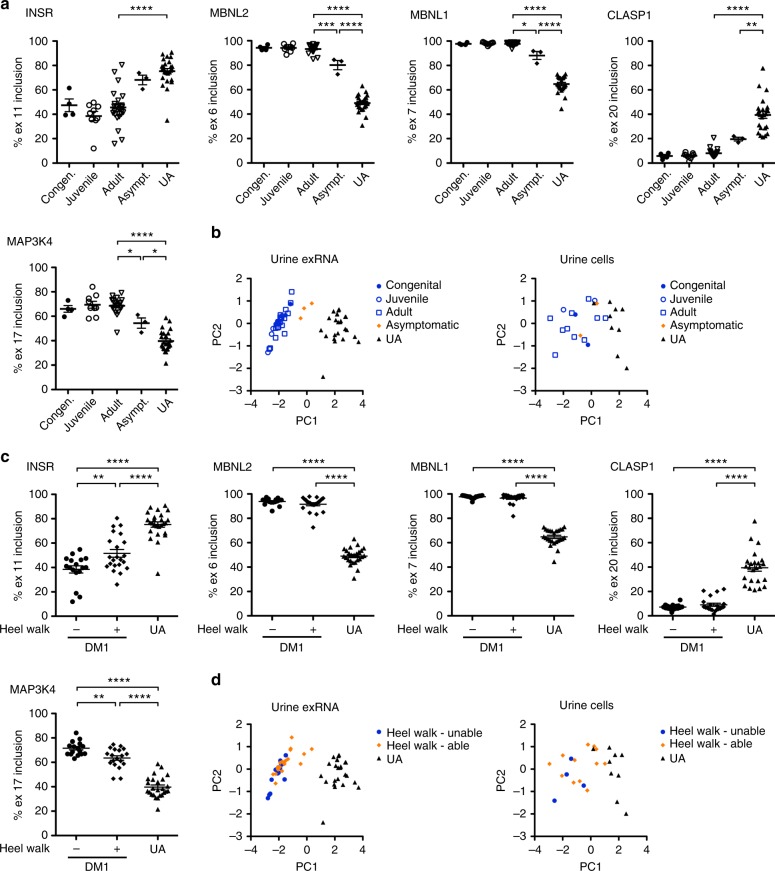
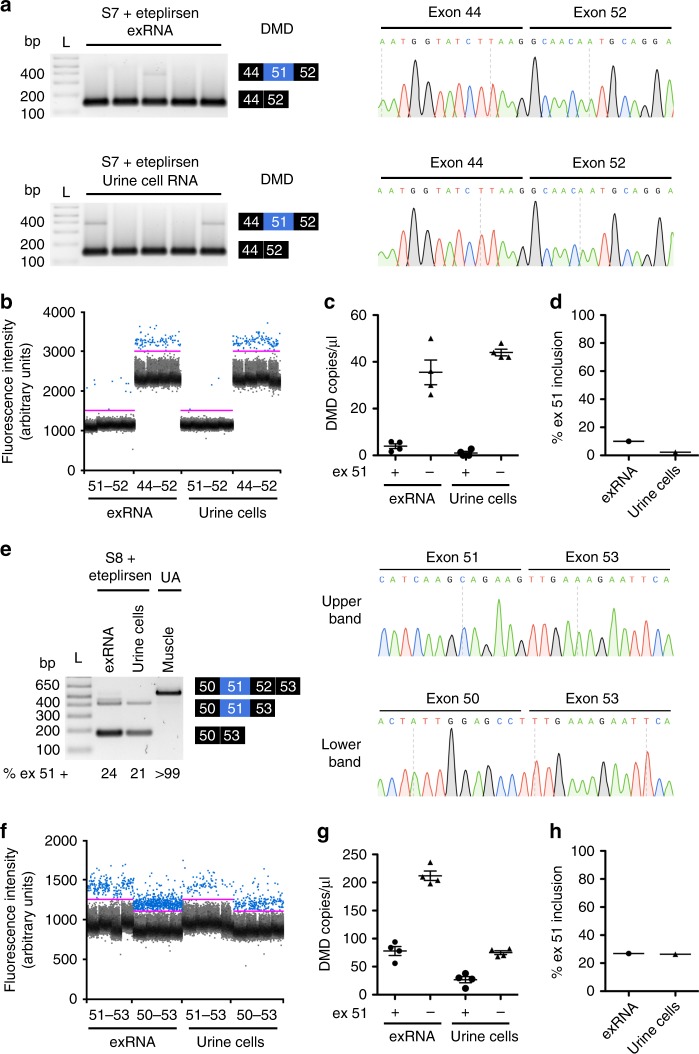
Urine contains extracellular RNA (exRNA) markers of urogenital cancers. However, the capacity of genetic material in urine to identify systemic diseases is unknown. Here we describe exRNA splice products in human urine as a source of biomarkers for the two most common forms of muscular dystrophies, myotonic dystrophy (DM) and Duchenne muscular dystrophy (DMD). Using a training set, RT-PCR, droplet digital PCR, and principal component regression, we identify ten transcripts that are spliced differently in urine exRNA from patients with DM type 1 (DM1) as compared to unaffected or disease controls, form a composite biomarker, and develop a predictive model that is 100% accurate in our independent validation set. Urine also contains mutation-specific DMD mRNAs that confirm exon-skipping activity of the antisense oligonucleotide drug eteplirsen. Our results establish that urine mRNA splice variants can be used to monitor systemic diseases with minimal or no clinical effect on the urinary tract.


Conflict of interest statement

Massachusetts General Hospital, T.M.W., X.O.B., and L.B. have filed a patent application on the use of urine exRNA to identify markers of muscular dystrophies. The remaining authors declare no competing interests.

Figures

Fig. 1
Fig. 1
DMPK gene expression in human urine and serum. We used droplet digital PCR (ddPCR) to examine gene expression in extracellular RNA (exRNA) from urine (N = 33 DM1 patients and 27 UA control subjects without muscular dystrophy), total RNA from urine cells (N = 17 DM1 and 13 UA controls), serum exRNA (N = 23 DM1 and 19 UA controls), and commercially available total RNA from human bladder tissue, urothelial cells, kidney tissue, and skeletal muscle tissue. a Expression of DMPK mRNA, and b reference gene GTF2B mRNA, as measured by RNA copy number per microliter of input cDNA. c DMPK expression normalized to GTF2B. Individual data points represent the mean of duplicate assays for each sample. Error bars indicate mean ± s.e.m. ****P < 0.0001; ***P = 0.0002 (t test)
Fig. 2
Fig. 2
Alternative splicing of extracellular mRNA from human urine. We isolated urine exRNA from 36 DM1, 15 DMD/BMD controls (DMD), and 28 unaffected (UA) subjects, and examined alternative splicing by RT-PCR and gel electrophoresis. Commercially available total RNA from skeletal muscle tissue served as a control. a Representative gel images showing alterative splicing of INSR exon 11, MBNL2 exon 6, SOS1 exon 25, MBNL1 exon 7, CLASP1 exon 20, MAP3K4 exon 17, NFIX exon 7, NCOR2 exon 45a, VPS39 exon 3, and MAPT exons 2 and 3. PCR cycle number was 36 (INSR, MBNL2, SOS1, CLASP1, MAP3K4, NFIX, NCOR2, and VPS39) or 37 (MBNL1 and MAPT). Control muscle cDNA was diluted 1:100 and amplified in the same PCR reaction as urine samples. “L” = DNA ladder. “bp” = base pairs. b Individual data points represent quantification of splicing in urine exRNA samples of all individuals examined. Error bars indicate mean ± s.e.m. ****P < 0.0001; *** = mean difference 8.0, 95% CI of difference 3.2–12.7 (NFIX, DM1 vs. DMD/BMD) and mean difference 8.3, 95% CI of difference 3.5–13.2 (NFIX, DMD/BMD vs. UA); one-way ANOVA
Fig. 3
Fig. 3
Longitudinal analysis of exRNA alternative splicing in human urine. We collected two or more urine specimens from 15 DM1, 5 DMD/BMD, and 13 UA subjects over the course of several months and examined exRNA splicing outcomes by RT-PCR. Note that due to low collection volume, low RNA recovery, and/or exhaustion of cDNA samples from testing 33 overall splice events and 7 transcripts by ddPCR, longitudinal data for NCOR2 are available from only 14 DM1 subjects, CLASP1 and NCOR2 from only 12 UA subjects, and several transcripts are missing 2-year data points for one or two DM1 and one or two UA subjects
Fig. 4
Fig. 4
Principal component analysis and predictive modeling of urine splicing outcomes. Using principal component regression, a linear combination of ten urine exRNA transcripts that show differential splicing in DM1 subjects (INSR, MBNL2, SOS1, MBNL1, CLASP1, MAP3K4, NFIX, NCOR2, VPS39, and MAPT) was used to develop a composite biomarker and predictive model of DM1. a Principal component (PC) score that served as a composite splicing biomarker for each subject (N = 36 DM1, 15 DMD/BMD, 28 UA). The first and second principal components are plotted. b We combined PC splicing data from the first 45 consecutive DM1 (N = 23) and UA (N = 22) subjects enrolled in the study, then randomly assigned 75%, irrespective of genotype, to a training set, and the remaining 25% to an independent validation set. Using the training set and a threshold of 0.5 (see Methods), we developed a predictive model that produced zero false positives and false negatives in a fivefold cross validation test. The receiver operating characteristic (ROC) curve is shown. c The predictive model accurately distinguished DM1 from UA in all 11 subjects of the validation set used to test the model (N = 6 DM1, 5 UA), and in the next 19 consecutive subjects that were enrolled in the study after model implementation (N = 13 DM1, 6 UA), for a total of N = 30 that were evaluated using the model. d Root mean square error of prediction (RMSEP) as a function of the number of principal components. e Regression coefficients, calculated as a weighted sum, which demonstrate the relative contribution to the model of each of the ten transcripts that were used to generate the model
Fig. 5
Fig. 5
Droplet digital PCR (ddPCR) analysis of alternative splicing in human urine exRNA. We used ddPCR to examine splicing of INSR exon 11 in urine exRNA samples from DM1 (N = 37), DM2 (N = 4), DMD/BMD (N = 8), and UA controls (N = 25). a Assay design using separate primer probe (PP) sets to identify exon 11 inclusion (INSR-11-12; amplicon size 93 base pairs, “bp”) and exon 11 exclusion (INSR-10-12; amplicon size 89 bp). b Representative droplet populations in urine exRNA samples from DM1 and UA subjects (N = 4 each) using each assay (INSR-11-12 and INSR-10-12). c Quantification of INSR splice products that include exon 11 (left) and exclude exon 11 (right) as copies per microliter cDNA. Individual data points represent the mean of duplicate assays for each sample. Error bars indicate mean ± s.e.m. **P = 0.0015 (DM1 vs. UA); *P = 0.01 (DM1 vs. DMD). d Calculation of INSR exon 11 inclusion using data in c. Error bars indicate mean ± s.e.m. ****P < 0.0001 (DM1 vs. DMD/BMD) and (DM1 vs. UA) groups. e INSR exon 11 inclusion measured by ddPCR (x-axis) vs. RT-PCR (y-axis) in all subjects. The correlation coefficient r and P value are shown. f Exon inclusion percentages for MBNL2 exon 6, MBNL1 exon 7, CLASP1 exon 20, and MAP3K4 exon 17. Error bars indicate mean ± s.e.m. ****P < 0.0001 (all four transcripts, DM1 vs. UA), (MBNL2 and MBNL1, DM1 vs. DM2), and, (MBNL1, DM2 vs. UA); *** mean difference 14.2, 95% CI of difference 6.2–22.1 (MBNL2, DM1 vs. DM2), and mean difference 20.1, 95% CI of difference 9.0–31.2, (MAP3K4, DM1 vs. DM2); ** mean difference 17.9, 95% CI of difference 5.5–30.3, (CLASP1, DM1 vs. DM2); * mean difference 13.2, 95% CI of difference 0.4–26.4, (CLASP1, DM2 vs. UA); one-way ANOVA. g Exon inclusion of MBNL2, MBNL1, CLASP1, and MAP3K4 measured by ddPCR (x-axis) vs. RT-PCR (y-axis) in all subjects. The correlation coefficient r and P values are shown
Fig. 6
Fig. 6
Droplet digital PCR (ddPCR) analysis of alternative splicing in human urine exRNA. We used ddPCR to examine alternative splicing of MBNL2 exon 6, MBNL1 exon 7, CLASP1 exon 20, and MAP3K4 exon 17 in urine exRNA samples from DM1 (N = 34–37), DM2 (N = 4), and UA controls (N = 24 or 25). Individual data points represent the mean of duplicate assays for each sample. a Quantification of MBNL2 splice products that include (MBNL2-6-7; left) and exclude exon 6 (MBNL2-5-7; right) in urine exRNA as transcript copies/μl cDNA. Error bars indicate mean ± s.e.m. ****P < 0.0001 (exon 6 inclusion, DM1 vs. UA); **P = 0.005 (exon 6 exclusion, DM1 vs. UA); one-way ANOVA. b Quantification of MBNL1 splice products that include (MBNL1-7-8; left) and exclude exon 7 (MBNL1-6-8; right) in urine exRNA as transcript copies/μl cDNA. Error bars indicate mean ± s.e.m. **P = 0.003 (exon 7 inclusion, DM1 vs. UA), and P = 0.005 (exon 7 exclusion, DM1 vs. UA); one-way ANOVA. c Quantification of CLASP1 splice products that include (CLASP1-20-21; left) and exclude exon 20 (CLASP1-19-21; right) in urine exRNA as transcript copies/μl cDNA. Error bars indicate mean ± s.e.m. ***P = 0.0009 (exon 20 exclusion, DM1 vs. UA); one-way ANOVA. d Quantification of MAP3K4 splice products that include (MAP3K4-17-18; left) and exclude exon 17 (MAP3K4-16-18; right) in urine exRNA as transcript copies/μl cDNA. Error bars indicate mean ± s.e.m. **P = 0.0025 (exon 17 inclusion, DM1 vs. UA); one-way ANOVA. e Mean total copies/μl cDNA (exon inclusion + exclusion values from a to d and Fig. 5) for each transcript in urine exRNA. Error bars indicate mean ± s.e.m. ****P < 0.0001 (all five transcripts combined, DM1 vs. UA) and (MBNL2, DM1 vs. UA); ***P < 0.001 (MBNL1, DM1 vs. UA); two-way ANOVA
Fig. 7
Fig. 7
Alternative spicing patterns in urine exRNA samples vs. biologic sex and CTG repeat length. a MAP3K4 exon 17 inclusion in females vs. males with DM1 and UA groups. Error bars indicate mean ± s.e.m. ****P < 0.0001 DM1 females vs. UA females and DM1 males vs. UA males; ** mean difference 8.7, 95% CI of difference 2.0–15.3 (DM1 females vs. DM1 males) and mean difference 10.9, 95% CI of difference 2.3–19.4 (UA females vs. UA males). b MAP3K4 exon 17 inclusion vs. DMPK gene CTG repeat length in females (black) and males (blue) with DM1. The correlation coefficient r and P values for each are shown
Fig. 8
Fig. 8
ddPCR analysis of alternative splicing in urine cell total RNA and correlation with splicing in urine exRNA. We used ddPCR to determine the alternative splicing pattern in urine cell RNA of DM1 (N = 22–24) and UA (N = 12–14) subjects and correlated with splicing patterns in exRNA obtained from the same sample. a Left, INSR exon 11 inclusion in urine cell total RNA. *P = 0.04; t test. Right, correlation of INSR exon 11 inclusion in urine cells with exon 11 inclusion in urine exRNA. The correlation coefficient r and P values are shown. b Left, MBNL2 exon 6 inclusion in urine cell total RNA. Note that values for two DM1 and one UA specimen were undetectable. ****P < 0.0001; t test. Right, correlation of MBNL2 exon 6 inclusion in urine cells with exon 6 inclusion in urine exRNA. The correlation coefficient r and P values are shown. c Left, MBNL1 exon 7 inclusion in urine cell total RNA. Note that values for one DM1 and two UA specimens were undetectable. ***P = 0.0008; t test. Right, correlation of MBNL1 exon 7 inclusion in urine cells with exon 7 inclusion in urine exRNA. The correlation coefficient r and P values are shown. d Left, CLASP1 exon 20 inclusion in urine cell total RNA. Note that values for two DM1 and one UA specimen were undetectable. **P = 0.005; t test. Right, correlation of CLASP1 exon 20 inclusion in urine cells with exon 20 inclusion in urine exRNA. The correlation coefficient r and P values are shown. e Left, MAP3K4 exon 17 inclusion in urine cell total RNA. Note that, due to exhaustion of supply, only N = 17 DM1 and N = 8 UA specimens were available for analysis. *P = 0.01; t test. Right, correlation of MAP3K4 exon 17 inclusion in urine cells with exon 17 inclusion in urine exRNA. The correlation coefficient r and P values are shown. All error bars indicate mean ± s.e.m.
Fig. 9
Fig. 9
Urine exRNA alternative splicing and composite biomarker scores as a function of symptoms. a ddPCR quantification of INSR, MBNL2, MBNL1, CLASP1, and MAP3K4 alternative splicing in urine exRNA of congenital (N = 4 or 5), juvenile-onset (N = 6), adult-onset (N = 22 to 24), and asymptomatic adult (N = 3) DM1 patients, and in adult UA controls (N = 25 or 26). ****P< 0.0001 (all five transcripts, adult-onset vs. UA) and (MBNL2 and MBNL1, asymptomatic vs. UA,); *** mean difference 13.1, 95% CI of difference 4.3–22.0 (MBNL2, adult-onset vs. asymptomatic); ** mean difference 19.9, 95% CI of difference 3.5–36.3 (CLASP1, asymptomatic vs. UA); * mean difference 9.6, 95% CI of difference 1.5–17.6 (MBNL1, adult-onset vs. asymptomatic), mean difference 14.2, 95% CI of difference 0.01–28.4 (MAP3K4, adult-onset vs. asymptomatic), and mean difference 14.7, 95% CI of difference 0.6–28.7 (MAP3K4, asymptomatic vs. UA); one-way ANOVA. b Composite biomarker scores generated by principal component analysis of ddPCR splicing measurements in urine exRNA (left) and urine cells (right) displayed as a function of symptom onset. See Supplementary Fig. 9 for splicing quantification of each transcript in urine cells. c ddPCR quantification of INSR, MBNL2, MBNL1, CLASP1, and MAP3K4 alternative splicing in urine exRNA of DM1 patients who were able to walk at least five steps on their heels while maintaining ankle dorsiflexion (a functional measure of ankle strength) (“+”; N = 19–22), and DM1 patients who were unable (“−”; N = 17). **** P < 0.0001 (all five transcripts, DM1-Unable vs. UA, and DM1-Able vs. UA); ** mean difference 13.2, 95% CI of difference 3.1–23.2 (INSR, DM1-Unable vs. DM1-Able), and mean difference 8.0, 95% CI of difference 1.7–14.4 (MAP3K4, DM1-Unable vs. DM1-Able); one-way ANOVA. d Composite biomarker scores for urine exRNA (left) and urine cells (right) displayed as a function of the ability to heel walk. All error bars indicate mean ± s.e.m.
Fig. 10
Fig. 10
Pharmacologic exon skipping activity of eteplirsen in human urine. Using RT-PCR and ddPCR, we examined urine exRNA and urine cell RNA in two non-ambulatory individuals with DMD who have been treated with 30 mg/kg eteplirsen weekly for ~3 years. a Left, using RT-PCR and primers targeting exons 44 and 52, two bands are identified in urine exRNA and urine cell total RNA (N = 5 replicates each) from a non-ambulatory 17 year-old DMD patient (S7) with an exon 45–50 deletion. Right, sequencing of the lower-band PCR product. b ddPCR analysis of urine exRNA and urine cell total RNA (N = 4 replicates each) from S7 using separate probe sets that are specific for DMD transcripts with exon 51 included (51–52) or skipped (44–52). c Individual data points indicate quantification of DMD splice products in urine exRNA and urine cell total RNA (N = 4 replicates each) that have exon 51 included (+) or skipped (−) as copies per microliter of cDNA. d Calculation of percent exon 51 inclusion in urine exRNA and urine cells using the data in c. e Left, using RT-PCR and primers targeting exons 49 and 53, two bands are identified in urine exRNA and urine cell total RNA from a non-ambulatory 19 year-old DMD patient (S8) with an exon 52 deletion. UA muscle tissue RNA served as a control. Right, sequencing of the urine exRNA PCR products. f ddPCR analysis of urine exRNA and urine cell total RNA (N = 4 replicates each) from S8 using separate probe sets that are specific for DMD 52 deletion transcripts with exon 51 included (51–53) or skipped (50–53). g Individual data points indicate quantification of DMD splice products in urine exRNA and urine cell total RNA (N = 4 replicates each) that have exon 51 included (+) or skipped (−) as copies per microliter of cDNA. h Calculation of percent exon 51 inclusion in urine exRNA and urine cells using the data in (g). All error bars indicate mean ± s.e.m.

References

    1. Scotti MM, Swanson MS. RNA mis-splicing in disease. Nat. Rev. Genet. 2016;17:19–32. doi: 10.1038/nrg.2015.3. - DOI - PMC - PubMed
    1. Kanadia RN, et al. A muscleblind knockout model for myotonic dystrophy. Science. 2003;302:1978–1980. doi: 10.1126/science.1088583. - DOI - PubMed
    1. Lin X, et al. Failure of MBNL1-dependent post-natal splicing transitions in myotonic dystrophy. Hum. Mol. Genet. 2006;15:2087–2097. doi: 10.1093/hmg/ddl132. - DOI - PubMed
    1. Nakamori M, et al. Splicing biomarkers of disease severity in myotonic dystrophy. Ann. Neurol. 2013;74:862–872. doi: 10.1002/ana.23992. - DOI - PMC - PubMed
    1. Wheeler TM, et al. Reversal of RNA dominance by displacement of protein sequestered on triplet repeat RNA. Science. 2009;325:336–339. doi: 10.1126/science.1173110. - DOI - PMC - PubMed

Publication types

MeSH terms