

Compound-specific δ15N composition of free amino acids in moss as indicators of atmospheric nitrogen sources
- PMID: 30254224
- PMCID: PMC6156404
- DOI: 10.1038/s41598-018-32531-x
Compound-specific δ15N composition of free amino acids in moss as indicators of atmospheric nitrogen sources
Abstract
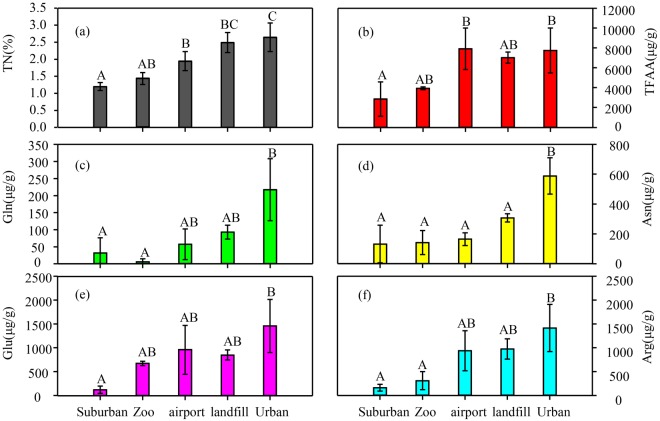
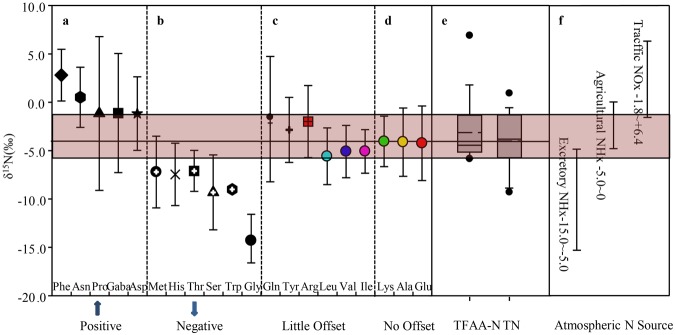
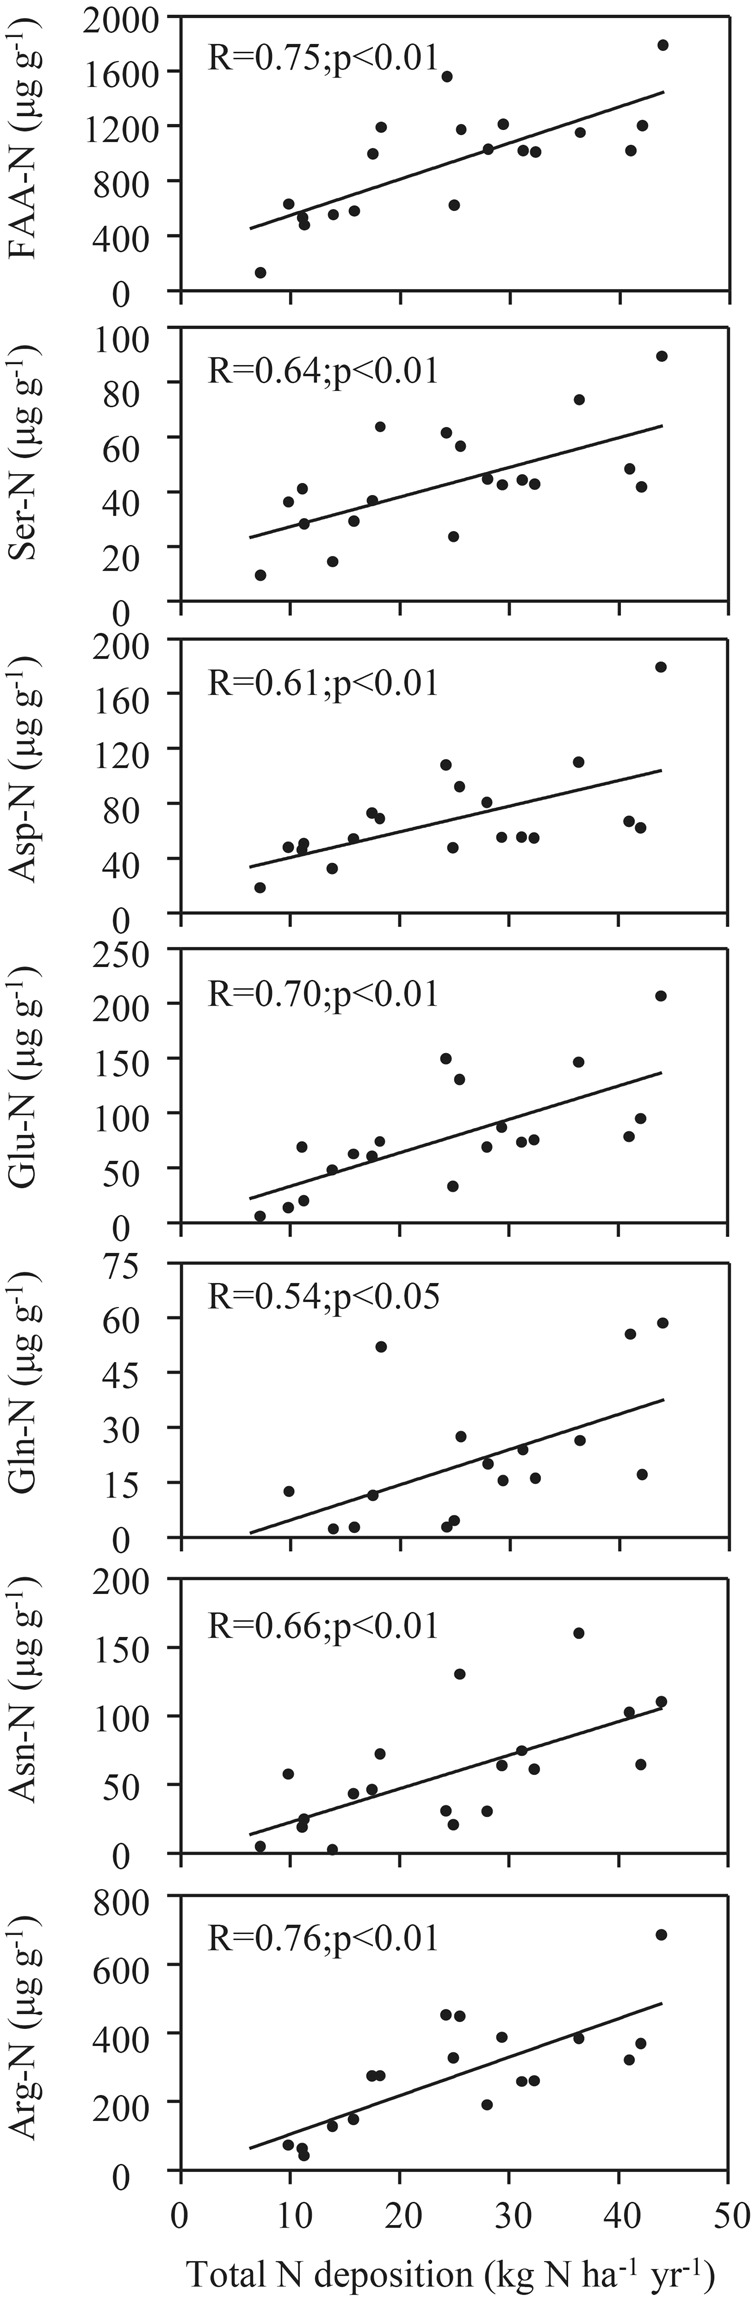
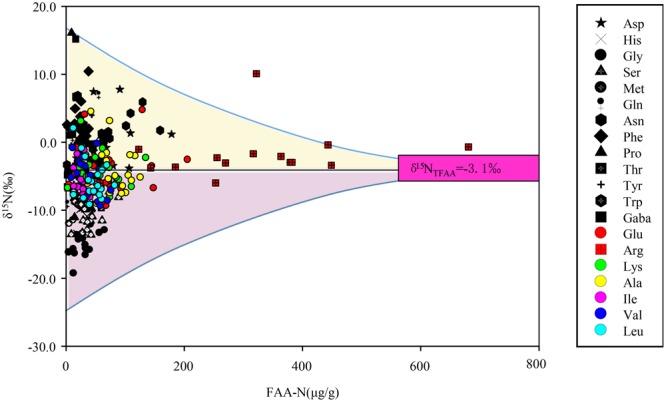
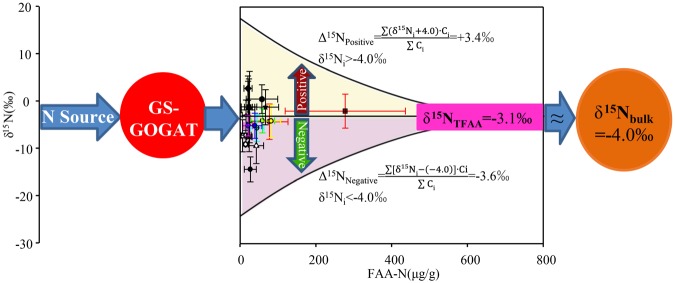
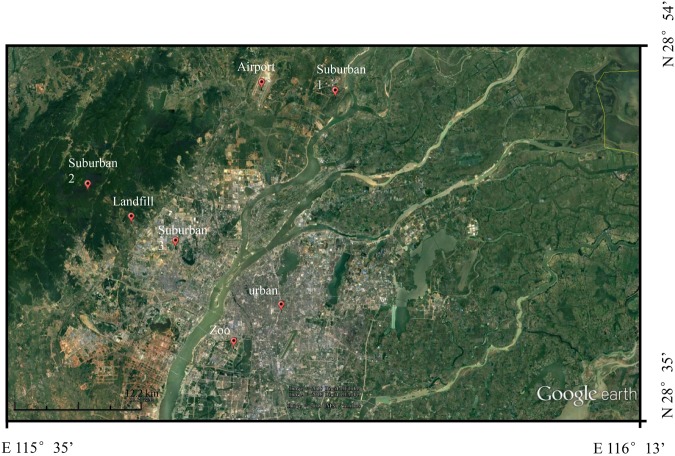
Haplocladium microphyllum moss samples were collected in Nanchang, China. Free amino acid (FAA) concentrations and N isotope compositions (δ15NFAA) in the samples were determined and compared with the bulk N concentrations and δ15Nbulk values. The aim was to determine whether δ15NFAA values in moss (which are very variable) indicate the sources of atmospheric N. The δ15NFAA values among individual FAA varied widely (from -19.3‰ to +16.1‰), possibly because of the different sources of N and isotope fractionation in amino acids metabolic pathways. Total 15N-enrichment for the individual FAAs was equal to total 15N-depletion relative to δ15Nbulk. The concentration-weighted mean δ15N value for total FAAs (TFAA) (δ15NTFAA) was -3.1‰ ± 3.2‰, which was similar to δ15Nbulk (-4.0‰ ± 2.9‰). We concluded that a N isotope balance occurred during amino acid metabolism and that little isotope disparity occurred between the concentration-weighted TFAA and bulk N. We concluded that δ15NTFAA ≈ δ15Nbulk ≈ δ15Nsource. The mean δ15Nalanine (-4.1‰), δ15Nglutamate (-4.2‰), and δ15Nlysine (-4.0‰) were similar to the mean δ15Nbulk, which we attributed to little isotope fractionation occurring during their in situ the metabolic pathways. This suggests that δ15Nalanine, δ15Nglutamate, and δ15Nlysine in moss can be used to indicate the sources of atmospheric N deposition.
Conflict of interest statement
The authors declare no competing interests.
Figures
Similar articles
-
Sulfur isotopic signatures in rainwater and moss Haplocladium microphyllum indicating atmospheric sulfur sources in Nanchang City (SE China).Sci Total Environ. 2011 May 1;409(11):2127-32. doi: 10.1016/j.scitotenv.2011.02.011. Epub 2011 Mar 22. Sci Total Environ. 2011. PMID: 21429561
-
Effects of chemical preservation on bulk and amino acid isotope ratios of zooplankton, fish, and squid tissues.Rapid Commun Mass Spectrom. 2019 May 30;33(10):935-945. doi: 10.1002/rcm.8408. Rapid Commun Mass Spectrom. 2019. PMID: 30730594
-
Pitfalls and new mechanisms in moss isotope biomonitoring of atmospheric nitrogen deposition.Environ Sci Technol. 2012 Nov 20;46(22):12557-66. doi: 10.1021/es300779h. Epub 2012 Nov 2. Environ Sci Technol. 2012. PMID: 23050838
-
Influence of canopy drip on the indicative N, S and δ(15)N content in moss Hypnum cupressiforme.Environ Pollut. 2014 Jul;190:27-35. doi: 10.1016/j.envpol.2014.03.016. Epub 2014 Apr 3. Environ Pollut. 2014. PMID: 24704808
-
A review on moss nitrogen and isotope signatures evidence for atmospheric nitrogen deposition.Sci Total Environ. 2022 Feb 1;806(Pt 4):150765. doi: 10.1016/j.scitotenv.2021.150765. Epub 2021 Oct 16. Sci Total Environ. 2022. PMID: 34666089 Review.
Cited by
-
Compound-Specific 14N/15N Analysis of Amino Acid Trimethylsilylated Derivatives from Plant Seed Proteins.Int J Mol Sci. 2022 Apr 28;23(9):4893. doi: 10.3390/ijms23094893. Int J Mol Sci. 2022. PMID: 35563286 Free PMC article.
-
Kinetic nitrogen isotope effects of 18 amino acids degradation during burning processes.Sci Rep. 2024 Jun 24;14(1):14559. doi: 10.1038/s41598-024-65544-w. Sci Rep. 2024. PMID: 38914616 Free PMC article.
References
-
- Galloway JN, et al. Nitrogen cycles: past, present, and future. Biogeochemistry. 2004;70:153–226. doi: 10.1007/s10533-004-0370-0. - DOI
-
- Vitousek PM, et al. Technical Report: Human Alteration of the Global Nitrogen Cycle: Sources and Consequences. Ecological Applications. 1997;7:737–750.
Publication types
MeSH terms
Substances
Grants and funding
LinkOut - more resources
Full Text Sources
Other Literature Sources
Miscellaneous
