. 2018 Sep 25;9(1):3908.
doi: 10.1038/s41467-018-06400-0.

Chirality amplification by desymmetrization of chiral ligand-capped nanoparticles to nanorods quantified in soft condensed matter

Affiliations

Chirality amplification by desymmetrization of chiral ligand-capped nanoparticles to nanorods quantified in soft condensed matter

Ahlam Nemati et al. Nat Commun. .

Abstract

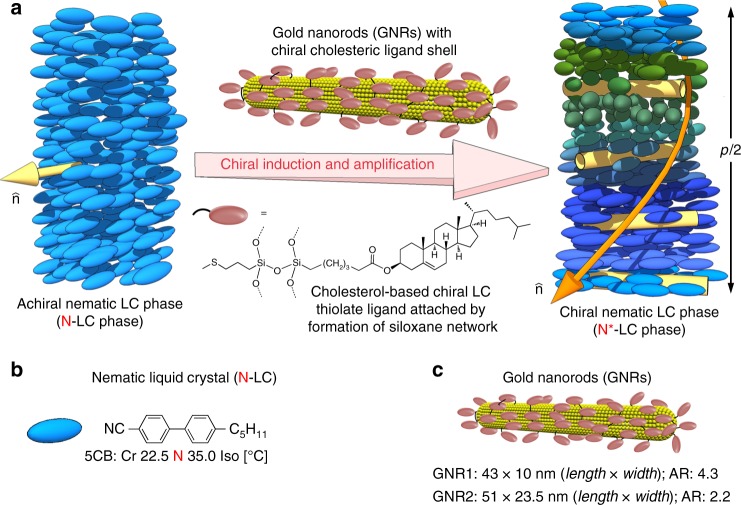
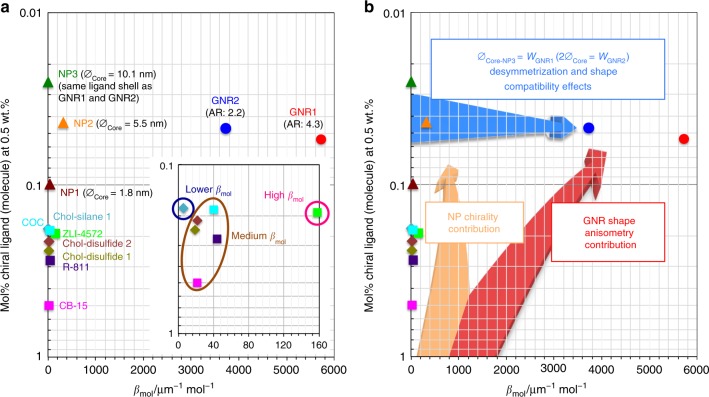
Induction, transmission, and manipulation of chirality in molecular systems are well known, widely applied concepts. However, our understanding of how chirality of nanoscale entities can be controlled, measured, and transmitted to the environment is considerably lacking behind. Future discoveries of dynamic assemblies engineered from chiral nanomaterials, with a specific focus on shape and size effects, require exact methods to assess transmission and amplification of nanoscale chirality through space. Here we present a remarkably powerful chirality amplification approach by desymmetrization of plasmonic nanoparticles to nanorods. When bound to gold nanorods, a one order of magnitude lower number of chiral molecules induces a tighter helical distortion in the surrounding liquid crystal-a remarkable amplification of chirality through space. The change in helical distortion is consistent with a quantification of the change in overall chirality of the chiral ligand decorated nanomaterials differing in shape and size as calculated from a suitable pseudoscalar chirality indicator.


Conflict of interest statement

The authors declare no competing interests.

Figures

Fig. 1
Fig. 1
Materials and approach to testing chiral amplification. a Schematic representations of the N*-LC phase induced by addition of minute amounts of chiral cholesterol-capped GNRs into an achiral N-LC host. b The N-LC host 5CB. c Depiction of and values for length, width, and aspect ratio (AR) for GNR1 and GNR2
Fig. 2
Fig. 2
Gold nanorod characterization. TEM images of: (a) GNR1 and (b) GNR2–scale bars: 50 nm (insets show different sections of the TEM grids–scale bars: 40 nm). Vis-NIR spectra of: (c) GNR1 (red data points) and (d) GNR2 (blue data points) after siloxane condensation with the Chol-silane 1 ligand using intermediate (3-mercaptopropyl)trimethoxysilane (MPS)-coated GNRs, starting from CTAB-coated GNRs (black data points). e Photographs of vials of the GNRs in a biphasic CHCl3-water mixture before phase transfer (as CTAB-coated GNRs) dispersed in the aqueous phase and after phase transfer (after siloxane condensation) in the organic phase indicated by the dark purple color. f Representative CD spectrum of GNR1 in cyclohexane (inset shows the 200–300 nm spectral region). The CD spectrum of GNR2 is identical. g Comparison of experimental (TGA) weight loss data with calculated data for the weight fraction of the organic coating (ligand shell) using two independent methods detailed in the Supplementary Information (Supplementary Note 4)
Fig. 3
Fig. 3
Helical pitch measurements. a Representation showing the orientation of the helical axis parallel to the substrate in cells treated to favor homeotropic anchoring. The half-pitch p/2 is measured as the distance between two dark extinction lines by POM. b Representation showing the spatially varying director orientation at free surfaces (bottom substrate: plain glass; top substrate: air). The determination of p/2 is identical. c Drawing schematically depicting a Cano wedge cell and an example of an N*-LC-filled wedge cell with Grandjean Cano defect lines (steps) used to measure and calculate p. For details see Supplementary Note 9. dg POM photomicrographs (crossed polarizers) of homeotropic cells of 5CB doped with GNR1 at: (d) 0.1 wt.%, (e) 0.2 wt.%, (f) 0.3 wt.%, and (g) 0.5 wt.% (scale bars: 50 μm). hl POM photomicrographs (crossed polarizers) of free surface preparations of 5CB doped with GNR2 at: (h) 0.05 wt.%, (i) 0.1 wt.%, (j) 0.2 wt.%, (k) 0.3 wt.%, and (l), 0.5 wt.%. mq POM photomicrographs (crossed polarizers) of Cano wedge cells (with the glass surfaces modified to induce planar anchoring) of 5CB doped with GNR1 at: (m) 0.1 wt.%, (n) 0.2 wt.%, (o) 0.3 wt.%, (p) 0.4 wt.%, and (q) 0.5 wt.% (for more details on POM image analysis and determination of p, see Supplementary Note 9, Supplementary Figs. 15–26)
Fig. 4
Fig. 4
Catalogue of chiral additives. Chemical structures and additional information on the chiral additives in 5CB compared in this study (see Table 1): (a) chiral ligands, (b) chiral ligand-capped Au NPs, (c) chiral ligand-functionalized GNRs, and (d) commercially available chiral additives with a range of βW and βmol values
Fig. 5
Fig. 5
Chirality transfer efficiency. a Plot of the molar helical twisting power βmol (μm−1 mol−1) vs. the concentration (mol fraction, mol%) calculated for 0.5 wt.% of the chiral additive. Diamonds and squares represent the neat organic chiral additives (blue diamonds: Chol-silane 1, dark green diamonds: Chol-disulfide 1, brown diamonds: Chol-disulfide 2, pink squares: CB-15, light blue squares: COC, green squares: ZLI-4572, and purple squares: R811), triangles the chiral ligand-capped Au NPs (dark brown triangles: NP1, orange triangles: NP2, and green triangles: NP3), and circles the two cholesterol-functionalized GNRs (red circles: GNR1 and blue circles: GNR2). b The same plot highlighting the specific contributions of inherent NP chirality, anisometry of the GNRs and desymmetrization from chiral ligand-capped Au NPs to GNRs. Chiral correlation or persistence lengths are the lowest at the origin and highest in the top-right corner of this plot
Fig. 6
Fig. 6
Freeze-fracture transmission electron microscopy images of induced N*-LC droplets. a Schematic depiction of the freeze-fracture method to prepare the TEM specimen. b A representative voxel of the droplet showing the multi-domain structure via the embedded GNRs. c, d FF-TEM images of the induced N*-LC phase of Felix-2900–03 containing 0.5 wt.% GNR2 (scale bars: c 200 nm and d 1 μm, apparent circles are from the TEM grids). To obtain these images, it was important that the replica captured most of the GNRs on the fractured surface, thereby providing a direct visualization of the GNRs in the bulk material. Areas highlighted by a yellow box and eh select areas from many of the obtained FF-TEM images show GNR arrays (often twisted) with an average separation close to the calculated DP–P values (scale bars in eh: 100 nm)
Fig. 7
Fig. 7
Schematic illustration of the persistence (correlation) length. a Idealized distribution of the cholesterol-capped GNRs in the induced N*-LC bulk assuming planar boundary conditions: the interparticle distances given are for 0.5 wt.% GNR1 in 5CB with a helical pitch p = 1.5 μm; DP-P values were calculated for both GNR1 and GNR2. b, c Photographs showing blue or green iridescent (reflection) colors depending on the viewing angle of thin films of 5CB containing 0.6 wt.% of GNR1 between polyimide-coated glass slides promoting planar anchoring (cell gap: 10 μm, scale bar: 0.5 cm). d Photograph of glass vial containing 5CB doped with 0.5 wt.% GNR1 showing iridescence due to wavelength- and angle-dependent Bragg-type reflections (scale bar: 0.5 cm). e 3D chirality transfer efficiency plot: (βmol vs. concentration) vs. DP-P (for symbol legend see caption Fig. 5). f Plot of the inverse helical pitch 1/p (μm−1) vs. the concentration (wt.%) of GNR1 (red) and GNR2 (blue) in 5CB. A cooperative effect between neighboring GNRs, once a certain minimum distance between them is reached, causes a sudden substantial increase (jump) in the 1/p data. The hypothetical dashed green line shows the trend generally observed for organic chiral dopants–a linear relationship at lower concentrations of the chiral additive that plateaus once a certain concentration is reached, i.e., the helical pitch p begins to saturate at this point. The sudden drop in 1/p value at a concentration of 0.7 wt.% of GNR1 in 5CB suggests the onset of GNR aggregation (dashed circle). g Photograph of a firecracker ladder: the steps representing the chiral ligand-capped GNRs inducing the helical twist in the rope
Fig. 8
Fig. 8
Atomistic and coarse-grained representation of the Chol-silane molecule. a Full representation of a chiral ligand molecule. b Coarse-grained description of the same ligand molecule, where only 5 of the original 118 atoms were retained: one Si, one S and three C atoms. c GNR1 spherocylindrical nanoparticle decorated with 20 CG Chol-silane ligands randomly distributed. d NP3 quasi-spherical Au nanoparticle bound to the same number of Chol-silane molecules in the Coarse Grained representation
Fig. 9
Fig. 9
Trends of averaged chirality indicator Goaa for the Au NPs and the GNRs with 20 CG ligands. Values of chirality have been obtained for 20,000 random configurations on Au NPs and 1,800 selected configurations on GNRs. The cholesterol ligand molecules are bound to the Au NPs at random positions and orientations, while every combination of selected positions/orientations is analyzed for systems with GNRs

Similar articles

Cited by

References

    1. Blackmond DG. The origin of biological homochirality. Cold Spring Harb. Perspect. Biol. 2010;2:a002147. doi: 10.1101/cshperspect.a002147. - DOI - PMC - PubMed
    1. Hein JE, Blackmond DG. On the origin of single chirality of amino acids and sugars in biogenesis. Acc. Chem. Res. 2012;45:2045–2054. doi: 10.1021/ar200316n. - DOI - PubMed
    1. Gooth J, et al. Experimental signatures of the mixed axial-gravitational anomaly in the Weyl semimetal NbP. Nature. 2017;547:324–327. doi: 10.1038/nature23005. - DOI - PubMed
    1. Godinho MH, Canejo JP, Pinto LFV, Borges JP, Teixeira PIC. How to mimic the shapes of plant tendrils on the nano and microscale: spirals and helices of electrospun liquid crystalline cellulose derivatives. Soft Matter. 2009;5:2772–2776. doi: 10.1039/b821631b. - DOI
    1. Wang M, Lin BP, Yang H. A plant tendril mimic soft actuator with phototunable bending and chiral twisting motion modes. Nat. Commun. 2016;7:13981. doi: 10.1038/ncomms13981. - DOI - PMC - PubMed

Publication types

LinkOut - more resources