. 2018 Sep 25;9(1):3742.
doi: 10.1038/s41467-018-06199-w.

Predicting nutrient content of ray-finned fishes using phylogenetic information

Affiliations

Predicting nutrient content of ray-finned fishes using phylogenetic information

Bapu Vaitla et al. Nat Commun. .

Abstract

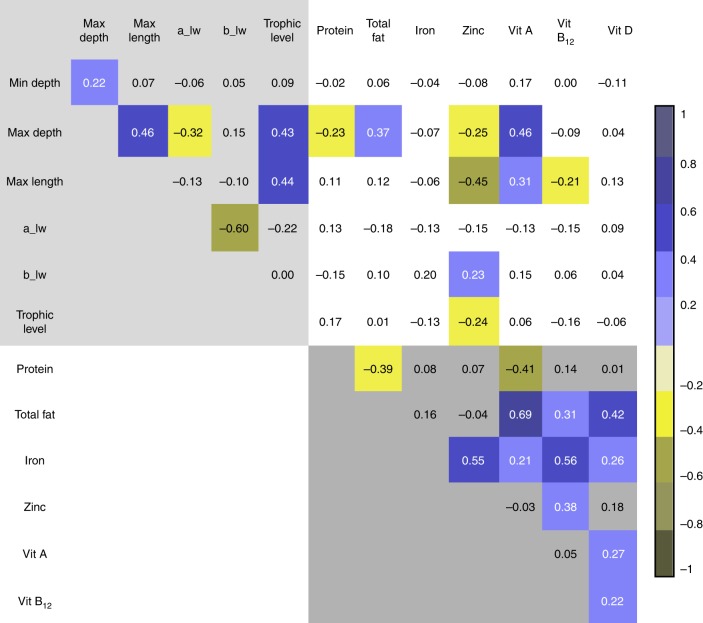
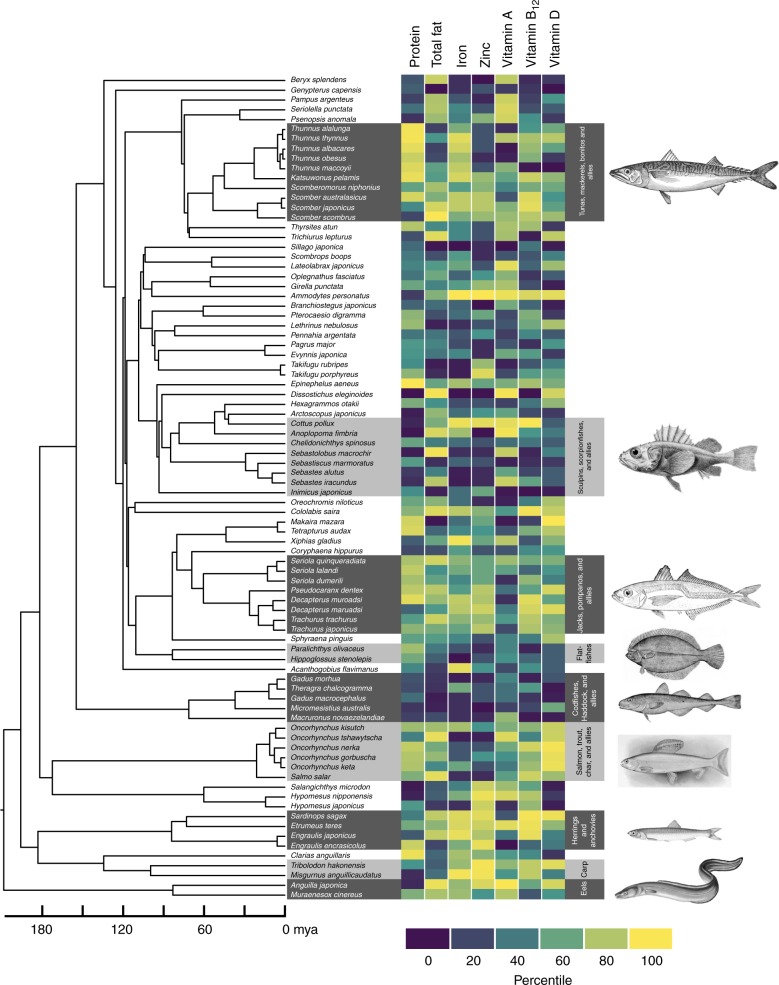
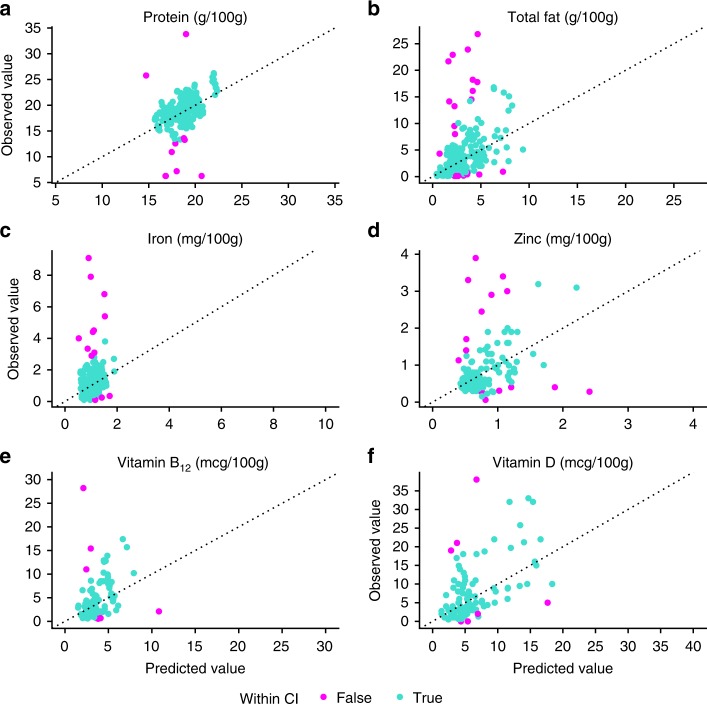
Human food and nutrition security is dependent on marine ecosystems threatened by overfishing, climate change, and other processes. The consequences on human nutritional status are uncertain, in part because current methods of analyzing fish nutrient content are expensive. Here, we evaluate the possibility of predicting nutrient content of ray-finned fishes using existing phylogenetic and life history information. We focus on nutrients for which fish are important sources: protein, total fat, omega-3 and omega-6 fatty acids, iron, zinc, vitamin A, vitamin B12, and vitamin D. Our results show that life history traits are weak predictors of species nutrient content, but phylogenetic relatedness is associated with similar nutrient profiles. Further, we develop a method for predicting the nutrient content of 7500+ species based on phylogenetic relationships to species with known nutrient content. Our approach is a cost-effective means for estimating potential changes in human nutrient intake associated with altered access to ray-finned fishes.


Conflict of interest statement

The authors declare no competing interests.

Figures

Fig. 1
Fig. 1
Evolutionary correlation matrix of key variables, log-transformed. Colored cells indicate correlations significant at p < 0.1 (Pearson’s r). Lightly shaded top left corner shows correlations between life history variables; darkly shaded bottom right corner shows correlations between nutrient variables. Unshaded top right corner shows correlations between life history and nutrient variables. The variables 'min depth' and 'max depth' refer to habitat preferences. 'Max length' refers to maximum reported length of the species. The variables 'a_lw' and 'b_lw' refer to the scalar and exponential parameters in the length-weight relationship equation W = aLb, wherein W is weight and L is length. 'Trophic level' refers to the weighted mean of the trophic level of the diet of the species. See Table 1 for more details
Fig. 2
Fig. 2
Phylogenetic relationships and nutrient content, expressed in percentiles. Eighty-four of the most commercially and nutritionally important of the 371 species in the database described above are shown. The time-scale is shown as millions of years ago (mya). The color scales indicate percentiles of nutrient content; see Supplementary Table 1 for ranges of each variable. Common names and pictorial representations of select groups of fishes are shown. All images are taken from Wikipedia, and are Public Domain images
Fig. 3
Fig. 3
Predicted versus observed values for selected nutrients using phylogenetic signal only. Points in green fall within the 95% prediction interval; points in red are outside the interval. The diagonal represents points where predictions are equal to observed values

References

    1. Pauly D, Zeller D. Catch reconstructions reveal that global marine fisheries catches are higher than reported and declining. Nat. Commun. 2016;7:10244. doi: 10.1038/ncomms10244. - DOI - PMC - PubMed
    1. Cheung WWL, et al. Large-scale redistribution of maximum fisheries catch potential in the global ocean under climate change. Glob. Change Biol. 2009;16:24–35. doi: 10.1111/j.1365-2486.2009.01995.x. - DOI
    1. Cheung WWL, Watson R, Pauly D. Signature of ocean warming in global fisheries catch. Nature. 2013;497:365–368. doi: 10.1038/nature12156. - DOI - PubMed
    1. Perry AL, Low PJ, Ellis JR, Reynolds JD. Climate change and distribution shifts in marine fishes. Science. 2005;308:1912–1915. doi: 10.1126/science.1111322. - DOI - PubMed
    1. Pinsky ML, Worm B, Fogarty MJ, Sarmiento JL, Levin SA. Marine taxa track local climate velocities. Science. 2013;341:1239–1242. doi: 10.1126/science.1239352. - DOI - PubMed

Publication types

Substances

LinkOut - more resources