. 2018 Sep 25;9(1):3894.
doi: 10.1038/s41467-018-06222-0.

Single cell molecular alterations reveal target cells and pathways of concussive brain injury

Affiliations

Single cell molecular alterations reveal target cells and pathways of concussive brain injury

Douglas Arneson et al. Nat Commun. .

Abstract

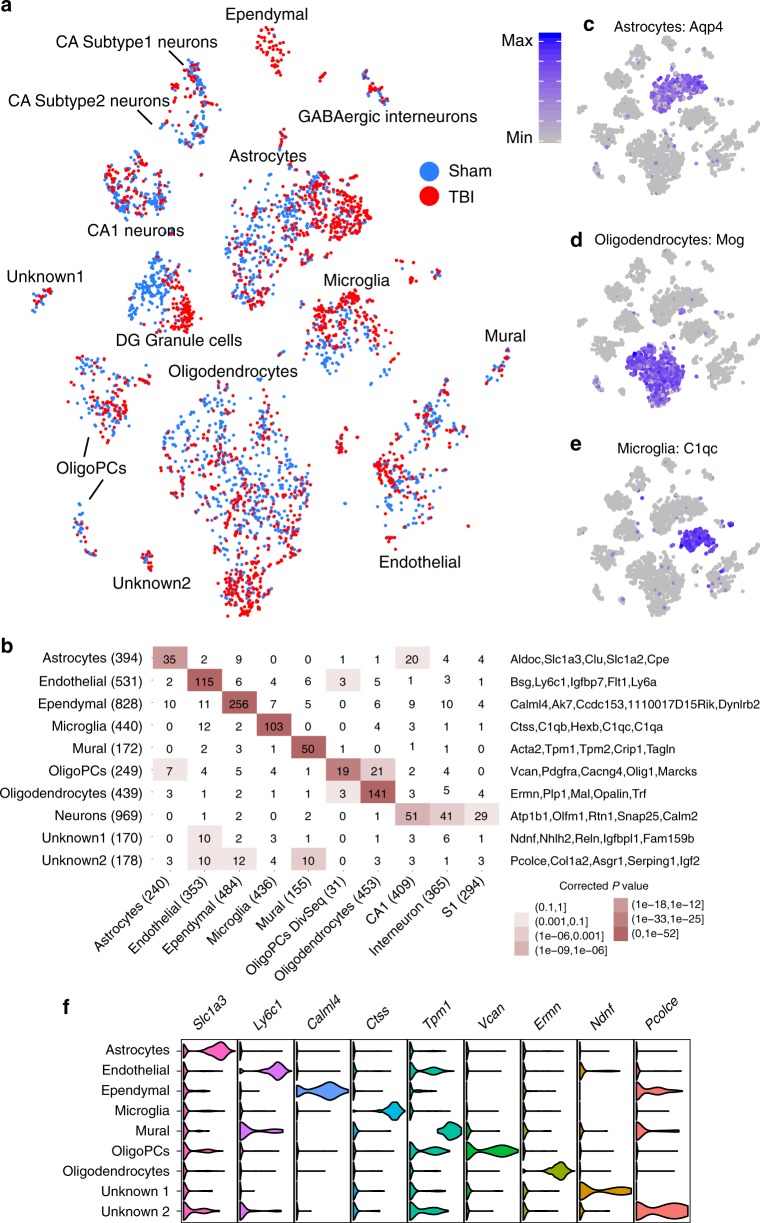
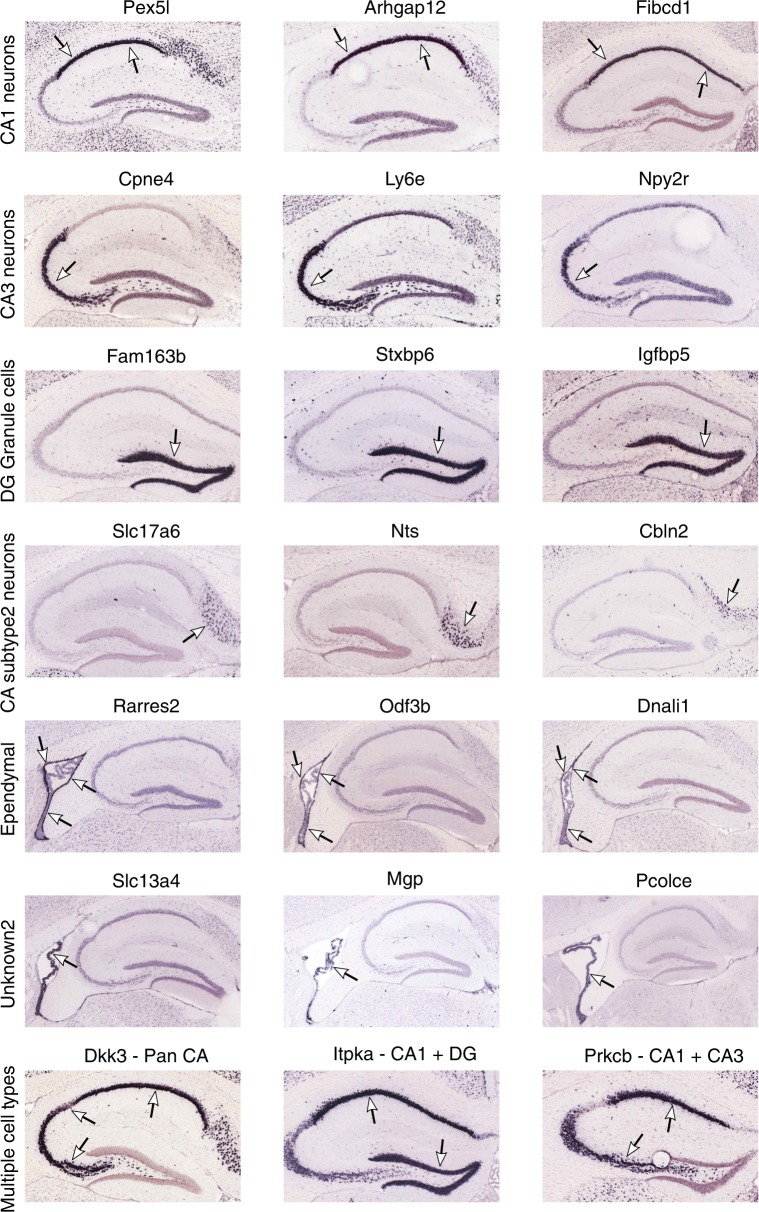
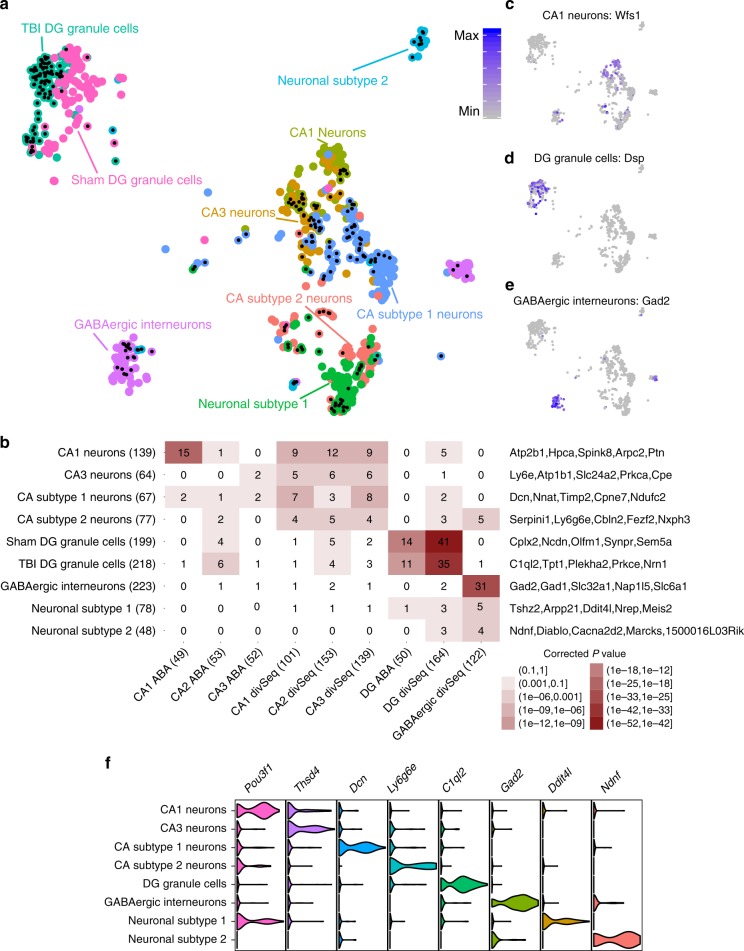
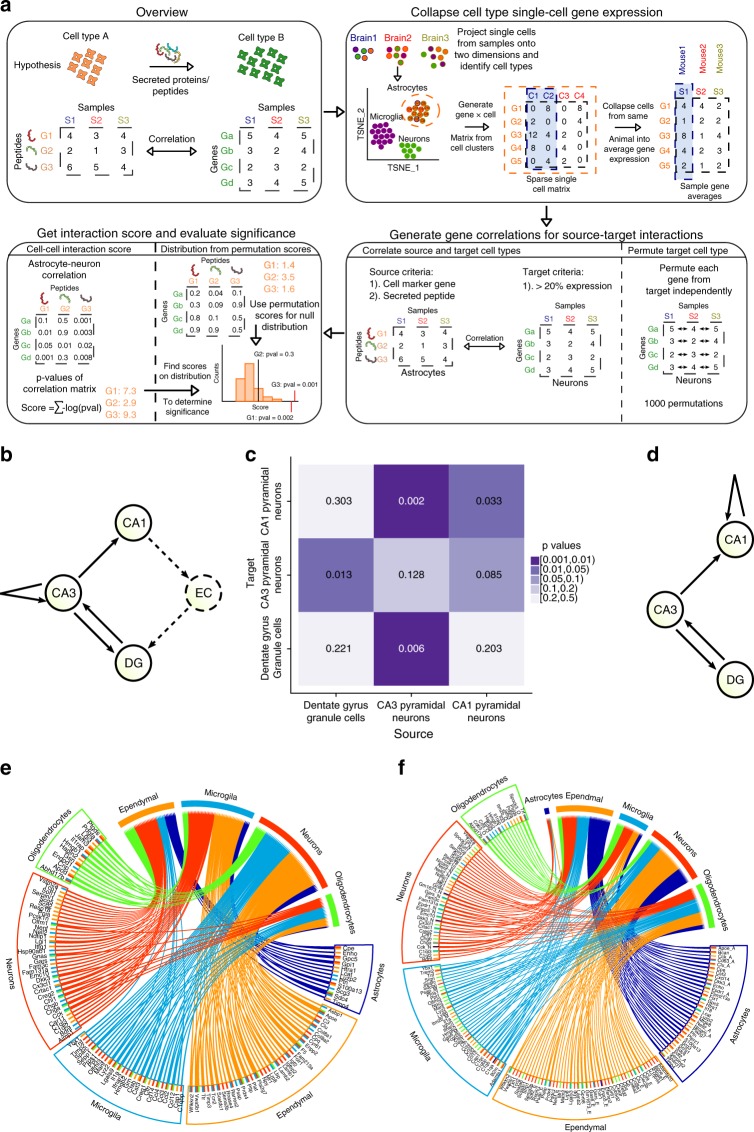
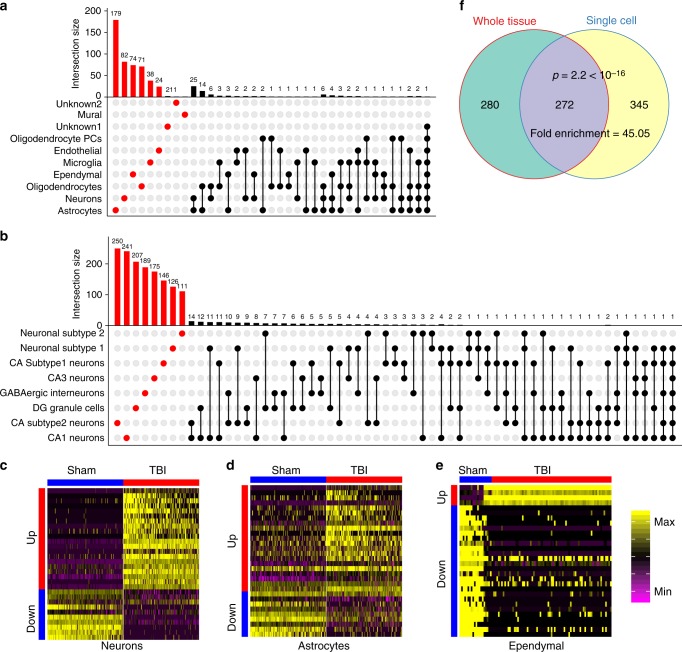
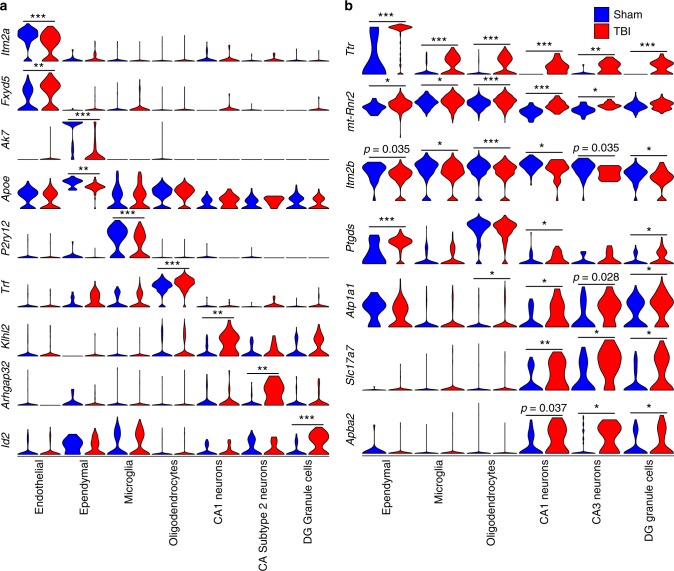
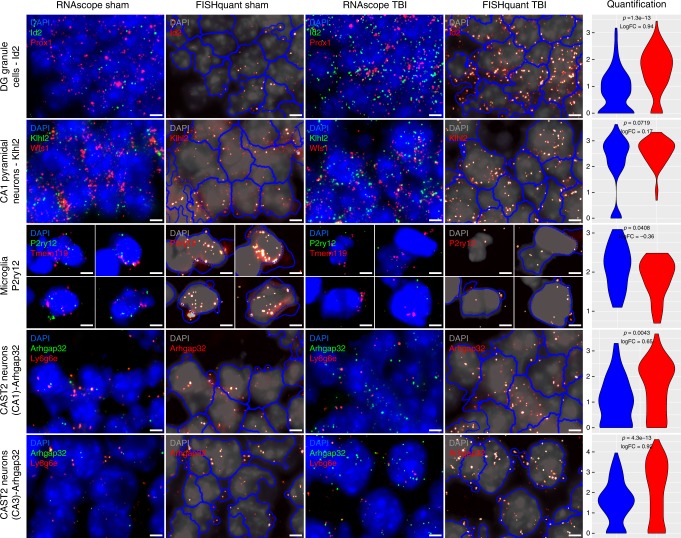
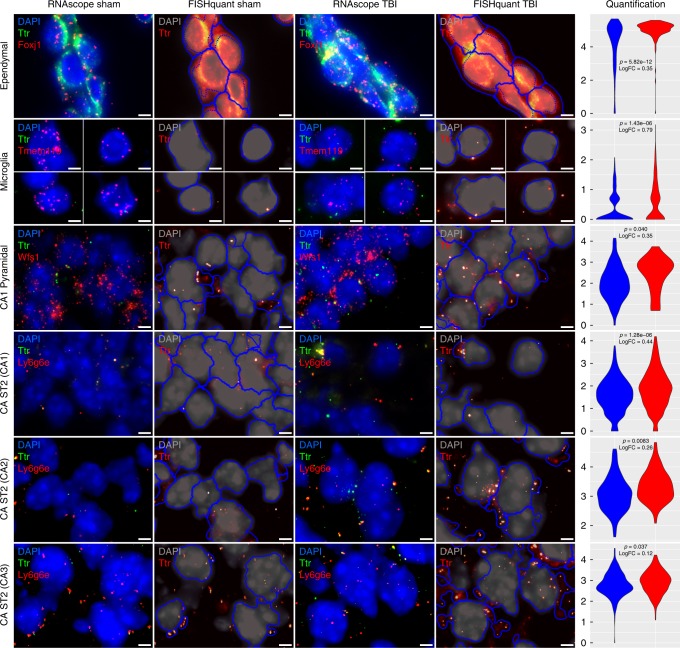
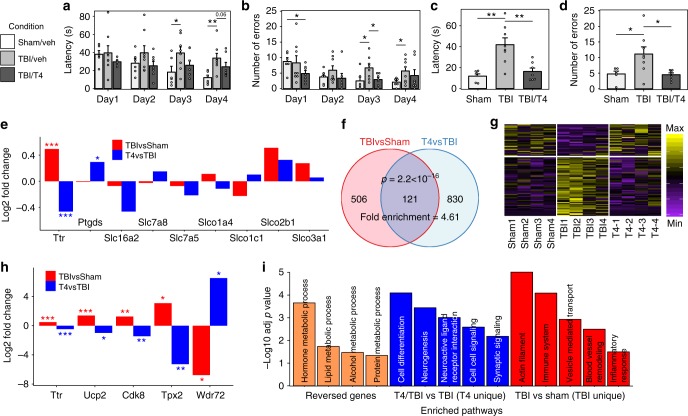
The complex neuropathology of traumatic brain injury (TBI) is difficult to dissect, given the convoluted cytoarchitecture of affected brain regions such as the hippocampus. Hippocampal dysfunction during TBI results in cognitive decline that may escalate to other neurological disorders, the molecular basis of which is hidden in the genomic programs of individual cells. Using the unbiased single cell sequencing method Drop-seq, we report that concussive TBI affects previously undefined cell populations, in addition to classical hippocampal cell types. TBI also impacts cell type-specific genes and pathways and alters gene co-expression across cell types, suggesting hidden pathogenic mechanisms and therapeutic target pathways. Modulating the thyroid hormone pathway as informed by the T4 transporter transthyretin Ttr mitigates TBI-associated genomic and behavioral abnormalities. Thus, single cell genomics provides unique information about how TBI impacts diverse hippocampal cell types, adding new insights into the pathogenic pathways amenable to therapeutics in TBI and related disorders.


Conflict of interest statement

The authors declare no competing interests.

Figures

Fig. 1
Fig. 1
Determination of major hippocampal cell types and cell type-specific gene markers. a t-SNE plot showing cell clusters. Each colored dot is a cell, with blue cells originating from Sham animals and red cells originating from mTBI animals. b Overlap between Drop-seq defined marker genes of major cell clusters (rows) with known cell type markers (columns) derived from a previous Fluidigm-based single cell study. Signature marker numbers are indicated in the parenthesis. Fisher’s exact test is used to test enrichment with Bonferroni adjusted p values reported. Statistical significance of overlap is indicated by color (the darker the more significant) and the numbers of overlapping genes between our Drop-seq defined markers, and previously known markers are shown in the cells. Top cell marker genes determined by our Drop-seq data are listed on the right of the plot. ce Cluster-specific expression of known cell markers: Astrocytes—Aqp4, Oligodendrocytes—Mog, and Microglia—C1qc. This analysis confirms that each cluster captures a particular cell type. f Normalized expression values of top cell type-specific marker genes are plotted as violin plots with cell types as rows and genes as columns. Cells were from 3 sham and 3 mTBI animals
Fig. 2
Fig. 2
Cross-validation of novel marker genes for specific neuronal subpopulations. To validate the specificity of novel marker genes for neuronal populations and to help resolve the identity of previously unknown cell clusters, we examined the expression patterns of our cell markers in the ISH images from the Allen Brain Atlas. Here, we showcase three select novel genes from four cell types: CA1 neurons, CA3 neurons, DG granule cells, and ependymal cells. Additionally, we showcase marker genes expressed across multiple cell types, genes which resolve the Unknown2 cluster to cells inside the choroid plexus, and genes which help resolve CA Subtype2 Neurons to the Subicular Complex
Fig. 3
Fig. 3
Determination of neuronal cell subtypes and cell type-specific gene markers. a t-SNE plot of neuronal subtypes determined by backspin biclustering. Each color indicates a different cell type cluster identified, and cells with a black dot at their center are from TBI samples. b Overlap of Drop-seq defined marker genes of the neuronal subtypes (rows) with those of the previously defined hippocampal neuronal cell types (columns). Known markers were derived from Alan Brain Atlas (ABA) and Habib et al. using Div-Seq. Signature marker numbers are indicated in the parenthesis. Fisher’s exact test is used to test enrichment with Bonferroni adjusted p values reported. Statistical significance of overlap is indicated by color (the darker the more significant), and the numbers of overlapping genes between our Drop-seq defined markers and previously known markers are shown in the cells. Top cell marker genes determined by our Drop-seq data are listed on the right of the plot. ce Cluster-specific expression of known cell markers: CA1 neurons—Wfs1, DG granule cells—Dsp, and GABAergic interneurons—Gad2. f Normalized expression values of top neuronal subtype-specific marker genes are plotted as violin plots with cell types as rows and genes as columns
Fig. 4
Fig. 4
TBI alters cell-cell gene co-expression in the hippocampus. a Cell-cell gene co-expression analysis method. Secreted proteins or peptides from a source cell can communicate with genes in a target cell, which can be captured by strong correlations between the secreted proteins in the source cells and genes in the target cells. For each cell cluster, the expression of each gene was summarized to individual animal level, and a correlation matrix between genes of different cell types was constructed. The -log10 p-values of the correlations for each secreted peptide are summed to obtain an interaction score of that peptide with a particular target cell type. The cell type gene expression matrix is then permuted to generate the null distribution of interaction scores to calculate the significance of observed interaction scores. b Schematic of known cell type interactions within the trisynaptic circuit. The entorhinal cortex (EC) is not captured in our single cell analysis so we cannot validate its edges (dashed). c Heatmap displaying the permutation-based p-values of glutamate-driven cell–cell gene coexpression; columns are source cells and rows are target cells. Darker purple indicates significant (lower p value) interactions. d Redrawn cell-cell interaction schematic based on our cell–cell gene coexpression method. All between-cell type interactions among CA1, CA3, and DG cells are recapitulated, but within cell type self-interactions differ from the known schematic in b. e, f Circos plots of significant cell-cell gene coexpression among hippocampal cell types in Sham (e) and TBI groups (f). The bottom half of each circos plot shows source cell types with secreted peptides listed and the top half are the target cell types (genes not shown because many genes show strong coexpression; listed in Supplementary Data 2). Colored lines in the center indicate significant connections of the peptides with different cell types. Comparison between e and f shows reorganization in the gene coexpression patterns among hippocampal cell types after TBI and the genes potentially driving the interactions. As cell transcriptome can instruct cell-cell communication to process high order information, these results suggest potential changes in neural circuit organization after an episode of TBI
Fig. 5
Fig. 5
Differentially expressed genes (DEGs) induced by TBI in hippocampal cell types. a, b DEGs unique to a cell type are indicated in red and those shared between ≥2 cell types are indicated by black dots. The histogram above each plot indicates the DEG counts for each category. a The majority of the DEGs are cell-type specific. b The majority of the DEGs in neuron subtypes are subtype-specific. ce Heatmaps of DEGs in select cell types demonstrate clear differential expression patterns between Sham and TBI cells. f Many cell-type specific DEGs cannot be captured in the bulk tissue analysis, supporting the uniqueness of using single cell genomic analysis. DEG overlap p-value was calculated using Fisher’s exact test
Fig. 6
Fig. 6
Top cell-type specific DEGs and pan-hippocampal DEGs. The normalized expression of cell-type specific (a) and pan-hippocampal (b) DEGs between Sham and TBI samples is displayed as violin plots. Single cells from Sham samples are indicated by the blue plots and single cells from TBI samples are indicated by the red plots. Likelihood-ratio test was used to determine statistical significance between Sham and TBI groups and FDR was calculated to correct for multiple testing. *FDR < 0.02, **FDR < 1 × 10−4, ***FDR < 1 × 10−6
Fig. 7
Fig. 7
Validation of select cell type specific DEGs using RNAscope in situ hybridization. Representative fluorescent microphotographs for Sham and TBI showing each DEG of interest (selected from Fig. 6a) along with cell marker genes with DAPI in the background. The RNAscope images for Sham (first column) and TBI (third column) display cell colocalization of each DEG (green) and the corresponding cell marker gene (red). The corresponding FISH-quant images for Sham (second column) and TBI (fourth column) show the automated cell segmentation (blue) overlayed on the 2D maximal projection of the DAPI z-stack images (gray) with the DEG of interest (green in the RNAscope images) indicated in bright dots. The quantification of the cell type specific DEGs is shown in the violin plots (5th column) with Sham in blue and TBI in red. Only cells which meet a certain count threshold for the cell type marker gene are considered the appropriate cell type and used in the DEG quantification (details in Methods). The ln(counts per cell) of the DEGs are shown on the y-axis with the p-value from a bimodal likelihood ratio test and log fold change (logFC) between TBI and Sham samples indicated. These figures have been zoomed in 5x from the original form to show high magnification detail of a few cells to more easily demonstrate colocalization of DEGs and cell markers. Lower magnification photos which indicate the region which was magnified are provided in Supplementary Fig. 11. Scale bars are 4 µm. Sample size was n = 8 mice/group
Fig. 8
Fig. 8
Validation of increased Ttr expression post-TBI using RNAscope in situ hybridization. Representative fluorescent microphotographs for Sham and TBI showing Ttr along with cell type markers with DAPI in the background. The RNAscope images for Sham (first column) and TBI (third column) display cell colocalization of Ttr (green) and the corresponding cell marker gene (red). The corresponding FISH-quant images for Sham (second column) and TBI (fourth column) show the automated cell segmentation (blue) overlayed on the 2D maximal projection of the DAPI z-stack images (gray) with Ttr (green in the RNAscope images) indicated in bright dots. The quantification of Ttr expression is shown in the violin plots (5th column) with Sham in blue and TBI in red. Only cells which meet a certain count threshold for the cell type marker gene are considered the appropriate cell type and used for Ttr quantification (details in Methods). The ln(counts per cell) of Ttr is shown on the y-axis with the p-value from a bimodal likelihood ratio test and log fold change (logFC) between TBI and Sham samples indicated. These figures have been zoomed in 5x from the original form to show high magnification detail of a few cells to more easily demonstrate colocalization between Ttr and cell type markers. Lower magnification photos which indicate the region which was magnified are provided in Supplementary Fig. 12. Scale bars are 4 µm. Sample size was n = 8 mice/group
Fig. 9
Fig. 9
Validation of T4 treatment effects. a, b T4 treatment effects on learning through measurement of latency (a) and number of errors (b). c, d T4 treatment improves memory through measurement of latency (c) and number of errors (d) in Barnes Maze test. Bargraphs display mean values with error bars representing the standard error of the mean. Two-sided t-test was used to determine significance. e Ttr is the primary thyroid hormone transporter responsive to TBI and T4 treatment compared to other known transporters. fh Gene expression profiles of T4 treatment experiments. f TBI and T4 treatment show significant overlap in DEGs. Signficance in overlap was determined using Fisher’s exact test. g Heatmap showing T4 reversed the expression patterns of 93 TBI-affected genes. h Examples of TBI genes reversed by T4. Significance of DEGs between the two conditions in e and h is determined by the negative binomial model, and the log2 fold change between two conditions based on the average gene expression values of the two groups was plotted on the y-axis. i Enriched pathways among the 93 TBI DEGs reversed by T4, pathways unique to T4 treatment (T4/TBIvsTBI) and those unique to TBI (TBIvsSham). Enrichment of pathways were determined using Fisher’s exact test with Bonferroni corrected p values used for statistical significance. Adjusted *p < 0.05, **p < 0.01, ***p < 0.001. Error bars are s.e.m. Sample size: ad Sham/Veh: n = 6, TBI/Veh: n = 8, TBI/T4: n = 7; e, h n = 4/group

Similar articles

Cited by

References

    1. Rohling ML, et al. A meta-analysis of neuropsychological outcome after mild traumatic brain injury: re-analyses and reconsiderations of Binder et al. (1997), Frencham et al. (2005), and Pertab et al. (2009) Clin. Neuropsychol. 2011;25:608–623. doi: 10.1080/13854046.2011.565076. - DOI - PubMed
    1. Girgis F, Pace J, Sweet J, Miller JP. Hippocampal neurophysiologic changes after mild traumatic brain injury and potential neuromodulation treatment approaches. Front. Syst. Neurosci. 2016;10:8. doi: 10.3389/fnsys.2016.00008. - DOI - PMC - PubMed
    1. Blennow K, et al. Traumatic brain injuries. Nat. Rev. Dis. Primers. 2016;2:16084. doi: 10.1038/nrdp.2016.84. - DOI - PubMed
    1. Shively S, Scher AI, Perl DP, Diaz-Arrastia R. Dementia resulting from traumatic brain injury: what is the pathology? Arch. Neurol. 2012;69:1245–1251. doi: 10.1001/archneurol.2011.3747. - DOI - PMC - PubMed
    1. Lipponen A, Paananen J, Puhakka N, Pitkänen A. Analysis of post-traumatic brain injury gene expression signature reveals tubulins, Nfe2l2, Nfkb, Cd44, and S100a4 as treatment targets. Sci. Rep. 2016;6:31570. doi: 10.1038/srep31570. - DOI - PMC - PubMed

Publication types