. 2018 Sep 25;9(1):3917.
doi: 10.1038/s41467-018-06130-3.

Microenvironmental niche divergence shapes BRCA1-dysregulated ovarian cancer morphological plasticity

Affiliations

Microenvironmental niche divergence shapes BRCA1-dysregulated ovarian cancer morphological plasticity

Andreas Heindl et al. Nat Commun. .

Abstract

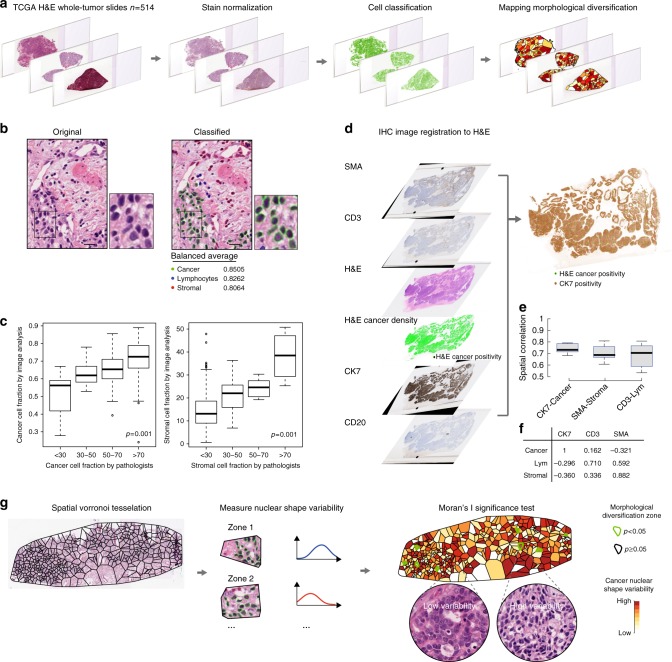
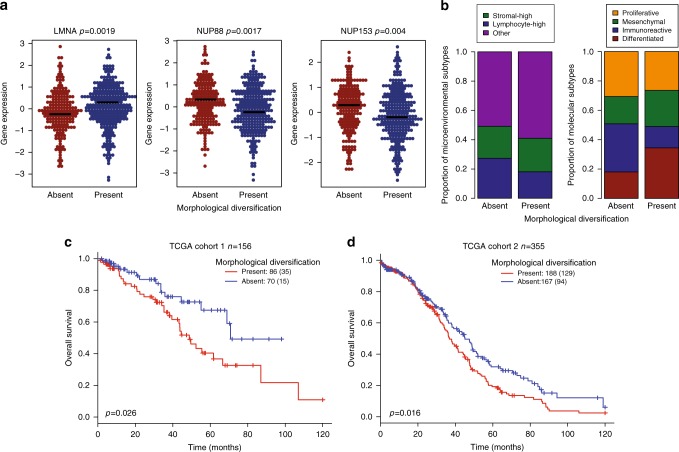
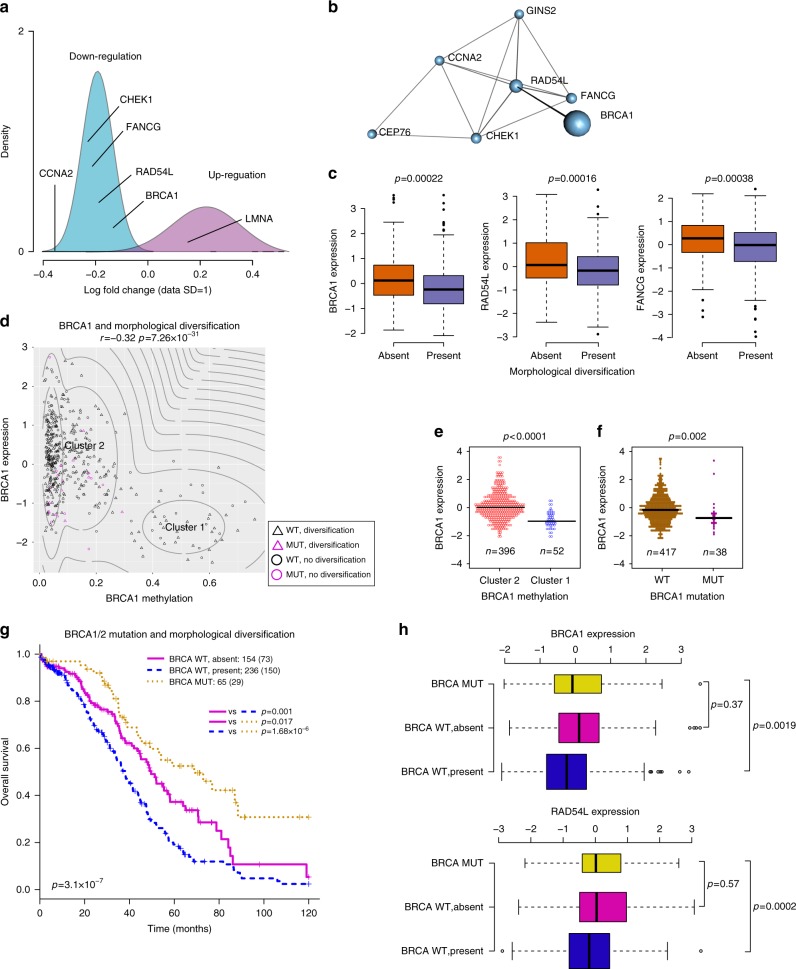
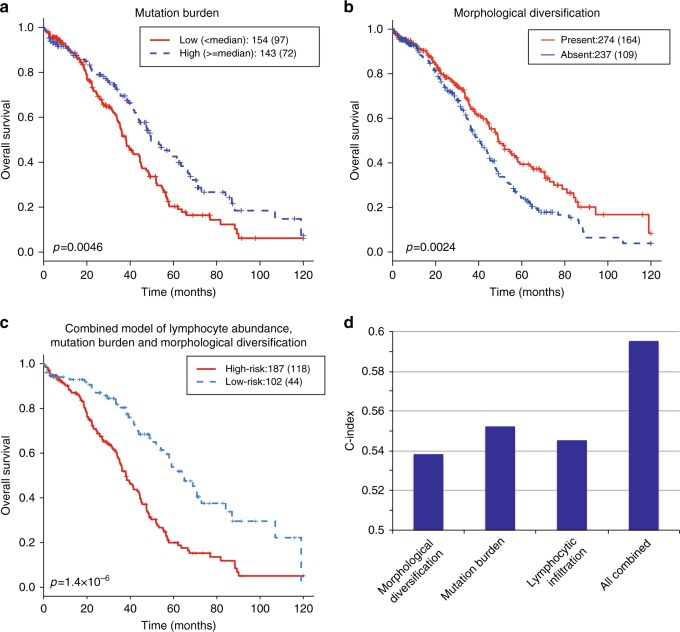
How tumor microenvironmental forces shape plasticity of cancer cell morphology is poorly understood. Here, we conduct automated histology image and spatial statistical analyses in 514 high grade serous ovarian samples to define cancer morphological diversification within the spatial context of the microenvironment. Tumor spatial zones, where cancer cell nuclei diversify in shape, are mapped in each tumor. Integration of this spatially explicit analysis with omics and clinical data reveals a relationship between morphological diversification and the dysregulation of DNA repair, loss of nuclear integrity, and increased disease mortality. Within the Immunoreactive subtype, spatial analysis further reveals significantly lower lymphocytic infiltration within diversified zones compared with other tumor zones, suggesting that even immune-hot tumors contain cells capable of immune escape. Our findings support a model whereby a subpopulation of morphologically plastic cancer cells with dysregulated DNA repair promotes ovarian cancer progression through positive selection by immune evasion.


Conflict of interest statement

The authors declare no competing interests.

Figures

Fig. 1
Fig. 1
Our computational pipeline for the identification of cancer nuclear morphological diversification zones. a H&E-stained whole-tumor section slides were digitized and stain normalized. Single cells were classified based on their morphology. Voronoi tessellation was employed to subdivide the tumors into polygons. Morphologically diversified zones were detected using local Moran’s I statistics. b An illustrative example of single-cell classification: cancer cells (green), stromal cells (red), and lymphocytes (blue). Nucleus boundaries were generated by automated image analysis. Accuracy was assessed using balanced average, which is the mean of sensitivity and specificity. Scale bar shows 20 μm. c Jonckheere trend test of automated versus pathologist’s cell abundance scoring of cancer cells and stromal cells as a second method for validation. Boxplot center line, bounds of box and whiskers represent here and henceforth median, inter-quartile range and extreme values (1.5 times inter-quartile range). d Our image registration pipeline for validating H&E image analysis using serial IHC sections. An example of overlaying H&E-based cancer identification result (green points showing cancer-positive regions) on CK7 was shown. e Boxplot to show the spatial correlation between CK7 and H&E-based estimate of cancer cells, CD3 and lymphocytes, and SMA and stromal cells in all IHC validation samples. f Spearman correlation of sample-level scores from H&E image analysis (Cancer%, Lymphocyte%, Stromal%) versus IHC CK7, CD3 and SMA scores. g An illustrative example of running local Moran’s I analysis: a tumor section was spatially divided using Voronoi tessellation; cancer cell nuclei in each zone analyzed with respect to shape variability; and the resulting heatmap of shape data superimposed with significance test results. Images are for illustrative purpose only and do not reflect actual size of the spatial zones. Heatmap colors represent shape variability of cancer cell morphology in the spatial zone. Spatial zones identified to be morphologically diverse were outlined in green
Fig. 2
Fig. 2
The biological and clinical relevance of morphological diversification. a Swarm plots for LMNA, NUP88, NUP153 expression in samples with and without diversification. b Barplots illustrating the fraction of microenvironmental subtypes (left) and molecular subtypes (right) stratified by diversification. c Kaplan-Meier curves to show the prognostic value of diversification in OS for TCGA cohort 1 and d cohort 2
Fig. 3
Fig. 3
Cancer morphological diversification and DNA repair. a Density plot showing the distribution of log-fold change in gene expression that significantly differed between diversified and non-diversified samples. Two clusters were identified using Gaussian mixture models, which represented down- and up- regulated gene clusters. b The gene module formed by highly co-expressed genes (cor > 0.38, p < 0.001) within the top 10 genes in the differential expression analysis. c Boxplots to illustrate the difference in BRCA1, RAD54L and FANCG expression in samples with and without diversification. d Scatterplot illustrating the distribution of BRCA1 expression according to BRCA1 methylation status with contours from unsupervised clustering identifying the BRCA1 epigenetically silenced group (Cluster 1). e Beeswarm plot to show the distribution of BRCA1 expression in the two clusters shown in d. f Beeswarm plot to show significantly lower expression of BRCA1 in a small number of samples with BRCA1 mutation (germline and somatic). g Kaplan-Meier curves depicting the differences in OS for patients stratified by BRCA1/2 mutation status (wildtype WT or mutated MUT) and morphological diversification. h Boxplots showing the differences in BRCA1 and RAD54L expression according to the three patient groups in G
Fig. 4
Fig. 4
Integrated model of mutation burden, lymphocyte abundance and morphological diversification. a Kaplan-Meier curves to show the difference in OS according to mutation burden. b Kaplan-Meier curves to show the difference in OS according to morphological diversification. c Kaplan-Meier curves for the combined model consisting of lymphocytic abundance, mutation burden and morphological diversification. High-risk group included the patients with low mutation burden and lymphocyte abundance, but when they were in disagreement (one high and the other low), morphological diversification was present. d Barplot showing the model concordance (C-index) for individual measures and combined
Fig. 5
Fig. 5
Subtype-specific analysis of morphological diversification identifies potential immune evasion in the Immunoreactive subtype. a Swarmplot to illustrate the difference in lymphocyte abundance according to morphological diversification within the Immunoreactive subtype. b Difference in immune composition according to diversification using CIBERSORT. Proportions of naïve B cells were small and therefore invisible. c Kaplan-Meier curves to illustrate the difference in OS and RFS according to diversification in Immunoreactive patients. d Kaplan-Meier curves to illustrate the difference in OS and RFS according to diversification in a validation set of 29 HGSOC with high lymphocytic infiltration. Color scheme follows c. e Violin plot showing a visually subtle spatial trend of decreased lymphocytic infiltration in diversified zones compared with their immediate neighborhood and the rest of the tumor. f Schematic drawing illustrating decreased lymphocytic infiltration in the diversification zone, despite an accumulation of lymphocytes in the immediate neighborhood. g Differences in Arm/Chrom SCNA, cytotoxic immune signature score, CTLA and PD1 expression, mutation burden, neoantigen burden, BRCA1 and galectin-3 gene expression in samples with/without diversification. h An illustrative example of spatial correlation analysis of galectin-3 expression and morphological diversification. Spatial tessellations from H&E morphological diversification analysis were superimposed onto a galectin-3 IHC image of a serial slide. Only zones containing galectin-3 positive cells were shown for illustrative purpose. Red points denote zones without diversification, and green points denote zones with diversification. Boxplot shows the difference in galectin-3 expression between all diversified and non-diversified zones across validation samples. i 3D spatial map to illustrate the spatial relationship between galectin-3 and CD3 + cells in a sample. j An illustrative example of galectin-3 expression at the cancer-lymphocyte interface. Scale bar shows 30μm

References

    1. Friedl P, Wolf K, Lammerding J. Nuclear mechanics during cell migration. Curr. Opin. Cell Biol. 2011;23:55–64. doi: 10.1016/j.ceb.2010.10.015. - DOI - PMC - PubMed
    1. Chow KH, Factor RE, Ullman KS. The nuclear envelope environment and its cancer connections. Nat. Rev. Cancer. 2012;12:196–209. doi: 10.1038/nrc3219. - DOI - PMC - PubMed
    1. Lombardi ML, et al. The interaction between nesprins and sun proteins at the nuclear envelope is critical for force transmission between the nucleus and cytoskeleton. J. Biol. Chem. 2011;286:26743–26753. doi: 10.1074/jbc.M111.233700. - DOI - PMC - PubMed
    1. Butcher DT, Alliston T, Weaver VM. A tense situation: forcing tumour progression. Nat. Rev. Cancer. 2009;9:108–122. doi: 10.1038/nrc2544. - DOI - PMC - PubMed
    1. Redwood AB, et al. A dual role for A-type lamins in DNA double-strand break repair. Cell Cycle. 2011;10:2549–2560. doi: 10.4161/cc.10.15.16531. - DOI - PMC - PubMed

Publication types