. 2018 Sep 25;9(1):3769.
doi: 10.1038/s41467-018-06118-z.

Microglial dopamine receptor elimination defines sex-specific nucleus accumbens development and social behavior in adolescent rats

Affiliations

Microglial dopamine receptor elimination defines sex-specific nucleus accumbens development and social behavior in adolescent rats

Ashley M Kopec et al. Nat Commun. .

Abstract

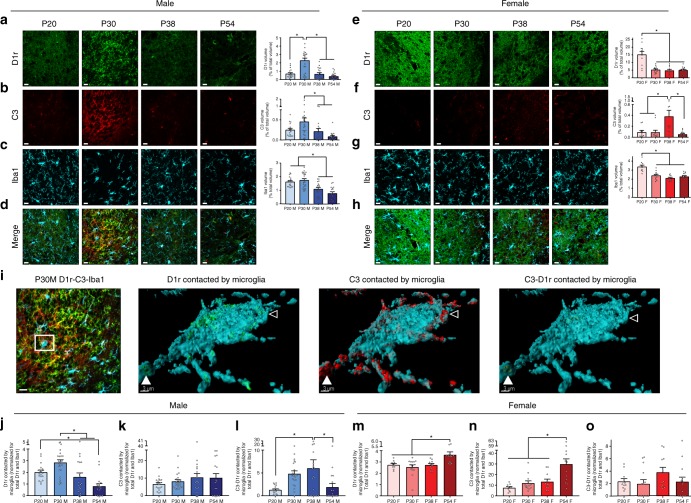
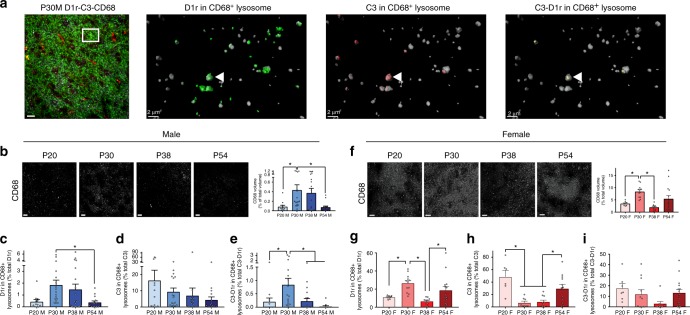
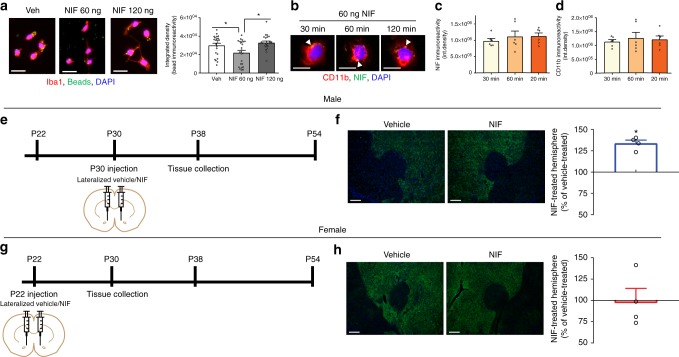
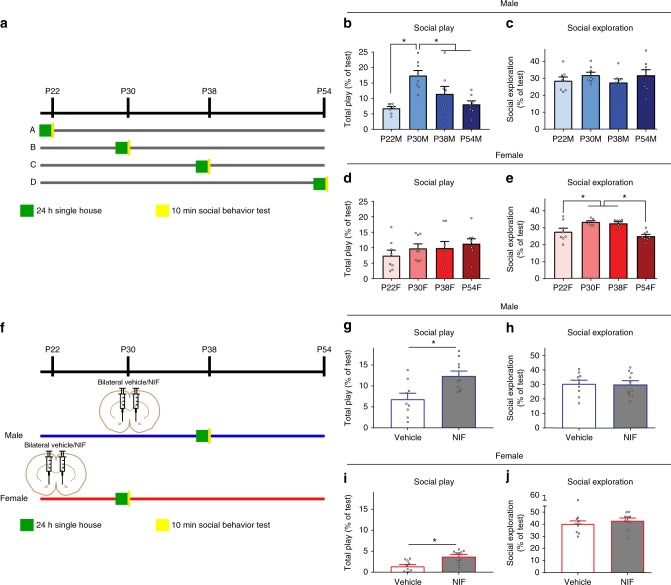
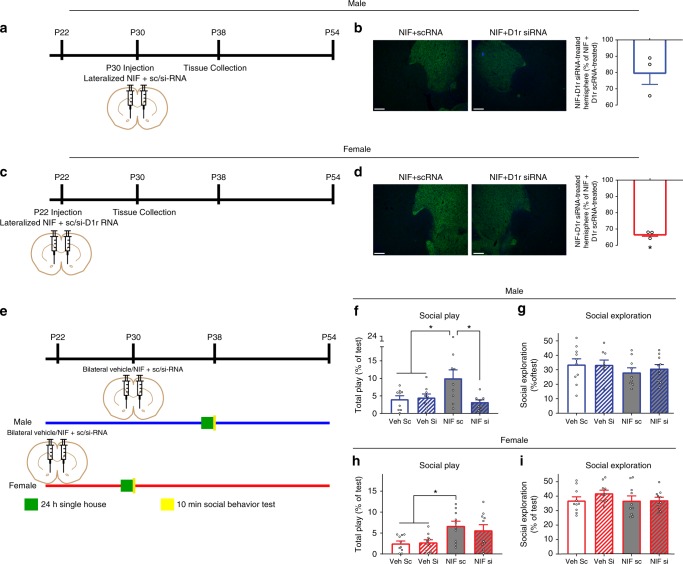
Adolescence is a developmental period in which the mesolimbic dopaminergic "reward" circuitry of the brain, including the nucleus accumbens (NAc), undergoes significant plasticity. Dopamine D1 receptors (D1rs) in the NAc are critical for social behavior, but how these receptors are regulated during adolescence is not well understood. In this report, we demonstrate that microglia and complement-mediated phagocytic activity shapes NAc development by eliminating D1rs in male, but not female rats, during adolescence. Moreover, immune-mediated elimination of D1rs is required for natural developmental changes in male social play behavior. These data demonstrate for the first time that microglia and complement-mediated immune signaling (i) participate in adolescent brain development in a sex-specific manner, and (ii) are causally implicated in developmental changes in behavior. These data have broad implications for understanding the adolescent critical period of development, the molecular mechanisms underlying social behavior, and sex differences in brain structure and function.


Conflict of interest statement

The authors declare no competing interests.

Figures

Fig. 1
Fig. 1
D1r downregulation in adolescence is associated with complement C3 and microglial engulfment in males, but not the females. Triple-label immunohistochemistry for D1r, C3, and Iba1 was performed and protein expression levels for each target were normalized for z-stack size. Because male and female tissue was processed at different times and required different image acquisition parameters, neither data nor images can be directly compared between the sexes. Representative images precede histograms; scale bars are equal to 20 µm. Males: a D1r levels transiently increased at P30 (Table 1A); b C3 levels decreased after P30 (Table 1B); c Iba1 levels decreased after P30 (Table 1C). d Merged male images. Females: e D1r levels decreased after P20 (Table 1D);f C3 levels transiently increased at P38 (Table 1E); g Iba1 levels decreased after P20 (Table 1F). h Merged female images. Images were then analyzed using a volumetric reconstruction of Iba1 (i.e., microglia) as a mask to determine the volume of D1r, C3, or colocalized C3-D1r physically associated with (either in contact with or inside) microglia. Masked volumes were normalized for total protein of the target and total Iba1 (see Methods). i Representative 2D triple-label immunohistochemistry (scale bar 20 µm), with enlarged 3D representation (scale bar 3 µm) of the selected area demonstrating (left-right) D1r, C3, and C3-D1r contacted by/internal to the microglia. Open arrow head indicates a region of the microglia where both D1r and C3 are located, but not colocalized, demonstrating the sensitivity of colocalization analyses. Closed arrow head indicates a region of the microglia where D1r and C3 colocalize (C3-D1r). Males: j D1rs are maximally contacted by microglia (irrespective of changing D1r and Iba1 levels) at P30 (Table 1G). k C3 contact by microglia does not change over time (Table 1H), and L C3-D1r contact is high between P30-P38 (Table 1I). Females: m D1rs are maximally contacted by microglia at P54, not at P20, prior to their elimination (Table 1J). n C3 contact is also increased at P54 (Table 1K), while o C3-D1r contact does not change over development (Table 1L)
Fig. 2
Fig. 2
D1r downregulation in adolescence is associated with complement C3 and microglial lysosomal degradation in the male, but not the female, NAc. To assess microglial phagocytic activity and whether D1r, C3, or C3-D1r were localized in microglial CD68+ lysosomes, immunohistochemistry for CD68, D1r, and C3 was performed. a Representative 2D triple-label immunohistochemistry (scale bar 20 µm), with enlarged 3D representation (scale bar 2 µm) of the selected area demonstrating (left-right) D1r, C3, and C3-D1r within CD68+ lysosomes. Closed arrow head indicates a lysosome where D1r and C3 colocalize (C3-D1r). Males: c CD68 levels are high from P30 to 38 (Table 2A). b D1r content in CD68+ lysosomes is highest at P30 (Table 2B), d C3 content in lysosomes does not change over development (Table 2C), and e C3-D1r content in lysosomes is transiently elevated at P30 (Table 2D). Females: f CD68 levels are transiently elevated at P30 (Table 2E). g D1r content in CD68+ lysosomes is high at both P30 and P54 (Table 2F), h C3 content in lysosomes is highest at P20 and P54 (Table 2G), and i C3-D1r content in lysosomes does not change over development (Table 2H). For all experiments, n = 4 animals/sex/group. Data were analyzed with one-way ANOVAs and Holm-Sidak’s post-hoc comparisons. Histograms portray the mean ± SEM with individual data points overlaid. Significant post-hoc Holm-Sidak t-tests (p < 0.05) comparisons are delineated with an asterisk. All statistics are in Table 2
Fig. 3
Fig. 3
C3–C3R interactions mediate developmentally-typical D1r elimination in vivo in males, but not females. Neutrophil inhibitor factor (NIF), a peptide that binds specifically to the CD11b subunit of C3 receptors (C3Rs), was assessed for its efficacy in reducing microglial phagocytic activity ex vivo. a In microglia isolated from whole brain, 60 ng, but not 120 ng NIF inhibited microglial phagocytosis of fluorescent beads (Table 3A). Representative images precede histograms; scale bar equals 20 µm. n = 4, with 2 replications/condition. b Microglia were isolated from whole brain and incubated with 60 ng NIF, and then immunocytochemically assessed for NIF and CD11b at 30, 60, and 120 min. Closed arrow heads indicate NIF (green) immunoreactivity. Scale bar equals 10 µm. There was no change in c NIF or (Table 3B) d CD11b (Table 3C) immunoreactivity over 2 h, suggesting that NIF was not causing the degradation of its receptor. n = 3; 2 replications/condition. To determine if developmental D1r downregulation requires C3–C3R interactions, NIF or Vehicle was microinjected in the NAc at e P30 in males and g P22 in females (both represent sex-specific ages prior to D1r downregulation), and then tissue was assessed at P38 and P30, respectively, an age at which D1rs should be developmentally downregulated. f In males, NIF-treated hemispheres exhibited significantly more (~25%) D1r immunoreactivity than within-animal vehicle-treated hemispheres (Table 3D). h In females, NIF-treated hemispheres exhibited the same D1r immunoreactivity as within-animal vehicle-treated hemispheres (Table 3E). Representative images precede histograms; scale bars equal 100 µm. n = 4/sex with counterbalanced injections. For ex vivo experiments, data were analyzed with one-way ANOVAs and Holm-Sidak’s post-hoc comparisons. For in vivo experiments, D1r data from 4–7 different sections per animal were averaged and then calculated as a percentage of within-animal vehicle control levels. Data were analyzed with 2-tailed one-sample t-tests. Histograms portray the mean ± SEM with individual data points overlaid. Significant post-hoc Holm-Sidak t-tests (ad) and one-sample t-tests from 100 (f, h) (p < 0.05) comparisons are delineated with an asterisk. All statistics are in Table 3
Fig. 4
Fig. 4
Sex-specific social behavior patterns over adolescence require C3–C3R interactions. a Experimental design: separate cohorts of experimental animals (n = 8/sex/age) were single-housed for 24 h prior to test, after which time a novel age-matched and sex-matched conspecific was introduced into their home cage. Ten minutes of interactions were recorded, and later an experimenter blinded to the conditions coded the interactions for either total play or social exploration (i.e., non-play social behavior). Only behaviors initiated by the experimental animal were considered. Males: b Male social play behavior transiently increased at P30 (Table 4A), c with no changes in social exploration over development (Table 4B). Females: d Female social play behavior did not change over development (Table 4C), e while social exploration peaked from P30 to 38 (Table 4D). f To determine if C3–C3R interactions regulating D1r levels between P30 and 38 in males is required for the decline in social play behavior observed at this time, NIF or vehicle was injected bilaterally in P30 males or P22 females (n = 10/sex/treatment). Animals were then single housed for 24 h at P37 or P29, and assessed for social behavior as described at P38 and P30, respectively. Males: g Interrupting C3–C3R interactions at P30 increased social play behavior at P38 (Table 4E), h without affecting social exploration (Table 4F). Females: i Female social play behavior, while at a low basal level, also modestly increased at P30 after P22 NIF injection (Table 4G), j with no changes in social exploration (Table 4H). Data were analyzed either with one-way ANOVAs and Holm-Sidak’s post-hoc comparisons or with two-tailed unpaired t-tests. Histograms portray the mean ± SEM with individual data points overlaid. Significant post-hoc Holm-Sidak t-tests (be) and unpaired t-tests (gj) (p < 0.05) comparisons are delineated with an asterisk. All statistics are in Table 4
Fig. 5
Fig. 5
C3–C3R regulation of D1rs regulates male, but not female, social play behavior. To determine if disrupting C3–C3R interactions via NIF increases play in a D1r-dependent manner, we utilized siRNA against rat D1r (200 µM) or scRNA controls. a P30 males were co-injected with NIF + D1r siRNA in one hemisphere and NIF + scRNA in the contralateral hemisphere, and then D1r immunoreactivity was assessed at P38. b In the presence of NIF, D1r siRNA was capable of decreasing D1r levels relative to NIF + scRNA within-animal control hemispheres (~20%; Table 5A). c P22 females were injected with NIF + D1r siRNA in one hemisphere and NIF + scRNA in the contralateral hemisphere, and then D1r immunoreactivity was assessed at P30. d In the presence of NIF, D1r siRNA was capable of decreasing D1r levels relative to NIF + scRNA within-animal control hemispheres (~30%; Table 5B). Representative images precede histograms; scale bar equals 100 µm. n = 3/sex. e Experimental design: P30 males and P22 females were bilaterally microinjected into the NAc with either Vehicle + scRNA (Veh sc), Vehicle + D1r siRNA (Veh si), NIF + scRNA (NIF sc), or NIF + D1r siRNA (NIF si). At P37 and P22, animals were single-housed for 24 h, and then a novel age- and sex-matched conspecific was introduced into their home cage for 10 min social behavior tests (n = 9–10/sex/treatment). Males: f NIF + scRNA increased social play behavior in males, which was eliminated by D1r siRNA (NIF si; Table 5C). g No treatment changed social exploration behavior (Table 5D). Females: h NIF + scRNA increased social play behavior in females, which was not affected by D1r siRNA (NIF si; Table 5E). i No treatment changed social exploration behavior (Table 5F). Immunohistochemical data were calculated as in Fig. 2 and analyzed with two-tailed one-sample t-tests. Behavioral data were analyzed with one-way ANOVAs and Holm-Sidak’s post-hoc comparisons. Histograms portray the mean ± SEM with individual data points overlaid. Significant one-sample t-tests from 100 (b, d) and post-hoc Holm-Sidak t-tests (fi) (p < 0.05) comparisons are delineated with an asterisk. All statistics are in Table 5

Similar articles

Cited by

References

    1. Spear LP. The adolescent brain and age-related behavioral manifestations. Neurosci. Biobehav. Rev. 2000;24:417–463. doi: 10.1016/S0149-7634(00)00014-2. - DOI - PubMed
    1. Blakemore SJ. The social brain in adolescence. Nat. Rev. Neurosci. 2008;9:267–277. doi: 10.1038/nrn2353. - DOI - PubMed
    1. Fuhrmann D, Knoll LJ, Blakemore SJ. Adolescence as a sensitive period of brain development. Trends Cogn. Sci. 2015;19:558–566. doi: 10.1016/j.tics.2015.07.008. - DOI - PubMed
    1. Trezza V, Campolongo P, Vanderschuren LJ. Evaluating the rewarding nature of social interactions in laboratory animals. Dev. Cogn. Neurosci. 2011;1:444–458. doi: 10.1016/j.dcn.2011.05.007. - DOI - PMC - PubMed
    1. El Rawas R, Saria A. The two faces of social interaction reward in animal models of drug dependence. Neurochem. Res. 2016;41:492–499. doi: 10.1007/s11064-015-1637-7. - DOI - PMC - PubMed

Publication types

MeSH terms