. 2018 Sep 25;9(1):3895.
doi: 10.1038/s41467-018-06389-6.

Functional modulation of primary visual cortex by the superior colliculus in the mouse

Affiliations

Functional modulation of primary visual cortex by the superior colliculus in the mouse

Mehran Ahmadlou et al. Nat Commun. .

Abstract

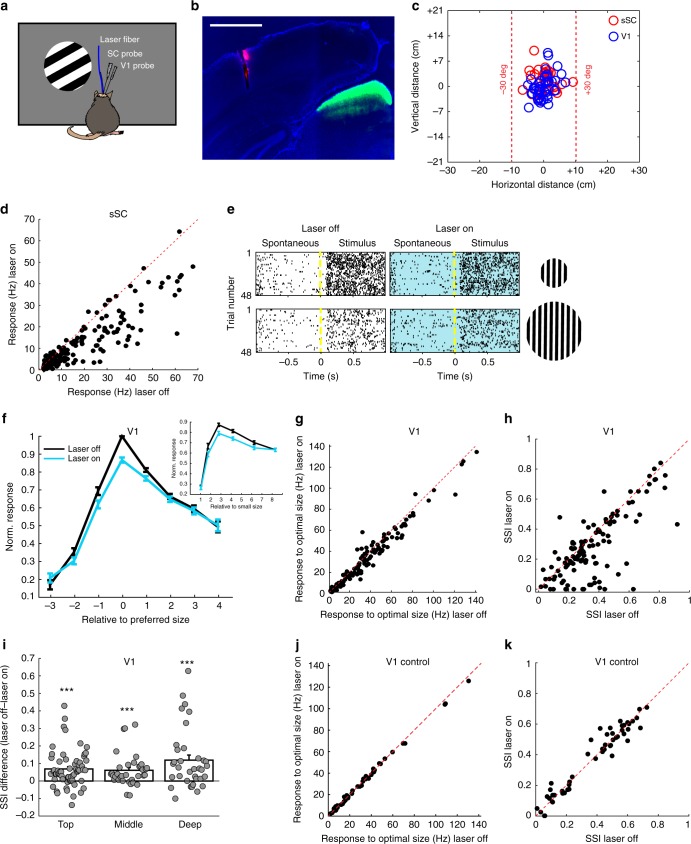
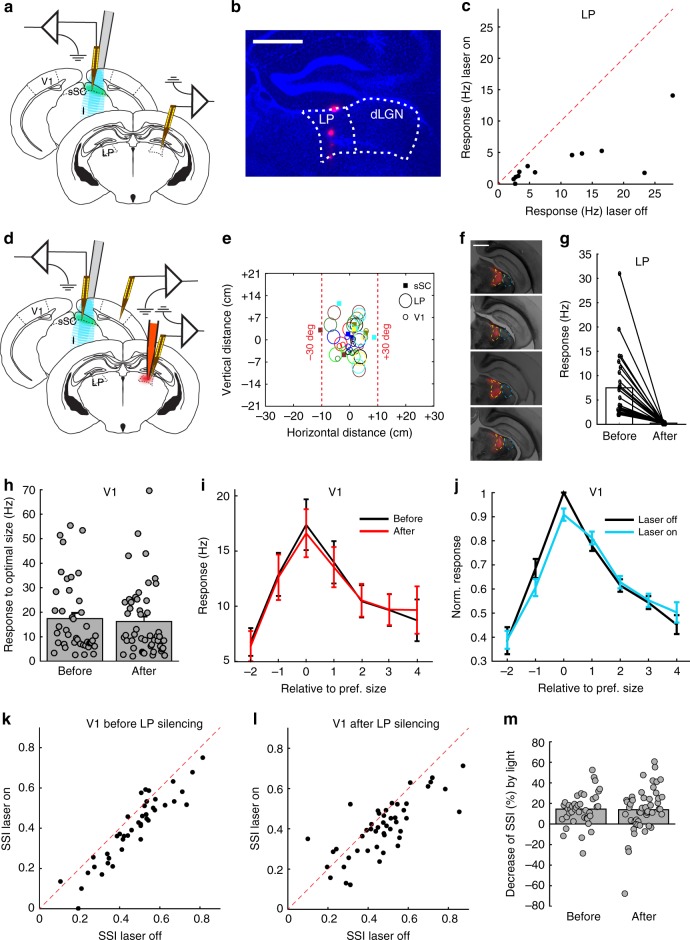
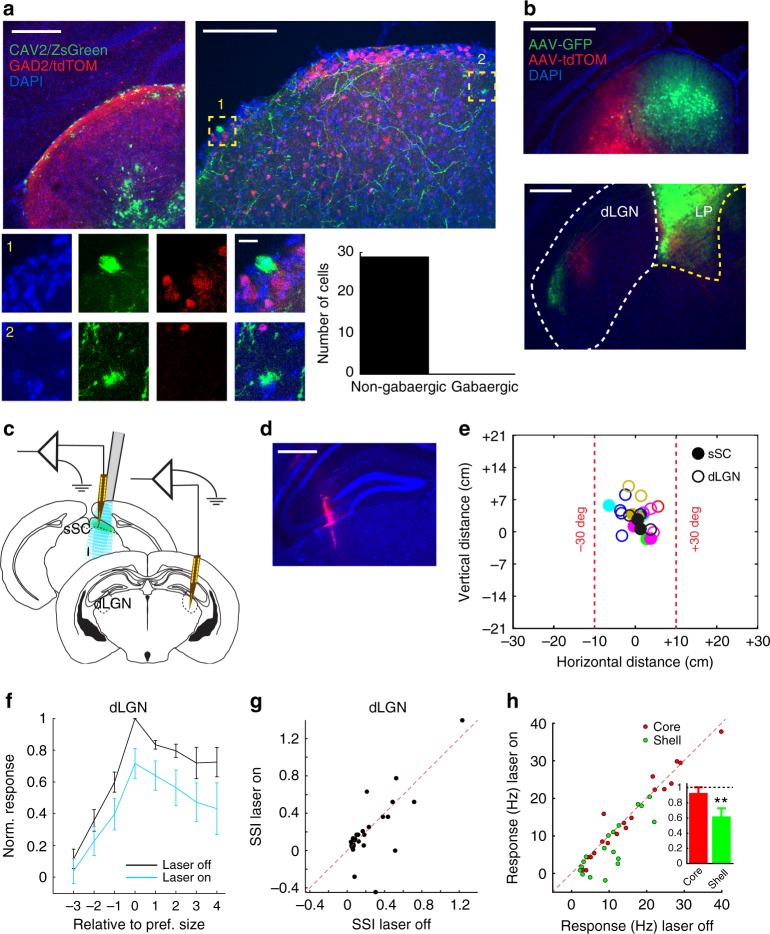
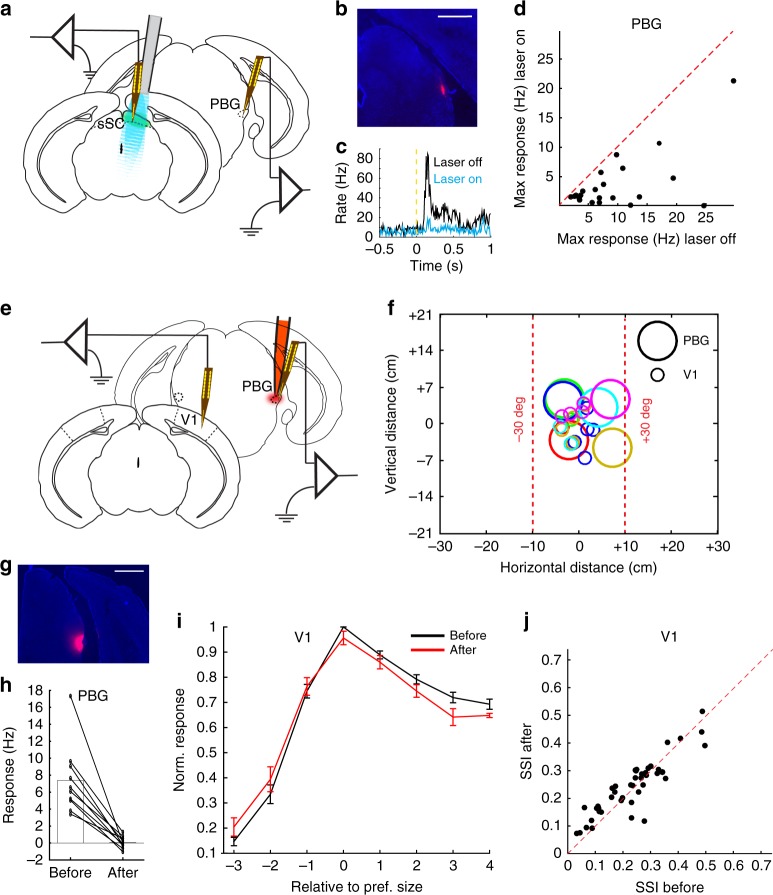
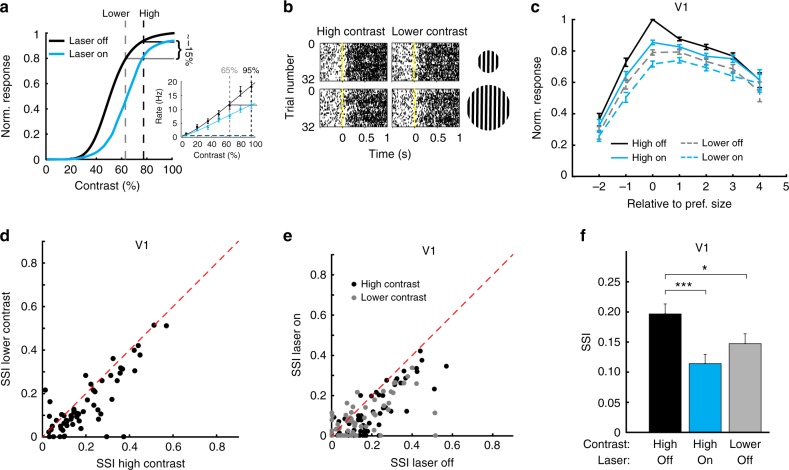
The largest targets of retinal input in mammals are the dorsal lateral geniculate nucleus (dLGN), a relay to the primary visual cortex (V1), and the superior colliculus. V1 innervates and influences the superior colliculus. Here, we find that, in turn, superior colliculus modulates responses in mouse V1. Optogenetically inhibiting the superior colliculus reduces responses in V1 to optimally sized stimuli. Superior colliculus could influence V1 via its strong projection to the lateral posterior nucleus (LP/Pulvinar) or its weaker projection to the dLGN. Inhibiting superior colliculus strongly reduces activity in LP. Pharmacologically silencing LP itself, however, does not remove collicular modulation of V1. The modulation is instead due to a collicular gain modulation of the dLGN. Surround suppression operating in V1 explains the different effects for differently sized stimuli. Computations of visual saliency in the superior colliculus can thus influence tuning in the visual cortex via a tectogeniculate pathway.


Conflict of interest statement

The authors declare no competing interests.

Figures

Fig. 1
Fig. 1
Optogenetically inhibiting the sSC reduces surround suppression in V1. a Laminar recording electrodes in the sSC and V1 of an anesthetized Gad2-Cre mouse, expressing channelrhodopsin-2 in the sSC, with a laser-coupled fiber placed above the sSC. Screen was positioned 17.5 cm in front of the mouse. b Coronal slice showing ChR2-eYFP expression (green) in the sSC and the DiI (red) trace of the V1 recording electrode. DAPI in blue. Scale bar is 1 mm. c Distribution of recorded receptive field locations of 38 sSC and 45 V1 units (14 mice). Receptive field sizes are not indicated. d Responses to full screen gratings in the sSC were reduced by optogenetic activation of the Gad2-cells (p < 0.00001, Wilcoxon test, 14 mice, 182 units). e Spike rastergrams from an example V1 unit for optimal size and large size gratings, without and with (blue background) optogenetic inhibition of the sSC. Each line in the rastergram represents one trial. f Population average size tuning in V1 without and with optogenetic inhibition of sSC. Horizontal axis shows size step relatively to the optimal size per unit. Inset shows size step relative to the smallest size presented within a recording. Error bars represent s.e.m. g Responses to optimal size grating in V1, without and with laser light on sSC (p = 4.7 × 10-14, Wilcoxon test; 14 mice, 160 units). h Surround suppression index in V1 was reduced by optogenetically inhibiting the sSC (p < 0.00001, Wilcoxon test). i Surround suppression in V1 was reduced in all depths by optogenetically inhibiting the sSC (p < 0.001, Wilcoxon tests). There is no significant difference in change between depths (p > 0.25, Mann–Whitney U-tests). Top, middle, deep correspond to the top, middle, and bottom third of the visually responsive channels on the electrode spanning V1; ***p < 0.001. j Responses to optimal size grating in V1 in wild-type control mice was not changed by laser light on sSC (p = 0.33, Wilcoxon test; 5 mice, 52 units). k Surround suppression in V1 was not changed by laser light in wild-type control mice (p = 0.76, Wilcoxon test)
Fig. 2
Fig. 2
Effect of sSC on V1 surround suppression is not mediated by LP. a Laminar recording electrodes in LP and the sSC of anesthetized Gad2-cre mouse, expressing channelrhodopsin-2 in the sSC, with a laser-coupled fiber placed above the sSC. Screen was positioned in front of the mouse. b Coronal slice showing a DiI trace of the recording electrode in LP. DAPI in blue. Scale bar is 0.5 mm. c Optogenetic inhibition of sSC strongly reduced visual responses to full screen gratings in LP (p = 0.0005, Wilcoxon test, 4 mice, 12 units). d Laminar recording electrodes in V1 and the sSC, and in LP before and after injection of fluorescent muscimol in LP. e Receptive field centers of recorded units in sSC, LP and V1 in this set of experiments. Shapes indicate brain areas. Colors represent the different experiments. Receptive field sizes are not indicated. f Example of one fluorescence-conjugated muscimol injection shown in a few coronal slices. LP outline is indicated by yellow dashed line. g Muscimol effectively silenced LP (5 mice, 26 units). h Response to optimal size in V1 was not reduced by LP silencing (p = 0.70, Wilcoxon test; 5 mice, 42 units before, 49 different units after). Bars represent mean. i Size tuning in V1 was unchanged by LP silencing. Error bars represent mean ± s.e.m. j Optogenetic suppression of sSC by laser continues to suppress optimal sized stimuli after LP silencing. k V1 SSI was reduced by optogenetic inhibition of sSC, before LP silencing (p = 9.3 × 10-9, paired t-test; 5 mice, 42 units). l V1 SSI was reduced by optogenetic inhibition of sSC, also after LP silencing (p = 3.4 × 10-5, paired t-test; 5 mice, 49 units). m No difference in the amount of SSI reduction by optogenetic inhibition of the sSC, before and after LP silencing (p = 0.92, Mann–Whitney U-test). Bars represent mean
Fig. 3
Fig. 3
The sSC increases dLGN gain via excitatory projection. a Top left, coronal slice of dLGN of a Gad2 x Ai14 tdTomato reporter mouse transfected with a retrograde CAV2 virus with a ZsGreen expressing vector. Scale bar is 205 µm. Top right, coronal slice of sSC in the same experiment showing retrogradely labeled neurons (green) and inhibitory neurons (red). Scale bar is 100 µm. Bottom left, 1 and 2 show magnifications of labeled cells indicated at top right. Scale bar is 10 µm. Bottom right, all 28 labeled cells were Gad2-Cre negative. b Top, coronal slice of SC injected medially with AAV expressing GFP and more laterally with AAV expressing tdTomato. Scale bar is 500 µm. Bottom, coronal slice from the same experiment showing sSC innervation of the dLGN. Dashed lines show outline of dLGN (left) and LP (right). Scale bar is 250 µm. c Laminar recording electrodes in the dLGN and sSC of anesthetized Gad2-Cre mouse, expressing channelrhodopsin-2 in the sSC, with a laser-coupled fiber placed above the sSC. d Example trace of DiI (red) left in the dLGN by recording electrode. DAPI in blue. Scale bar is 500 µm. e Distribution of receptive field centers for this set of experiments. Colors indicate the different experiments. Receptive field sizes are not indicated. f Optogenetic inhibition of sSC reduced visual responses in the dLGN (optogenetic effect p = 7.0 × 10-6, interaction of optogenetics and size p = 0.95, two-way ANOVA, 6 mice, 26 units). Size is the rank of the stimulus size in a recording, counted from the preferred stimulus in that recording. Error bars indicate s.e.m. g Surround suppression in dLGN was unchanged by optogenetic inhibition of sSC (p = 0.95, Wilcoxon test, 6 mice, 26 units). h Optogenetic inhibition reduced responses to the largest size gratings in the dorsal (shell) part of the dLGN (p = 0.004, paired t-test, 6 mice, 18 units) and not the ventral (core) part (p = 0.59, paired t-test, 6 mice, 19 units). Inset shows mean and s.e.m. of the response when the laser was on, relative to when it was off
Fig. 4
Fig. 4
Effect of sSC on V1 is not mediated by PBG. a Laminar recording electrode in the PBG of anesthetized Gad2-cre mouse, expressing channelrhodopsin-2 in the sSC, with a laser-coupled fiber placed above the sSC. b Coronal slice showing trace of DiI (red) from the recording electrode in PBG. DAPI in blue. Scale bar is 0.5 mm. c Example peristimulus time spike histogram in the PBG, without and with optogenetic inhibition of the sSC. d Maximum response to full screen gratings in PBG was reduced by optogenetic inhibition of the sSC (p = 4 × 10-5, Wilcoxon test, 4 mice, 22 units). e Laminar recording electrodes in V1 and the PBG, before and after injection of fluorescent muscimol in the PBG, in the anesthetized mouse. f Receptive field centers of recorded units in V1 and the PBG for this set of experiments. Colors represent the different experiments. Receptive field sizes are not indicated. g Coronal slice showing fluorescent muscimol in the PBG. DAPI in blue. Scale bar is 0.5 mm. h Muscimol silenced the PBG (p = 0.002, Wilcoxon test; 4 mice, 10 units). i Visual responses in V1 were not changed by PBG silencing (p = 0.57, two-way ANOVA; 4 mice, 43 units). Size is the rank of the stimulus size in a recording, counted from the preferred stimulus in that recording. Error bars represent mean ± s.e.m. j Surround suppression in V1 was not changed by PBG silencing (p = 0.27, paired t-test; 4 mice, 43 units)
Fig. 5
Fig. 5
Lowering contrast reduces V1 surround suppression like optogenetically inhibiting sSC. a Contrast tuning in V1 was measured for an optimal size stimulus, without (black) and with (blue) optical inhibition of the sSC. The highest contrast at which the population response showed a reduction of approximately 15% was set as high contrast level. The contrast level at which the population gave a roughly equal response when the sSC is not inhibited was set as lower contrast level. Inset, example contrast tuning curve for one V1 unit. b Example rastergram of V1 neuron for gratings shown at two sizes at high (90%) and lower (70%) contrast. Different lines show different trials with different drifting directions. Stimulus started at time 0. c Population average size tuning curves for lower contrast resembled the size tuning curve at high contrast with optogenetic inhibition of the sSC. All responses were normalized to the response of the preferred stimulus at high contrast, without optogenetic inhibition of the sSC. Error bars indicate s.e.m. d Surround suppression was lower at lower contrast (p = 3.4 × 10-7, Wilcoxon test; 5 mice, 63 units). e Optogenetic inhibition of the sSC reduced V1 surround suppression for high and lower contrasts. f Surround suppression for high contrast without and with optogenetic inhibition of sSC and for lower contrast without optogenetic inhibition of the sSC (change by inactivating sSC, p = 0.00019; change by lowering contrast p = 0.041; difference between inactivated sSC condition and lower contrast: p = 0.19, all Bonferroni-corrected Mann–Whitney U-tests). Bars indicate mean and s.e.m.; *p < 0.05, ***p < 0.001

Similar articles

Cited by

References

    1. Ellis EM, Gauvain G, Sivyer B, Murphy GJ. Shared and distinct retinal input to the mouse superior colliculus and dorsal lateral geniculate nucleus. J. Neurophysiol. 2016;116:602–610. doi: 10.1152/jn.00227.2016. - DOI - PMC - PubMed
    1. Wang L, Sarnaik R, Rangarajan K, Liu X, Cang J. Visual receptive field properties of neurons in the superficial superior colliculus of the mouse. J. Neurosci. 2010;30:16573–16584. doi: 10.1523/JNEUROSCI.3305-10.2010. - DOI - PMC - PubMed
    1. Feinberg EH, Meister M. Orientation columns in the mouse superior colliculus. Nature. 2015;519:229–232. doi: 10.1038/nature14103. - DOI - PubMed
    1. Ahmadlou M, Heimel JA. Preference for concentric orientations in the mouse superior colliculus. Nat. Commun. 2015;6:6773. doi: 10.1038/ncomms7773. - DOI - PMC - PubMed
    1. Shi X, et al. Retinal origin of direction selectivity in the superior colliculus. Nat. Neurosci. 2017;20:550–558. doi: 10.1038/nn.4498. - DOI - PMC - PubMed

Publication types