. 2018 Sep 25;9(1):3915.
doi: 10.1038/s41467-018-06380-1.

Lnk/Sh2b3 deficiency restores hematopoietic stem cell function and genome integrity in Fancd2 deficient Fanconi anemia

Affiliations

Lnk/Sh2b3 deficiency restores hematopoietic stem cell function and genome integrity in Fancd2 deficient Fanconi anemia

Joanna Balcerek et al. Nat Commun. .

Abstract

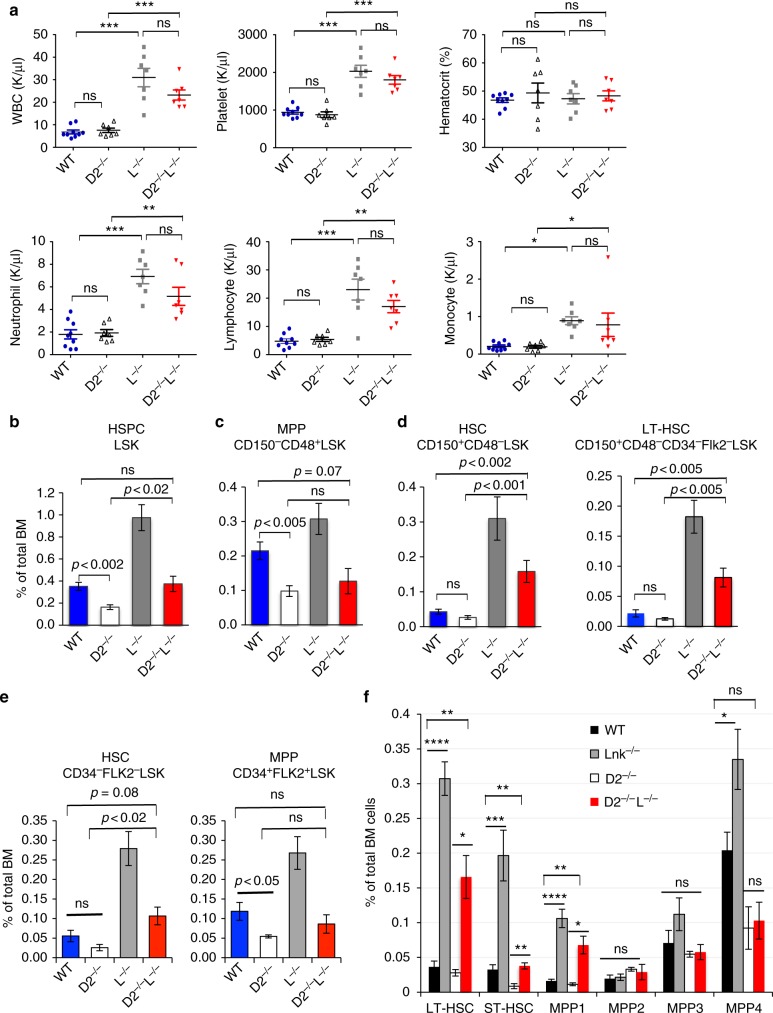
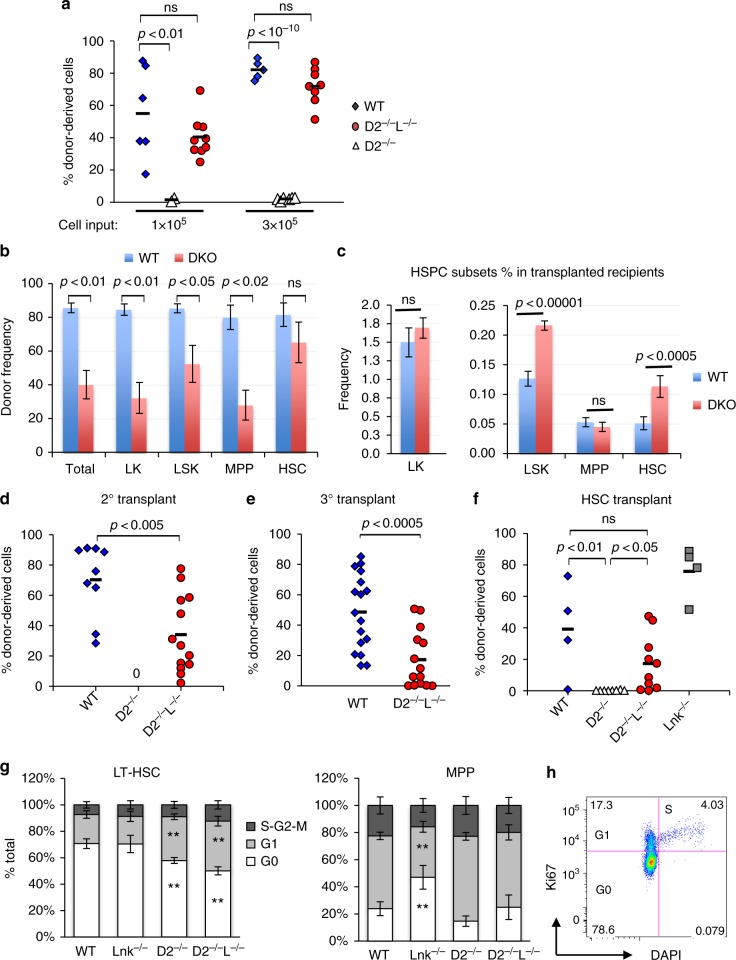
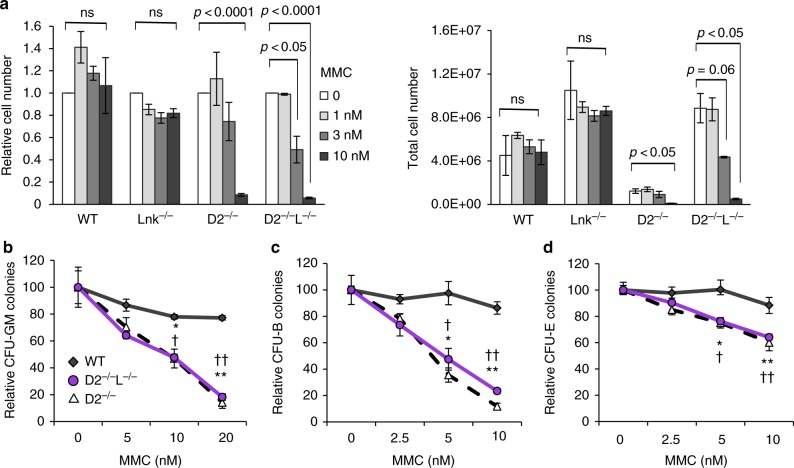
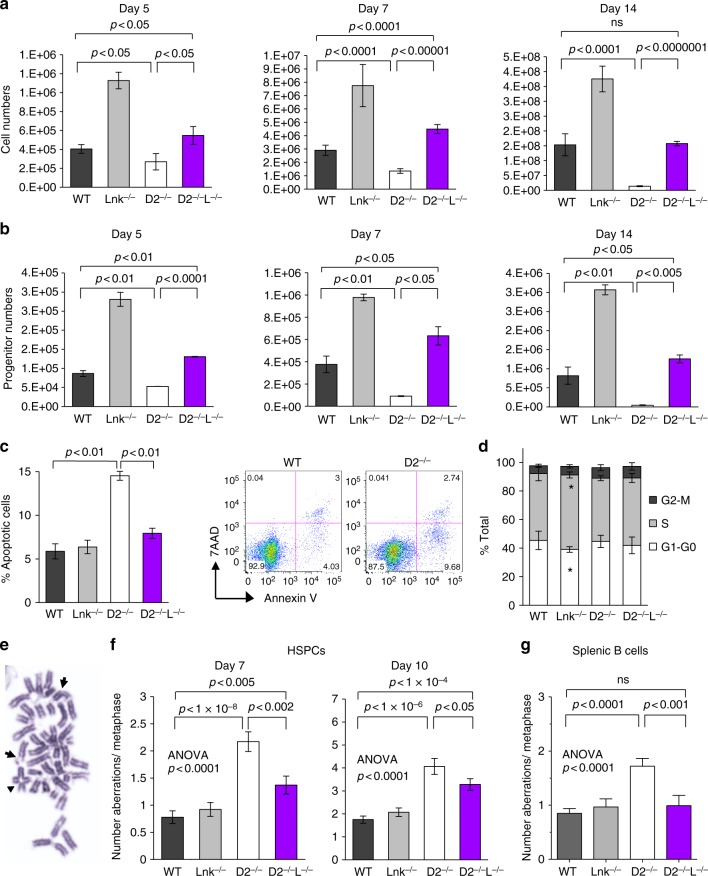
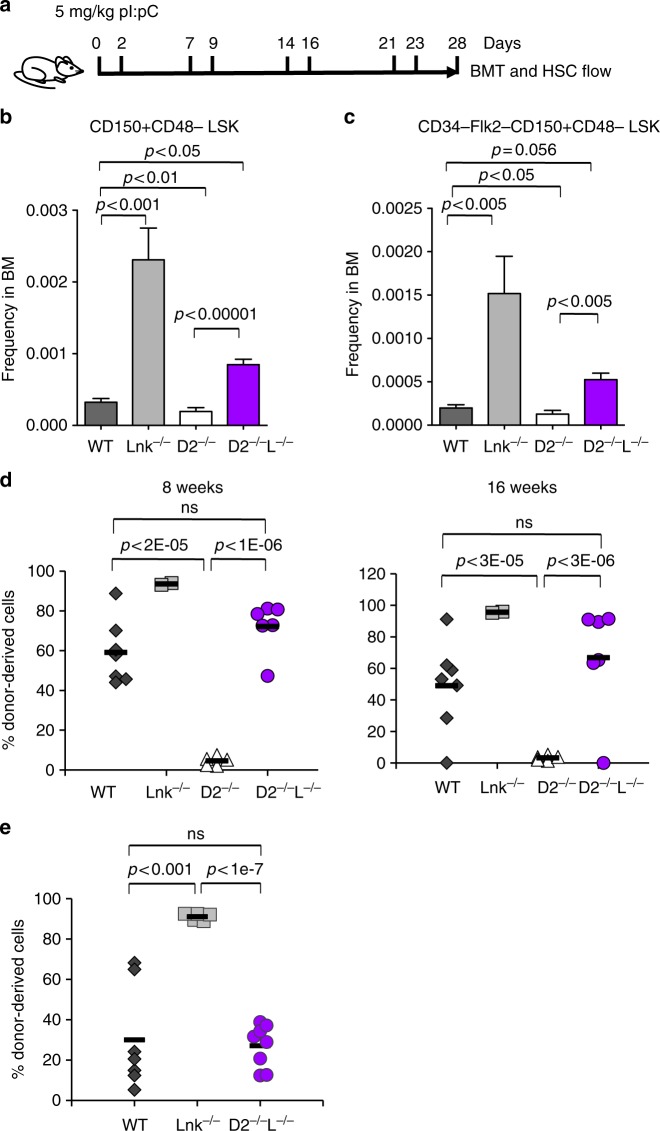
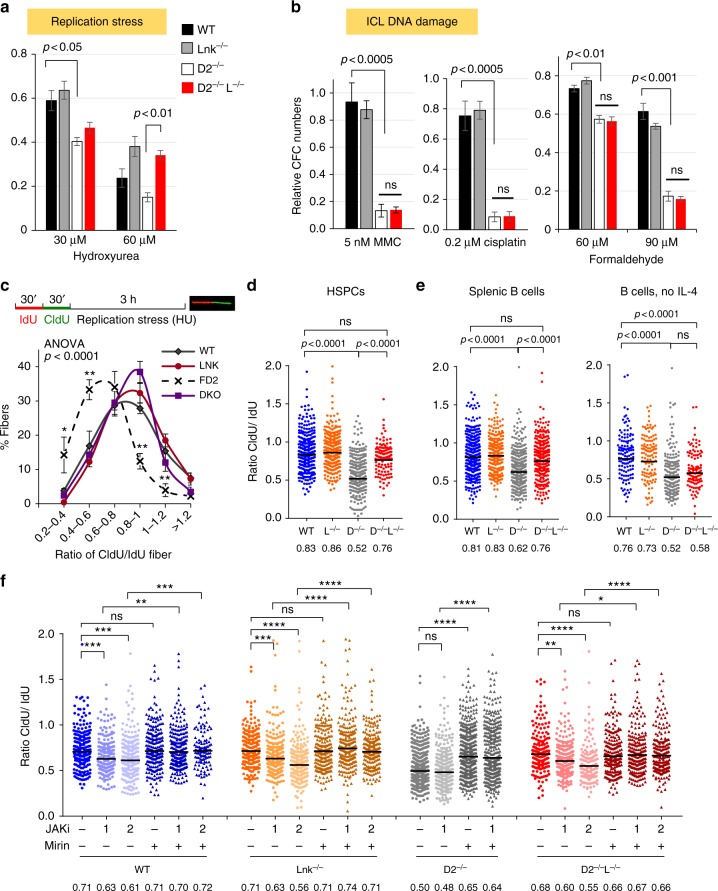
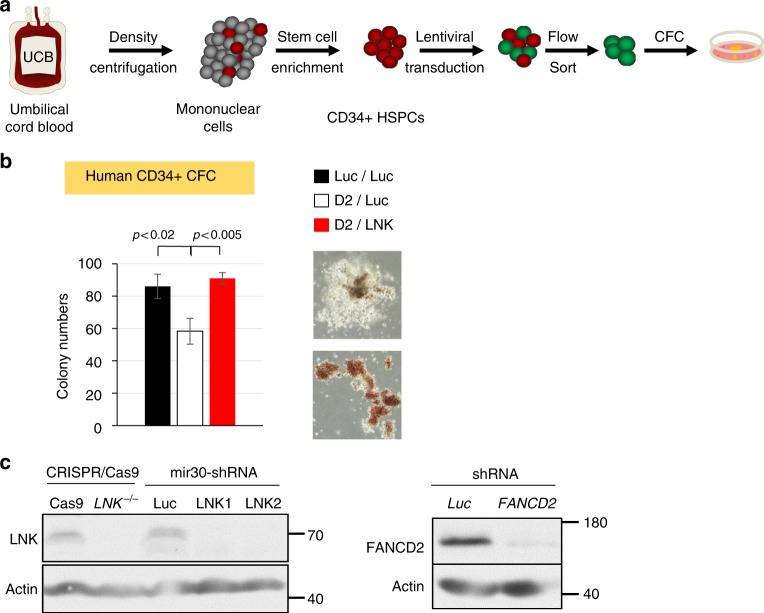
Fanconi anemia (FA) is a bone marrow failure (BMF) syndrome that arises from mutations in a network of FA genes essential for DNA interstrand crosslink (ICL) repair and replication stress tolerance. While allogeneic stem cell transplantation can replace defective HSCs, interventions to mitigate HSC defects in FA do not exist. Remarkably, we reveal here that Lnk (Sh2b3) deficiency restores HSC function in Fancd2-/- mice. Lnk deficiency does not impact ICL repair, but instead stabilizes stalled replication forks in a manner, in part, dependent upon alleviating blocks to cytokine-mediated JAK2 signaling. Lnk deficiency restores proliferation and survival of Fancd2-/- HSCs, while reducing replication stress and genomic instability. Furthermore, deletion of LNK in human FA-like HSCs promotes clonogenic growth. These findings highlight a new role for cytokine/JAK signaling in promoting replication fork stability, illuminate replication stress as a major underlying origin of BMF in FA, and have strong therapeutic implications.


Conflict of interest statement

The authors declare no competing interests.

Figures

Fig. 1
Fig. 1
Lnk deficiency fully restores phenotypic HSCs in Fancd2−/− mice. a CBC analysis of peripheral blood from WT, Fancd2−/− (D2−/−), Lnk−/− (L−/−) and FancD2−/−;Lnk−/− (D2−/−L−/−) mice. WBC: white blood cell. Each symbol represents an individual mouse; horizontal lines indicate mean frequencies; error bars indicate SE. bd Quantification of various HSPC compartments by flow cytometry using SLAM marker scheme, Lin-Kit + Sca1 + (LSK) HSPC population (b), MPP (CD48 + CD150-LSK) (c), HSC (CD48-CD150 + LSK), and LT-HSC (CD48-CD150 + Flk2-CD34-LSK) (d). e Quantification of various HSPC subsets using the CD34 and Flk2 surface marker scheme, HSCs (CD34-Flk2-LSK) and MPP (CD34 + Flk2 + LSK). f Quantification of various HSC and MPP subsets using indicated markers. LT-HSC: CD150 + CD48-Flk2-LSK; ST-HSC: CD150-CD48-Flk2-LSK; MPP1: CD150 + CD48-Flk2-CD34 + LSK; MPP2: CD150 + CD48 + Flk2-LSK; MPP3: CD150-CD48 + Flk2-LSK; MPP4: Flk2 + LSK. P values determined by two-tailed Student’s t-test are shown, *p < 0.05, **p < 0.01, ***p < 0.001, ns not significant. Data are pooled from 3–5 independent experiments
Fig. 2
Fig. 2
Lnk deficiency restores functional HSCs in Fancd2−/− mice. ae show serial transplantation of total bone marrow cells from WT, D2−/− and D2−/−L−/− mice. A graded number of BM cells were mixed with competitors and transplanted into lethally irradiated host animals. a Donor chimerisms in the peripheral blood of the recipient mice 16 weeks after transplant are shown. bc At the end of primary transplant, donor frequencies (b) in the host BM as well as the frequencies of various HSPC populations (c) were quantified by flow cytometry. LK, Lin-Kit + ; LSK, Lin-Kit + Sca1 + ; MPP, CD150-CD48 + LSK; HSC, CD150 + CD48-LSK. de BM cells from the 3 × 105 group were serially transplanted. Donor chimerisms in peripheral blood after secondary transplant (d) and tertiary transplant (e) are shown. f SLAM LSK HSCs were mixed with 3 × 105 competitors and transplanted into lethally irradiated recipients. Donor chimerisms in peripheral blood 16 weeks after transplant are shown. Each symbol represents an individual mouse; horizontal lines indicate mean frequencies; error bars indicate SE. p values determined by two-tailed Student’s t-test are shown. ns: not significant. g shows quantifications of cell cycle analysis of LT-HSCs (Left) and MPPs (Right) in mice of different genotypes. **p < 0.01 compared to WT, two-tailed Student’s t-test. h shows a representative flow plot of cell cycle analysis in LT-HSCs. P values are calculated using two-tailed Student’s t-test in all plots. Data are pooled from 2–5 independent experiments
Fig. 3
Fig. 3
Lnk deficiency does not rescue ICL hypersensitivity associated with Fancd2 deficiency. a HSPCs were cultured in a graded concentration of MMC for 7 days. Total (right) and relative to untreated cell number (left) are shown. Statistical analysis using two-tailed Student’s t-test of comparisons among untreated and MMC-treated cells within each genotype are indicated. bd Fresh BM cells were plated in semi-solid methylcellulose media containing various concentrations of MMC and assessed for progenitors of myeloid (b), B cell (c), and erythroid lineages (d). Relative colony forming units relative to untreated are shown. *p < 0.05, **p < 0.01, two-tailed Student’s t-test, denotes comparison between WT and D2; † p < 0.05, †† p < 0.01, denotes WT vs DKO, at the corresponding dose of MMC. Representative data from three independent repeats are shown
Fig. 4
Fig. 4
Lnk deficiency rescues the growth and survival defect of Fancd2−/− HSPCs and mitigates genome instability. a, b HSPCs were cultured in TPO and SCF containing media for 14 days. One representative experiment of three independent replicates is shown. a Cumulative cell growth at days 5, 7, and 14 is shown. b At each corresponding day of culture, cells were plated for quantification of colony forming progenitors. Cumulative progenitor cell numbers were calculated and plotted. P values indicate two-tailed Student’s t-test. c On day 7, percentage of apoptotic cells was assessed by Annexin V + /7-AAD- cells and quantified. The right shows representative flow plots of Annexin V/7-AAD staining. d Quantification of cell cycle status in HSPCs using Ki67 and DAPI after 7 days in culture. Bars indicate mean and error bars indicate SE. *p < 0.05 compared to WT, Student’s t-test. e, f BM HSPCs cultured for 7 or 10 days in cytokines were assessed for chromosomal aberrations. e shows examples of chromosomal breaks (arrows) and radial chromosomes (arrowhead) scored on metaphase spreads. g Splenic B cells cultured for three days were assessed for chromosomal aberrations. f, g Quantifications of mean aberrations for 100–150 metaphase spreads from 4–6 animals are shown, and error bars indicate SE. Comparisons among all four genotypes were calculated by one-way ANOVA and are shown for each graph. p values using Tukey’s t-test for each indicated comparison pair are shown. Representative data from three independent repeats are shown
Fig. 5
Fig. 5
Lnk deficiency rescues HSC defects associated with FA upon forced in vivo proliferation. Proliferation of HSPCs in vivo was induced by pI:pC injection. a depicts a schematic overview of pI:pC injection. Mice were injected i.p. with 5 mg/kg pI:pC twice per week over four weeks, followed by analysis for HSPC frequency and function in bone marrow at day 28. b, LT-HSC frequency determined by SLAM LSK (b) or CD34-Flk2-SLAM LSK (c) marker schemes is shown. Bars indicate mean of frequencies from four to six mice, and error bars indicate SE. Statistics were calculated by two-tailed Student’s t-test. d Two million total BM cells from pI:pC-treated mice were mixed with 3 × 105 competitors and transplanted into lethally irradiated host animals. e In an independent experiment, one million total BM from pI:pC-treated mice were transplanted. d, e Donor chimerisms in peripheral blood of recipients 16 weeks after transplant are shown. Each symbol represents an individual recipient animal, horizontal bars represent the mean of each group. p values from two-tailed Student's t-test are shown. Two independent experiments are shown
Fig. 6
Fig. 6
Lnk deficiency stabilizes stalled replication forks in Fancd2−/− HSPCs through cytokine-JAK2 signaling. a, b BM cells from WT, D2−/− and D2−/−L−/− mice were plated in semi-solid methylcellulose media containing HU that induces replication stress (a) or indicated ICL DNA damage-inducing drugs, MMC, cisplatin, formaldehyde (b). Colony forming progenitor numbers relative to the vehicle-treated group (mean± SE) were enumerated and graphed. Representatives of three independent experiments are shown. Statistics were calculated using two-tailed Student’s t-test. (c). The top panel shows the experimental overview of the fork protection assay in single-molecule DNA fibers upon HU-mediated replication stalling. c, d Freshly isolated HSPCs (LSKs) from WT, D2−/−, Lnk−/−, and D2−/−Lnk−/− (D2−/−L−/−) mice were subjected to fork protection assay. The frequencies of different replication tract ratios are plotted in (c). The distributions of CldU/IdU fiber ratios are shown in (d). e Splenic B cells were cultured in RP-105 and LPS with (Left) or without IL-4 (Right), then subjected to fork protection assay. (f) HSPCs from WT, D2−/−, and D2−/−L−/− BMs were cultured in cytokines then subjected to the fork protection assay. 0, 1, or 2 µM JAK inhibitor ruxolitinib (JAKi) along with MRE11 inhibitor Mirin or vehicle alone were administered during the HU incubation in the fork protection assay. df The distribution of CldU/IdU fiber ratios is shown with the horizontal lines indicating geometric mean of fiber ratios, with corresponding number for each group shown at the bottom of the graph. a–c P values from two-tailed Student's t-test are shown. df Statistical significance of each set of conditions was calculated using Kruskal–Wallis ANOVA test and comparisons between individual groups were calculated using Dunn’s multiple comparison post test. *p < 0.05, **p < 0.01; ***p < 0.001; ****p < 0.0001; ns: not significant. Representative data from three independent repeats are shown
Fig. 7
Fig. 7
LNK depletion restores FA-like human progenitor cells. a depicts a schematic overview of isolation of primary human HSPCs for lentiviral transduction followed by CFC assay. b UCB-derived CD34 + cells were sequentially infected with lentiviruses expressing shRNA to Luciferase (Luc) or FANCD2 (D2) with GFP marker, followed by shRNA to Luc or LNK with mCherry marker. GFP + mCherry + cells were then sorted and plated onto semi-solid methylcellulose media. Colony forming progenitor numbers are shown with a two-tailed Student's t-test. Representative data from two independent repeats are shown. c TF-1 cells with shRNA-mediated depletion of LNK or FANCD2 or CRISPR/Cas9-mediated depletion of LNK were analyzed for depletion efficiency by western blot. Luc, luciferase. gRNA, guide RNA
Fig. 8
Fig. 8
Working model of how LNK signaling regulates replication stress and restores HSPC function in FA

Similar articles

Cited by

References

    1. Jordan CT, McKearn JP, Lemischka IR. Cellular and developmental properties of fetal hematopoietic stem cells. Cell. 1990;61:953–963. doi: 10.1016/0092-8674(90)90061-I. - DOI - PubMed
    1. Morrison SJ, Uchida N, Weissman IL. The biology of hematopoietic stem cells. Annu. Rev. Cell. Dev. Biol. 1995;11:35–71. doi: 10.1146/annurev.cb.11.110195.000343. - DOI - PubMed
    1. Parmar K, D’Andrea A, Niedernhofer LJ. Mouse models of Fanconi anemia. Mutat. Res. 2009;668:133–140. doi: 10.1016/j.mrfmmm.2009.03.015. - DOI - PMC - PubMed
    1. Kee Y, D’Andrea AD. Molecular pathogenesis and clinical management of Fanconi anemia. J. Clin. Invest. 2012;122:3799–3806. doi: 10.1172/JCI58321. - DOI - PMC - PubMed
    1. Kennedy RD, D’Andrea AD. The Fanconi anemia/BRCA pathway: new faces in the crowd. Genes Dev. 2005;19:2925–2940. doi: 10.1101/gad.1370505. - DOI - PubMed

Publication types

MeSH terms

Substances