Comparative Study
. 2018 Sep 25;8(1):14340.
doi: 10.1038/s41598-018-32519-7.

Comparative in depth RNA sequencing of P. tricornutum's morphotypes reveals specific features of the oval morphotype

Affiliations
Comparative Study

Comparative in depth RNA sequencing of P. tricornutum's morphotypes reveals specific features of the oval morphotype

Clément Ovide et al. Sci Rep. .

Abstract

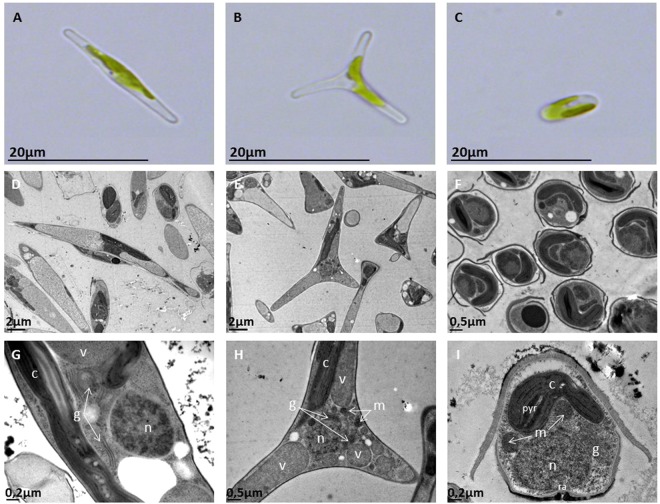
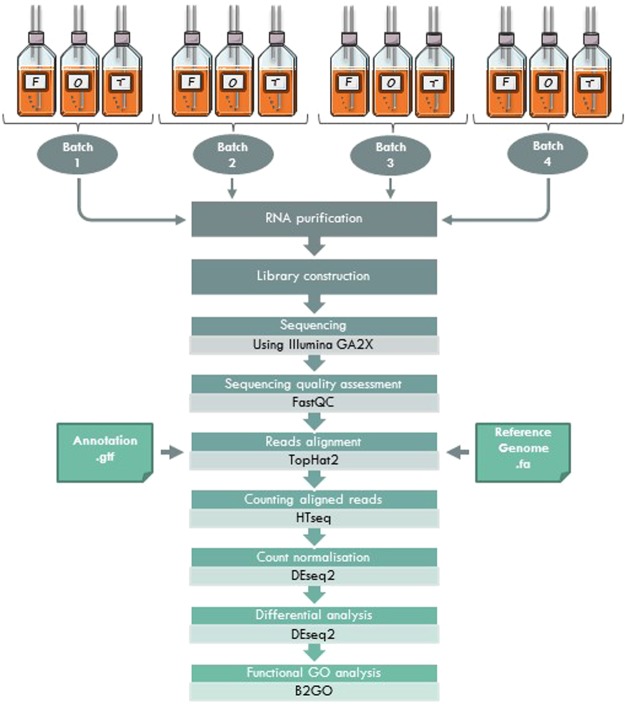
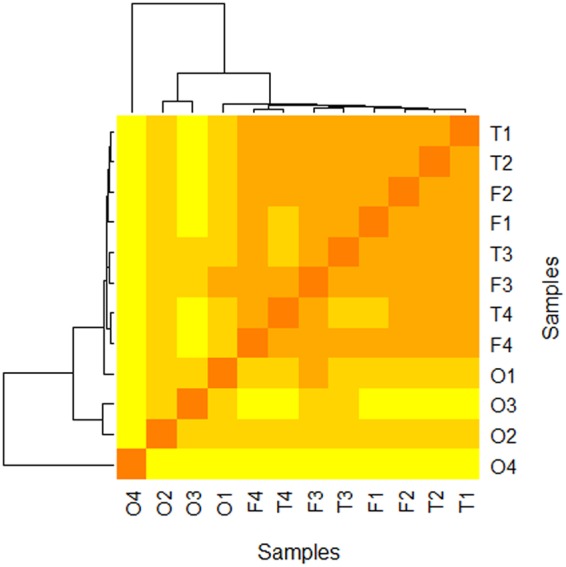
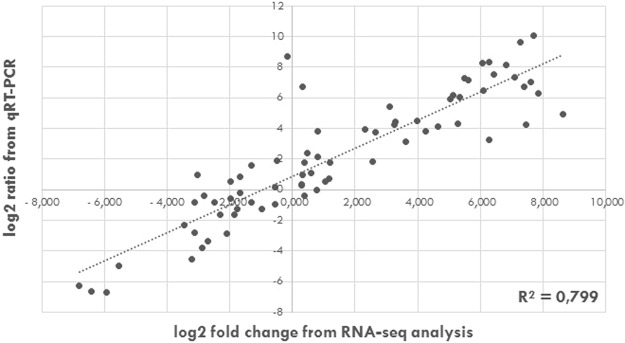
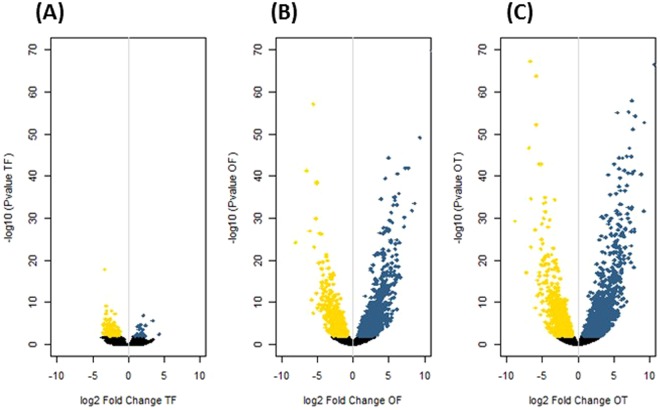
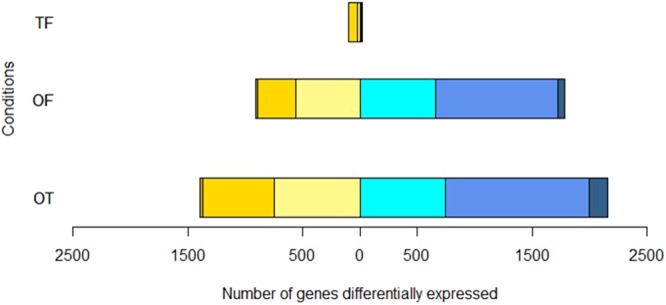
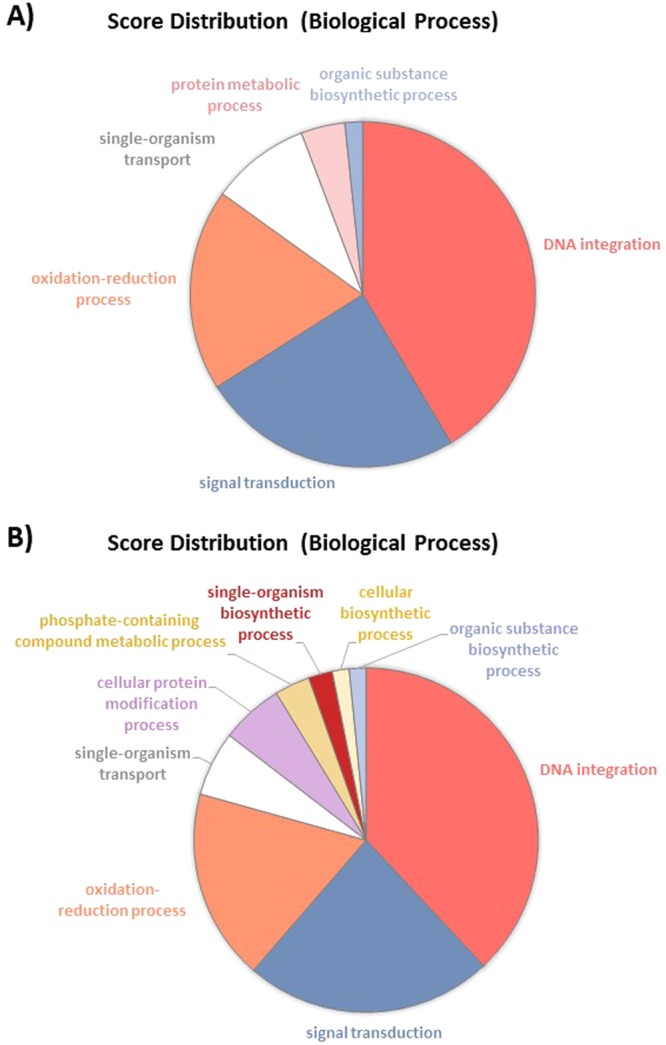
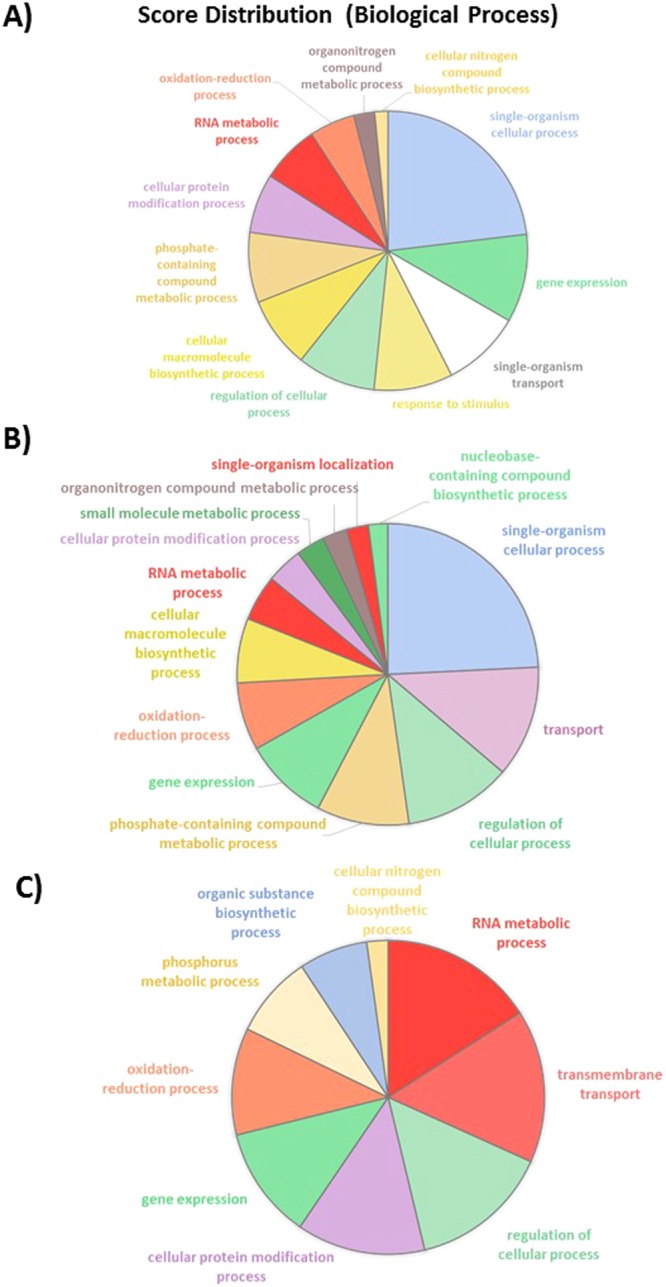
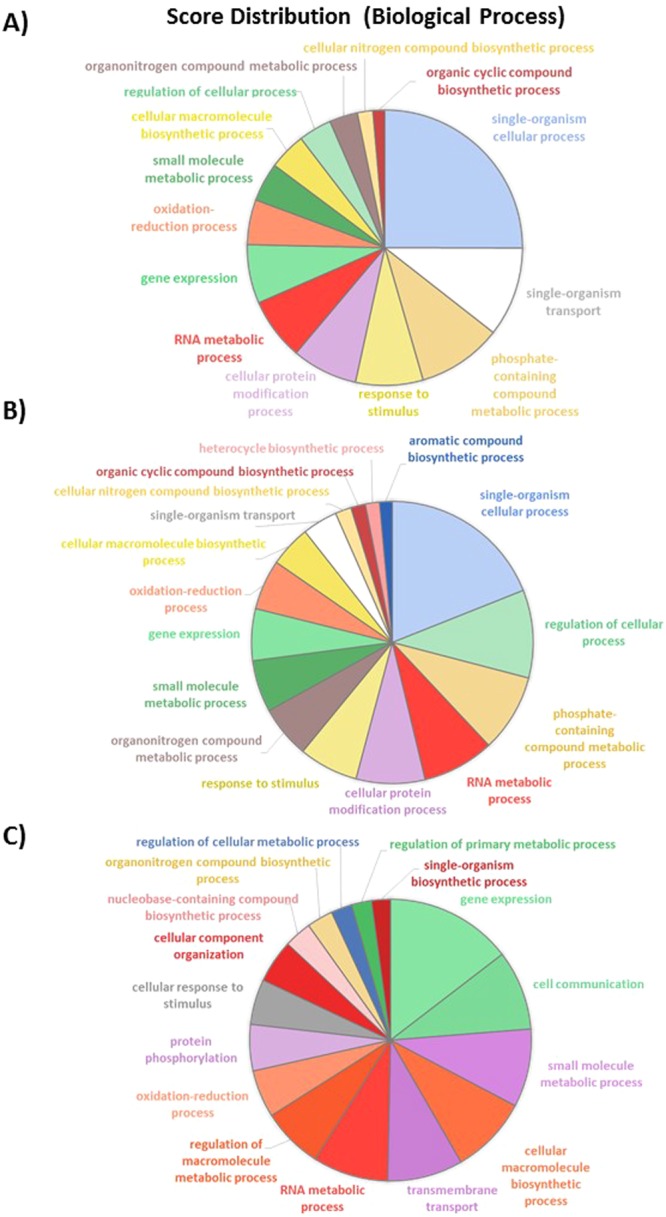
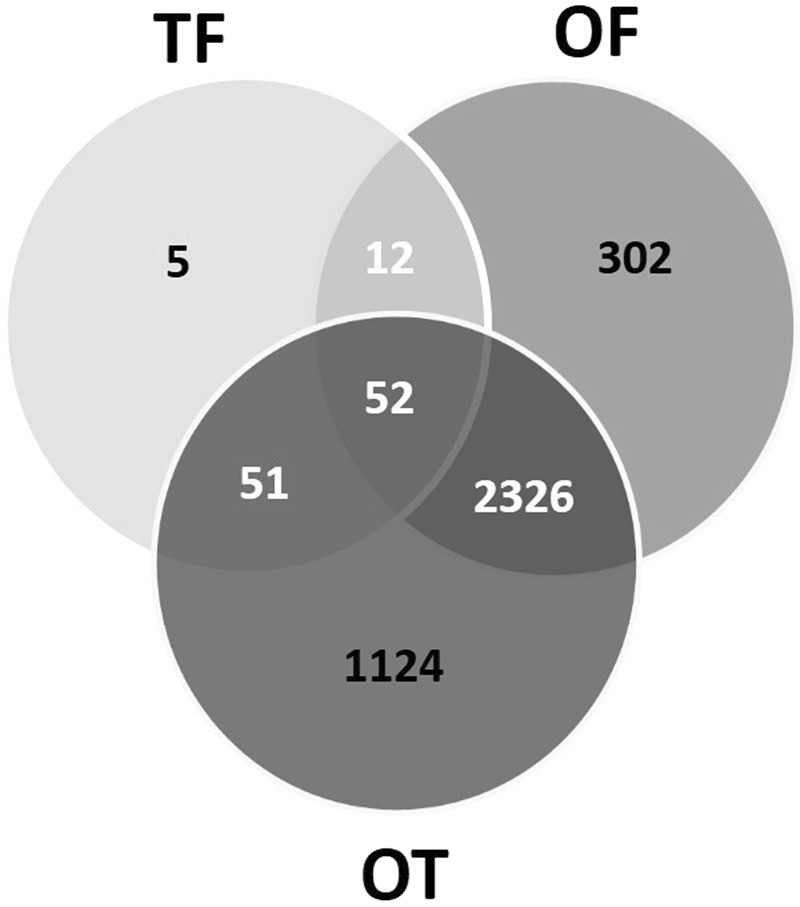
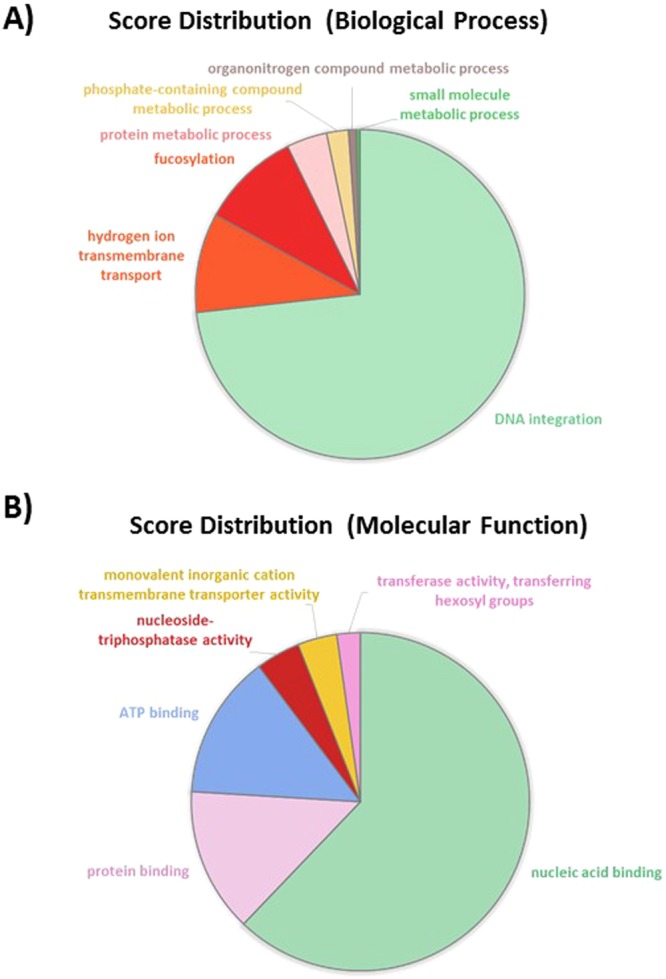
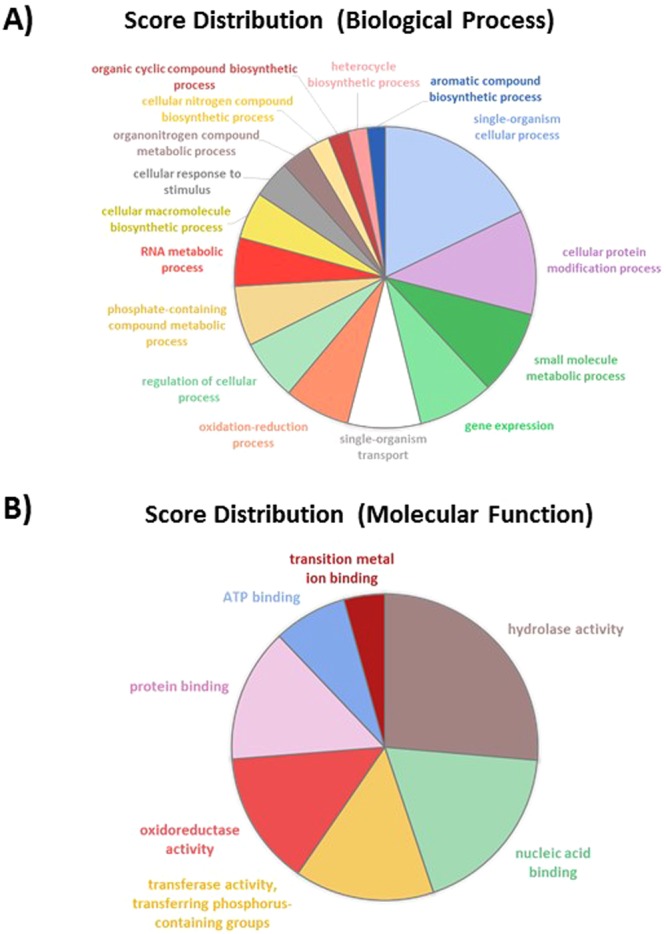
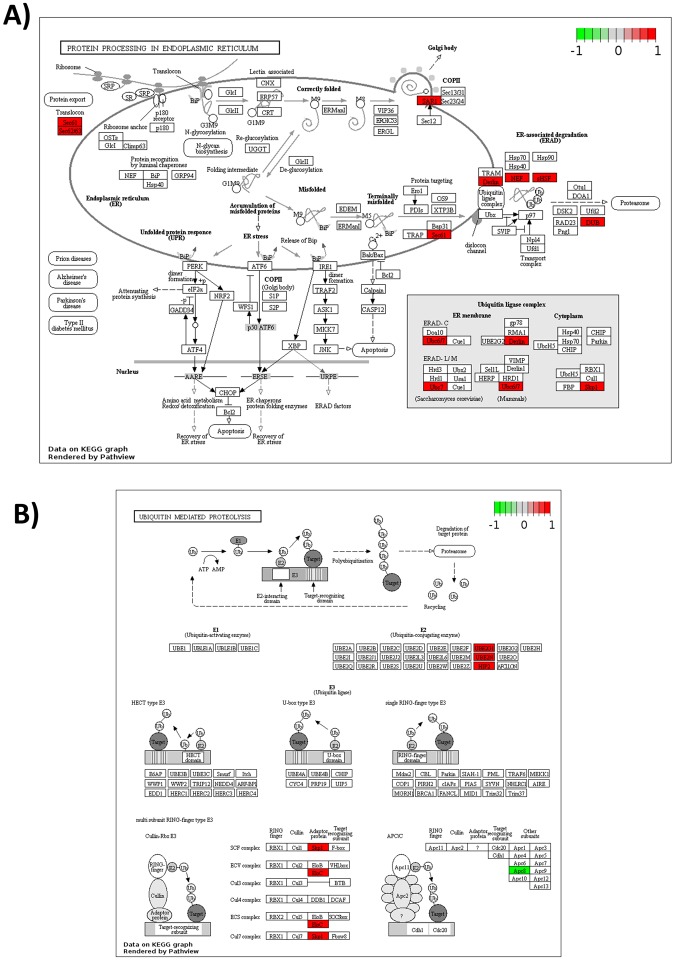
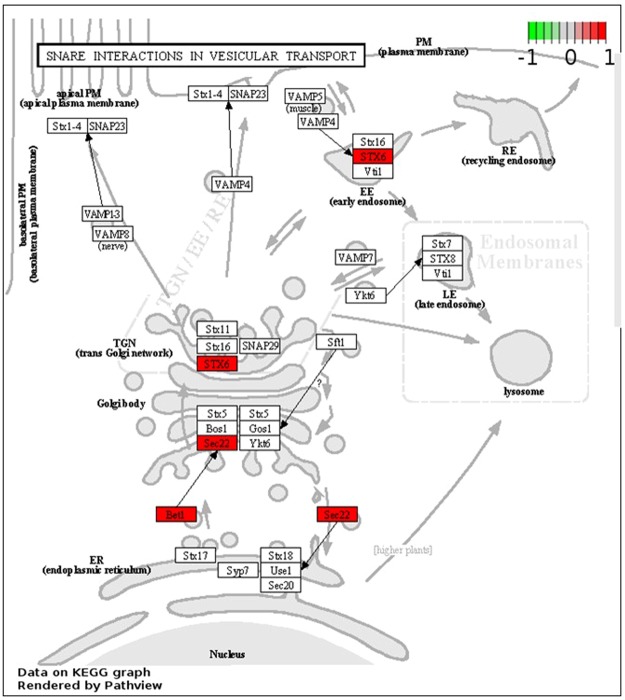
Phaeodactylum tricornutum is the most studied diatom encountered principally in coastal unstable environments. It has been hypothesized that the great adaptability of P. tricornutum is probably due to its pleomorphism. Indeed, P. tricornutum is an atypical diatom since it can display three morphotypes: fusiform, triradiate and oval. Currently, little information is available regarding the physiological significance of this morphogenesis. In this study, we adapted P. tricornutum Pt3 strain to obtain algal culture particularly enriched in one dominant morphotype: fusiform, triradiate or oval. These cultures were used to run high-throughput RNA-Sequencing. The whole mRNA transcriptome of each morphotype was determined. Pairwise comparisons highlighted biological processes and molecular functions which are up- and down-regulated. Finally, intersection analysis allowed us to identify the specific features from the oval morphotype which is of particular interest as it is often described to be more resistant to stresses. This study represent the first transcriptome wide characterization of the three morphotypes from P. tricornutum performed on cultures specifically enriched issued from the same Pt3 strain. This work represents an important step for the understanding of the morphogenesis in P. tricornutum and highlights the particular features of the oval morphotype.


Conflict of interest statement

The authors declare no competing interests.

Figures

Figure 1
Figure 1
Micrographs of P. tricornutum’s morphotypes. (A–C) Micrographs obtained by light microscopy of P. tricornutum cells alive. (A) fusiform morphotype; (B) triradiate morphotype and (C) Oval morphotype. (D–F) Transmission electron microscopy (TEM) micrographs of the three morphotypes. Overview of the cells which were embedded in LRW resin with 0.5% uranyl acetate in a methanol/Reynold’s lead citrate solution. (D) fusiform morphotype; E: triradiate morphotype and (F) Oval morphotype. (G–I) Enlarge views of the TEM micrographs showing general cellular distribution of organelles in the fusiform cells (G), in the triradiate one (H) and in the oval cell type (I). n: nucleus; g: Golgi apparatus; v: vacuole; m: mitochondria; pyr: pyrenoid; c: chloroplast; ra: raphe.
Figure 2
Figure 2
Summary of the experimental design and analytical pipeline used in this study. Briefly, 4 biological replicates of cultures enriched for each specific morphotype were performed in parallel. The RNA were independently purified and used as a matrix to build libraries for RNA sequencing. Quality of the raw data generated have been checked with FastQC. Then, the short reads were aligned on the annotated genome with TopHat2. Aligned reads have been counted with HTseq DESeq2 have been used to normalize counts and to perform the differential analysis. Finally, GO enrichment have been done with B2GO for functional analysis.
Figure 3
Figure 3
Heatmap illustrating the correlation between the 4 biological replicates for each culture specifically enriched in either the fusiform (F), triradiate (T) or oval (O) morphotype. The heatmap has been built using the distance matrix computation (Additional file 6).
Figure 4
Figure 4
Validation of the RNA-Seq data using qRT-PCR analysis. Correlation between the log2 fold change extracted from the RNA-Seq data and the log2 ratio obtained by qRT-PCR analysis for 22 genes randomly selected from the differentially expressed genes (DEG) lists.
Figure 5
Figure 5
Vulcano Plots of pairwise comparisons of (A) T versus F (TF); (B) O versus F (OF); (C) O versus T (OT). The yellow dots represent down-regulated genes. In contrast, cyan dots represent up-regulated genes. Dark dots represent the non-significantly DE genes.
Figure 6
Figure 6
Graph representing the distribution of the significantly differentially expressed genes (DEG) in relation to their log2 fold change values. Blue squares represent up-regulated genes with a log2 fold change value comprised between 0 to 2 for the light blue, 2 to 5 for the median blue and superior to 5 for the dark blue. Yellow squares represent the down-regulated genes with different color intensities which are corresponding to the value of log2 fold change, log2 fold change value comprised between 0 to 2 for the light yellow, 2 to 5 for the median yellow and superior to 5 for the dark yellow.
Figure 7
Figure 7
Pie charts representing the biological processes which are alliterated in the TF pairwise comparison. (A) Overall biological processes associated to up- and down-regulated genes and (B) biological processes which are specifically associated to down-regulated genes.
Figure 8
Figure 8
Pie charts representing the biological processes which are alliterated in the OF pairwise comparison. (A) Overall biological processes associated to up- and down-regulated genes and (B) biological processes which are specifically associated to up-regulated genes, (C) biological processes associated to down-regulated genes.
Figure 9
Figure 9
Pie charts representing the biological processes which are alliterated in the OT pairwise comparison. (A) Overall biological processes associated to up- and down-regulated genes and (B) biological processes which are specifically associated to up-regulated genes, (C) biological processes associated to down-regulated genes.
Figure 10
Figure 10
Venn diagram showing the distribution of the DE genes between the three pairwise comparisons.
Figure 11
Figure 11
Pie charts representing the biological processes and molecular functions which are alliterated in the 52 common genes between TF, OF and OT. (A) Overall biological processes associated to up- and down-regulated genes; (B) overall of the molecular functions associated to up- and down-regulated genes.
Figure 12
Figure 12
Pie charts representing the biological processes and molecular functions which are alliterated in the 2,336 genes specific to the oval morphotype. (A) Overall biological processes associated to up- and down-regulated genes; (B) overall of the molecular functions associated to up- and down-regulated genes.
Figure 13
Figure 13
Mapping of the DE genes exclusive to the oval morphotype on KEGG metabolic pathways. (A) Protein processing in endoplasmic reticulum pathway; (B) Ubiquitin mediated proteolysis pathway; (C) Proteasome pathway. Copyright permission of KEGG pathway maps were kindly provided by the Kanehisa laboratory.
Figure 14
Figure 14
Mapping of the DE genes exclusive to the oval morphotype on the SNARE interactions in vesicular transport pathway issued from the KEGG metabolic pathway. Copyright permission of this KEGG pathway map was kindly provided by the Kanehisa laboratory.

Similar articles

Cited by

References

    1. Armbrust EV. The life of diatoms in the world’s oceans. Nature. 2009;459:185–192. doi: 10.1038/nature08057. - DOI - PubMed
    1. Keeling PJ, Palmer JD. Horizontal gene transfer in eukaryotic evolution. Nat. Rev. Genet. 2008;9:605–618. doi: 10.1038/nrg2386. - DOI - PubMed
    1. Bowler C, Vardi A, Allen AE. Oceanographic and Biogeochemical Insights from Diatom Genomes. Annu. Rev. Mar. Sci. 2010;2:333–365. doi: 10.1146/annurev-marine-120308-081051. - DOI - PubMed
    1. Moustafa A, et al. Genomic footprints of a cryptic plastid endosymbiosis in diatoms. science. 2009;324:1724–1726. doi: 10.1126/science.1172983. - DOI - PubMed
    1. Prihoda J, et al. Chloroplast-mitochondria cross-talk in diatoms. J. Exp. Bot. 2012;63:1543–1557. doi: 10.1093/jxb/err441. - DOI - PubMed

Publication types

LinkOut - more resources