. 2018 Sep 11:12:62.
doi: 10.3389/fncom.2018.00062. eCollection 2018.

Feasibility Theory Reconciles and Informs Alternative Approaches to Neuromuscular Control

Affiliations

Feasibility Theory Reconciles and Informs Alternative Approaches to Neuromuscular Control

Brian A Cohn et al. Front Comput Neurosci. .

Abstract

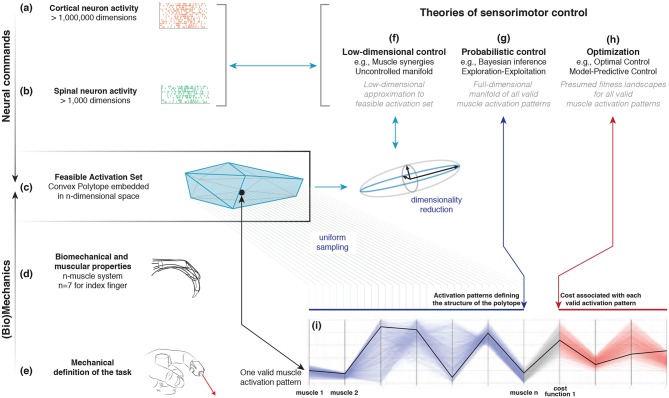
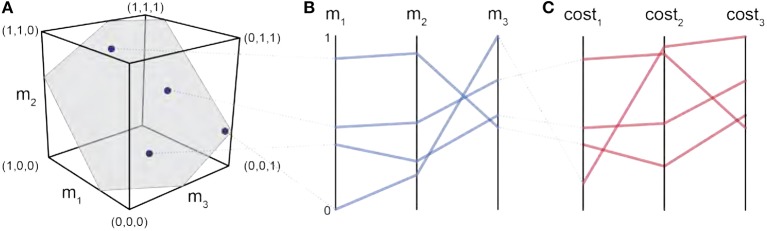
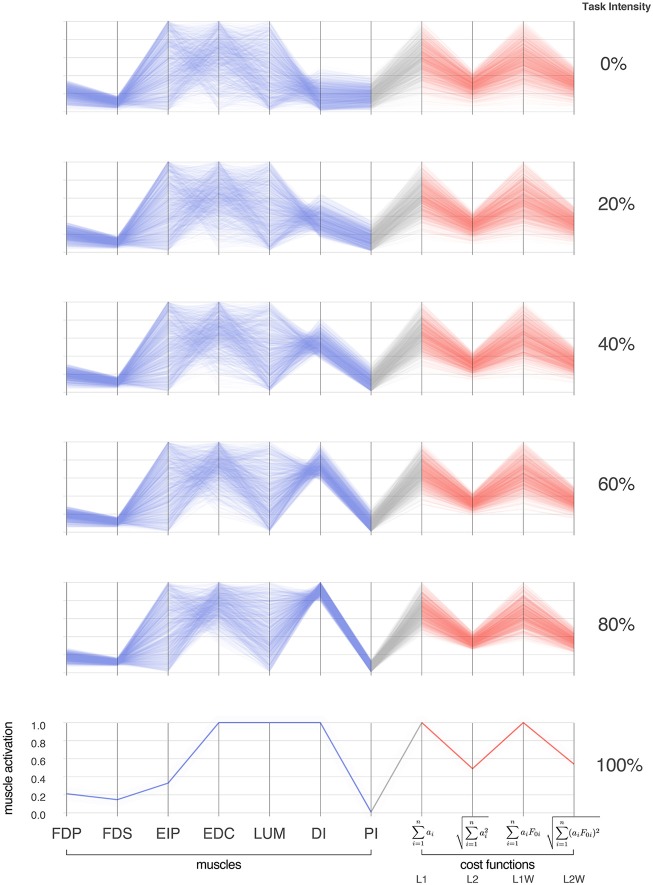
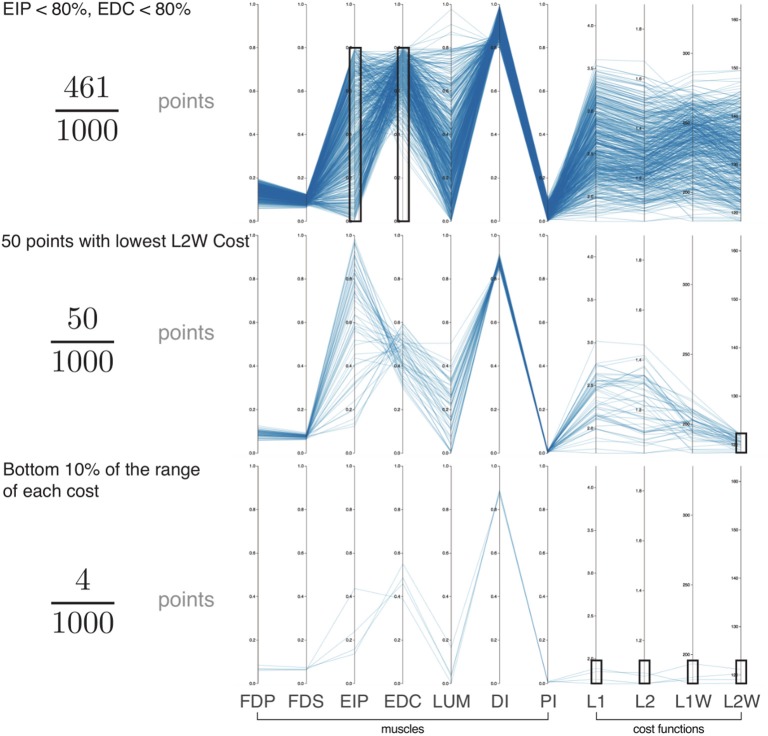
We present Feasibility Theory, a conceptual and computational framework to unify today's theories of neuromuscular control. We begin by describing how the musculoskeletal anatomy of the limb, the need to control individual tendons, and the physics of a motor task uniquely specify the family of all valid muscle activations that accomplish it (its 'feasible activation space'). For our example of producing static force with a finger driven by seven muscles, computational geometry characterizes-in a complete way-the structure of feasible activation spaces as 3-dimensional polytopes embedded in 7-D. The feasible activation space for a given task is the landscape where all neuromuscular learning, control, and performance must occur. This approach unifies current theories of neuromuscular control because the structure of feasible activation spaces can be separately approximated as either low-dimensional basis functions (synergies), high-dimensional joint probability distributions (Bayesian priors), or fitness landscapes (to optimize cost functions).

Keywords: dimensionality; feasibility; forces; motor control; neuromechanics; optimization; synergies; tendon-driven.


Figures

Figure 1
Figure 1
Emergence and interpretation of feasible activation spaces for a particular motor task. The descending motor command for a given task is issued by the motor cortex (a), which projects onto inter-neurons and alpha-motor neuron pools in the spinal cord (b). The combined drive to all alpha-motor neurons of a muscle can be considered its total muscle activation level (a value between 0 and 1). If we consider that muscles can, to a large extent, be controlled independently and in different ways, then the overall motor command can be conceptualized as a multi-dimensional muscle activation pattern (i.e., a point) in a high-dimensional muscle activation space (Chao and An, ; Spoor, ; Kuo and Zajac, ; Valero-Cuevas et al., ; Todorov and Jordan, 2002) (c). For that muscle activation pattern to be valid, it has to elicit muscle forces (d) capable of satisfying the mechanical constraints of the task—in this case defining a well-directed sub-maximal fingertip force (e). Given the large number of muscles in vertebrates, there can be muscle redundancy: where a given task can be accomplished with a large number of valid muscle activation patterns. We propose that our novel ability to characterize the high-dimensional structure of feasible activation spaces (i) allows to us to compare, contrast, and reconcile today's three dominant approaches to muscle redundancy in sensorimotor control (f–h).
Figure 2
Figure 2
Parallel coordinates characterize the high-dimensional structure of a feasible activation spaces. Consider four points (i.e., muscle activation patterns) from the polygon that is a feasible activation space (A). The activation level for each muscle (i.e., the coordinates of each point) are sewn across three vertical parallel axes (B). As is common when evaluating muscle coordination patterns, each point can also be assigned a cost as per an assumed cost function. The associated cost for each muscle activation pattern can also be shown as an additional dimension. We show three representative cost functions (C). Activation levels are bound between 0 and 1, and costs are normalized to their respective observed ranges.
Figure 3
Figure 3
Activation patterns of the seven muscles of the index finger across six intensities (magnitudes) of a fingertip force vector in the distal direction. The connectivity across parallel coordinates visualizes the correlations among muscle activation patterns at different task intensities. At the extremes of 0 and 100% we have, respectively, the coordination patterns that produce pure co-contraction and no fingertip force, and the one unique solution for maximal fingertip force (Valero-Cuevas et al., 1998). In between, we see how the structure of the feasible activation spaces changes, and that much redundancy is lost rather late (at intensities >80%, in agreement with Sohn et al., 2013). In blue are the activation values, and in red are normalized costs for four common cost functions in the literature. For each task intensity, we produced 1,000 points that are uniformly distributed in the polytope via the Hit-and-Run method. The muscles are FDP: flexor digitorum profundus, FDS: flexor digitorum superficialis, EIP: extensor indicis proprius, EDC: extensor digitorum communis, LUM: lumbrical, DI: dorsal interosseous, PI: palmar interosseous. Color is used solely to differentiate muscle activations (blue) from cost values (red).
Figure 4
Figure 4
Exploration of the feasible activation space for task intensity of 80%. Here we show three informative examples of constraints applied to the points sampled from the feasible activation space (n = 1,000; axes match those of Figure 3). With this interactive visualization, we can easily see how the size (i.e., number of solutions) and characteristics of the family of valid muscle activation patterns change. For example, in the event of (Top) weakness of a group of muscles (54% reduction), (Middle) selection of the lowest 5% of a given cost function (95% reduction), and (Bottom) enforcing the lowest 10% of cost range across multiple cost functions (99.6% reduction). In all cases, the family of valid muscle activation patterns retains a wide range of activation levels for some muscles. While it is challenging to understand the structure of the feasible activation space with a static plot of the parallel coordinates, interactively manipulating the muscle ranges on one or multiple axes makes it very easy to view and describe how muscle activations change in the face of different constraints.
Figure 5
Figure 5
Approximating the structure of feasible activation spaces via principal components analysis (PCA) is sensitive to both the task intensity and the amount of input data used. Rows show the variance explained by the first (top) through third (bottom) principal components with increasing data points for a given replicate (left to right). Hit-and-Run sampling provides the ground truth for the high-dimensional structure of the feasible activation set at each task intensity. Each box plot, across all subplots, is formed from 100 metrics (replicates), where each metric is the PC variance explained for a replicate “subject” which performed the task n times (where n is one of 10, 100, or 1000 task repetitions). We find that PCA approximations to this structure do not generalize across tasks intensities (i.e., the polytope changes shape as redundancy is lost), and numbers of points. That is, > 100 muscle activation patterns should be collected from a given subject to confidently estimate the real changes in variance explained as a function of task intensity. Compare points labeled a, b, c, corresponding to 11, 66, and 88% of task intensity, respectively.
Figure 6
Figure 6
PCA loadings change with task intensity. For each of 1,000 task intensities, we collected 1,000 muscle activation patterns from the feasible activation space and performed PCA. The facet rows show the changes in PC loadings, which determine the direction of all PCs in 7-dimensional space. Note that the signs of the loadings depend on the numerics of the PCA algorithm, and are subject to arbitrary flips in sign (Clewley et al., 2008)—thus for clarity we plot them such that FDP's loadings in PC1 are positive at all task intensities. Dotted vertical lines connect loadings of PC2 and PC3 in spite of flips in sign. A discontinuity here is not indicative of a major change to the feasible activation space. It instead, is a result of how PCA selects loadings. The shape of the activation space has tilted at these points, thereby flipping the sign. Note that the values are the same before and after the jump, less the sign. These loadings (i.e., synergies) change systematically, as noted for representative task intensities a, b, c in Figure 5, and more so after b. This reflects changes in the geometric structure of the feasible activation space as redundancy is lost.
Figure 7
Figure 7
The within-muscle probabilistic structure of feasible muscle activation across 1,000 levels of fingertip force intensity. The cross-section of each density plot is the 50-bin histogram of activation for each muscle, at that task intensity. The changes in the breadth and height for each muscle's histogram reveal muscle-specific changes in their probability distributions with task intensity. Height represents the percentage of solutions for that task. The axis going into the page indicates increasing fingertip force intensity up to 100% of maximal. Color is used to provide perspective. It is interesting to note that, for example, both extensor and flexor muscles are used to produce this “precision pinch” force. This is to be expected as the activity in the extensors is necessary to properly direct the fingertip force vector (Valero-Cuevas and Hentz, 2002).
Figure 8
Figure 8
Spatiotemporal Tunneling. A dynamical movement can be decomposed into a sequence of slices in time, where each slice has a corresponding feasible activation space. Strung together, the sequence of feasible activation spaces form the “spatiotemporal tunnel” through which the neuromuscular system must operate. In this 3-dimensional schematic example, the black line represents one valid time-varying sequence of activations for three muscles. Because this sequence exists within each feasible activation space, it necessarily meets the constraints of the dynamical task at each instant.

References

    1. Adolph K. E., Cole W. G., Komati M., Garciaguirre J. S., Badaly D., Lingeman J. M., et al. (2012). How do you learn to walk? thousands of steps and dozens of falls per day. Psychol. Sci. 23, 1387–1394. 10.1177/0956797612446346 - DOI - PMC - PubMed
    1. Alessandro C., Delis I., Nori F., Panzeri S., Berret B. (2013). Muscle synergies in neuroscience and robotics: from input-space to task-space perspectives. Front. Comput. Neurosci. 7:43. 10.3389/fncom.2013.00043 - DOI - PMC - PubMed
    1. Anderson F. C., Pandy M. G. (2001). Static and dynamic optimization solutions for gait are practically equivalent. J. Biomech. 34, 153–161. 10.1016/S0021-9290(00)00155-X - DOI - PubMed
    1. Arnold E. M., Ward S. R., Lieber R. L., Delp S. L. (2010). A model of the lower limb for analysis of human movement. Ann. Biomed. Eng. 38, 269–279. 10.1007/s10439-009-9852-5 - DOI - PMC - PubMed
    1. Avis D., Fukuda K. (1992). A pivoting algorithm for convex hulls and vertex enumeration of arrangements and polyhedra. Dis. Comput. Geometry 8, 295–313. 10.1007/BF02293050 - DOI

LinkOut - more resources