. 2018 Sep 11:9:2054.
doi: 10.3389/fimmu.2018.02054. eCollection 2018.

Short Lifespans of Memory T-cells in Bone Marrow, Blood, and Lymph Nodes Suggest That T-cell Memory Is Maintained by Continuous Self-Renewal of Recirculating Cells

Affiliations

Short Lifespans of Memory T-cells in Bone Marrow, Blood, and Lymph Nodes Suggest That T-cell Memory Is Maintained by Continuous Self-Renewal of Recirculating Cells

Mariona Baliu-Piqué et al. Front Immunol. .

Abstract

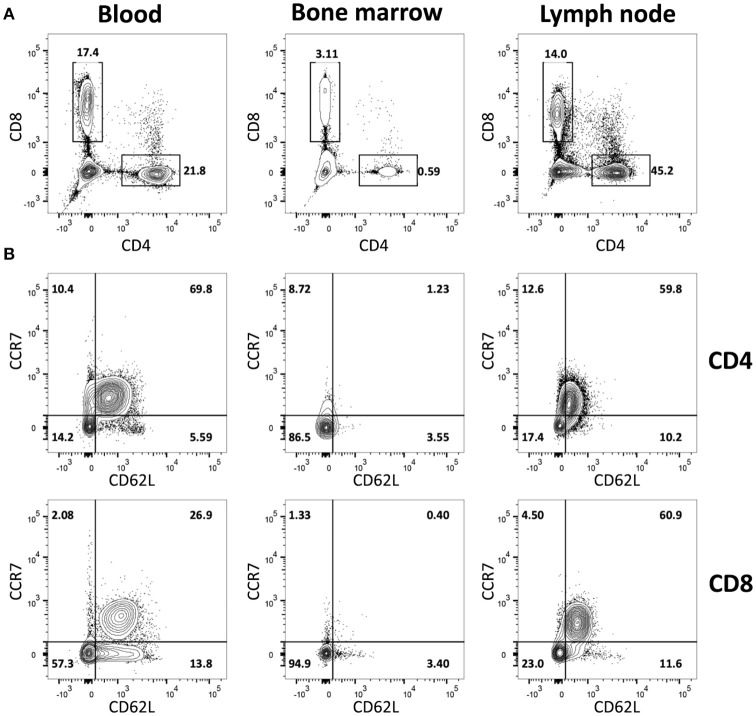
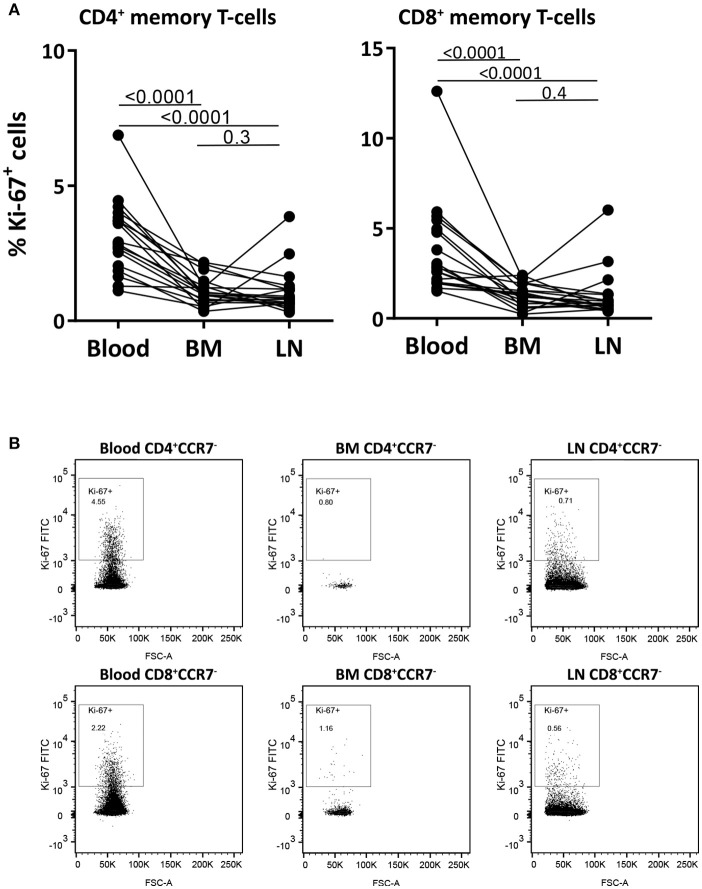
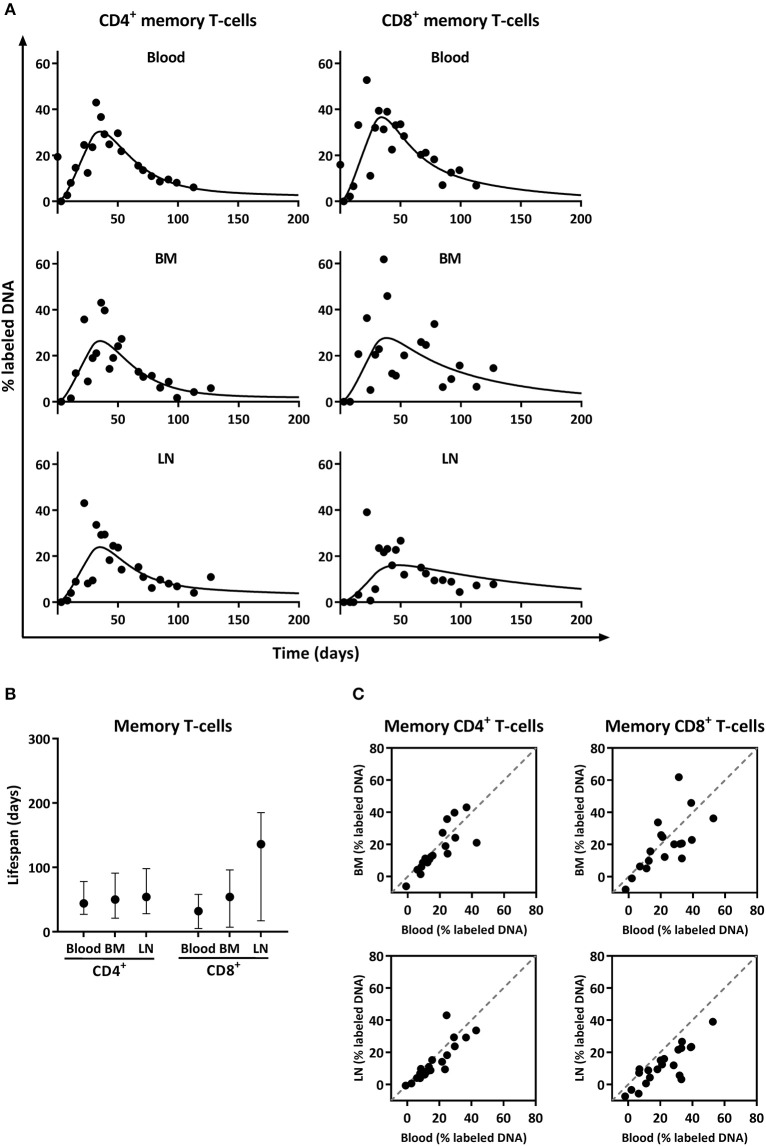
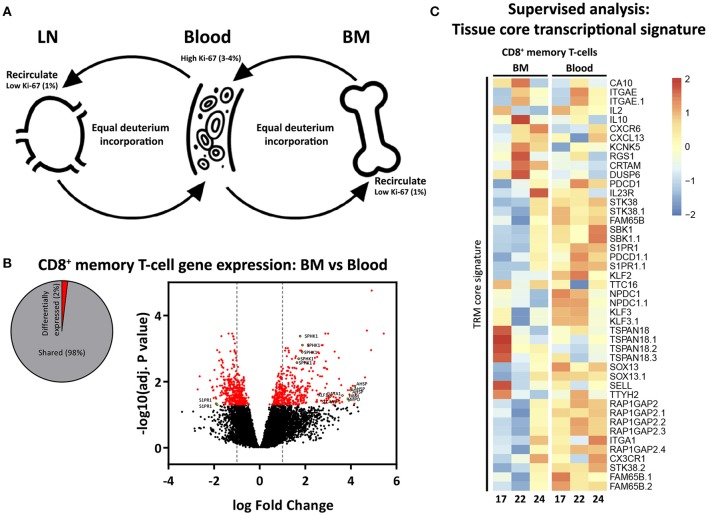
Memory T-cells are essential to maintain long-term immunological memory. It is widely thought that the bone marrow (BM) plays an important role in the long-term maintenance of memory T-cells. There is controversy however on the longevity and recirculating kinetics of BM memory T-cells. While some have proposed that the BM is a reservoir for long-lived, non-circulating memory T-cells, it has also been suggested to be the preferential site for memory T-cell self-renewal. In this study, we used in vivo deuterium labeling in goats to simultaneously quantify the average turnover rates-and thereby expected lifespans-of memory T-cells from BM, blood and lymph nodes (LN). While the fraction of Ki-67 positive cells, a snapshot marker for recent cell division, was higher in memory T-cells from blood compared to BM and LN, in vivo deuterium labeling revealed no substantial differences in the expected lifespans of memory T-cells between these compartments. Our results support the view that the majority of memory T-cells in the BM are self-renewing as fast as those in the periphery, and are continuously recirculating between the blood, BM, and LN.

Keywords: bone marrow; deuterium; lifespan; lymphocyte turnover; mathematical modeling; memory T-cells; stable isotope labeling.


Figures

Figure 1
Figure 1
Immunophenotypic characterization of BM-derived T-cells. Blood-, BM- and LN-derived mononuclear cells were obtained from healthy goats. (A) Staining of CD4+ and CD8+ lymphocytes and (B) of CD62L+ and CCR7+ within CD4+ (top row) and CD8+ (bottom row) T-cells isolated from blood, BM, and LN of a representative goat.
Figure 2
Figure 2
CCR7CD62L (DN-M) T-cells present transcriptional and functional characteristics of memory T-cells. Microarray profiling was performed on DN-M (CCR7CD62L) and DP-N (CCR7+CD62L+) CD4+ and CD8+ T-cells from blood and DN-M CD8+ T-cells from BM of 3 goats (goat 17, 22, and 24). (A) Heatmap showing normalized expression levels of control genes, CD3E, CD4, CD8A, CD8B, CCR7, and CD62L for all the samples. (B) Multidimensional scaling (MDS) of DN-M and DP-N samples from blood and BM for CD4+ and CD8+ T-cell subsets, based on the global transcriptome (~47,151 probes). (C,D) Diagram showing the percentage significantly differentially expressed genes (adjusted p-value (BH) < 0.05) between DN-M and DP-N CD4+ (C) or CD8+ (D) T-cells from blood, as well as volcano plots illustrating the log2 fold change differences in gene expression levels between DN-M and DP-N CD4+ (C) or CD8+ (D) T-cells from blood. Significantly differentially expressed genes (adjusted p-value (BH) < 0.05) are shown in red, blue dots depict genes related to memory differentiation. (E) Heatmap showing the normalized expression of genes from the adaptive memory signature (33) in CD4+ T-cells (left panel); and of genes from the conserved CD8 memory signature (33) in CD8+ T-cells (right panel). Genes up-regulated in DN-M compared to DP-N CD8+ T-cells in the 3 different goats are marked with an*. Gene expression is scaled per row. (F) DN-M (CCR7CD62L) and DP-N (CCR7+CD62L+) CD4+ and CD8+ T-cells sorted from blood were cultured in vitro for 70 h in the presence of PMA/ionomycin. Mean IFN-γ production, measured from the supernatant by ELISA, at 20 and 70 h after stimulation is shown as the OD of stimulated samples minus the OD of the background (unstimulated sample). P-values obtained using the Wilcoxon signed-rank test are shown.
Figure 3
Figure 3
Memory T-cells from blood have higher percentages of Ki-67 positive cells than those from BM and LN. (A) The fraction of memory (CCR7) CD4+ and CD8+ T-cells expressing the proliferation marker Ki-67 was assessed in paired samples from blood, BM, and LN. Paired samples were compared using the Wilcoxon signed-rank test, p-values are shown. (B) Intracellular Ki-67 staining of CD4+ and CD8+ memory (CCR7) T-cells isolated from blood, BM, and LN of a representative goat.
Figure 4
Figure 4
Analysis of deuterium enrichment and summary of the estimated lifespan of CD4+ and CD8+ memory T-cells from blood, BM and LN. (A) Best fits to the level of deuterium enrichment measured in the DNA of CD4+ and CD8+ memory (CCR7) T-cells from blood, BM and LN. Label enrichment in the DNA was scaled between 0 and 100% by normalizing to the maximum enrichment in granulocytes (See material and methods). (B) Estimated lifespans of CD4+ and CD8+ memory T-cells in days, and their respective 95% confidence limits. (C) Correlation between deuterium enrichment in BM and blood, and LN and blood. The gray dashed line represents the X = Y line.
Figure 5
Figure 5
Proposed model of proliferation and recirculation. (A) Memory T-cells from BM and LN have a lower fraction of Ki-67 positive cells compared to memory T-cells from blood, but similar deuterium incorporation. We here propose a dynamic model in which memory T-cells are continuously recirculating between BM, blood, and LN. If BM memory T-cells would compose a separate population of resting and resident cells, one would expect to find low percentages of Ki-67 as well as low deuterium incorporation in BM. The fact that memory T-cells isolated from the BM had substantial levels of deuterium enrichment in the DNA shows that memory T-cells from BM do proliferate. The fact that the percentage of Ki-67 positive cells in BM was lower compared to blood while deuterium enrichment curves were very similar strongly suggests that memory T-cells are recirculating. Because of the difficulties in the interpretation of Ki-67 expression (see discussion) it remains unclear where the divisions occur. (B) Diagram showing the percentage significantly differentially expressed genes (adjusted p-value (BH) < 0.05) between BM and blood memory (CCR7) CD8+ T-cells, as well as a volcano plot illustrating the log2 fold change differences in gene expression. Significantly differentially expressed genes are shown in red, yellow dots depict tissue related genes. (C) Heatmap showing normalized expression levels of genes defining the tissue resident memory (TRM) core transcriptional signature (42). Gene expression is scaled per row.

References

    1. Hammarlund E, Lewis MW, Hansen SG, Strelow LI, Nelson JA, Sexton GJ, et al. . Duration of antiviral immunity after smallpox vaccination. Nat Med. (2003) 9:1131–7. 10.1038/nm917 - DOI - PubMed
    1. Farber DL, Netea MG, Radbruch A, Rajewsky K, Zinkernagel RM. Immunological memory: lessons from the past and a look to the future. Nat Rev Immunol. (2016) 16:124–8. 10.1038/nri.2016.13 - DOI - PubMed
    1. Michie CA, McLean A, Alcock C, Beverley PCL. Lifespan of human lymphocyte subsets defined by CD45 isoforms. Nature (1992) 360:264–5. 10.1038/360264a0 - DOI - PubMed
    1. Westera L, Drylewicz J, Den Braber I, Mugwagwa T, Van Der Maas I, Kwast L, et al. . Closing the gap between T-cell life span estimates from stable isotope-labeling studies in mice and humans. Blood (2013) 122:2205–12. 10.1182/blood-2013-03-488411 - DOI - PubMed
    1. Crotty S, Ahmed R. Immunological memory in humans. Semin Immunol. (2004) 16:197–203. 10.1016/j.smim.2004.02.008 - DOI - PubMed

Publication types