. 2018 Sep 5:2018:7975013.
doi: 10.1155/2018/7975013. eCollection 2018.

Botulinum Neurotoxin Application to the Severed Femoral Nerve Modulates Spinal Synaptic Responses to Axotomy and Enhances Motor Recovery in Rats

Affiliations

Botulinum Neurotoxin Application to the Severed Femoral Nerve Modulates Spinal Synaptic Responses to Axotomy and Enhances Motor Recovery in Rats

Marcel Irintchev et al. Neural Plast. .

Abstract

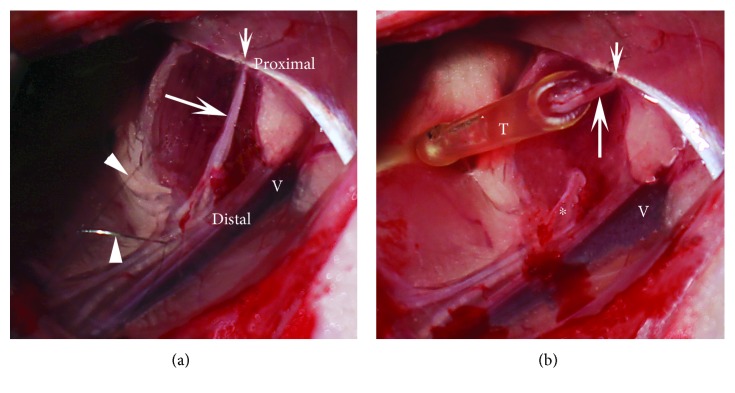
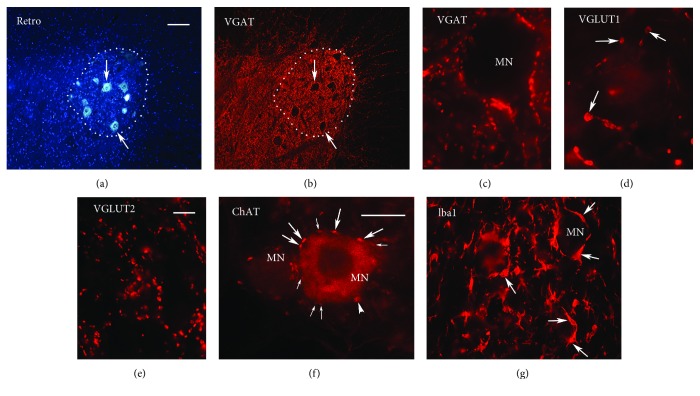
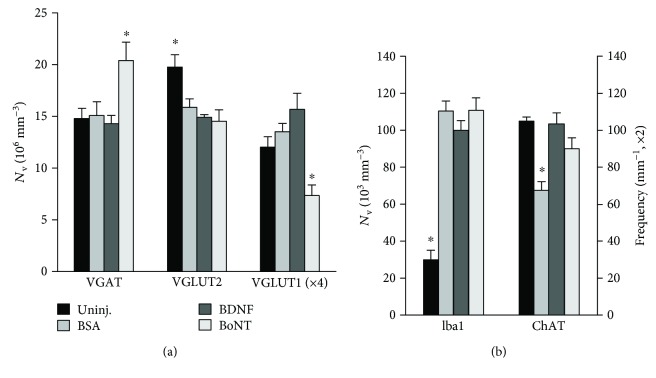
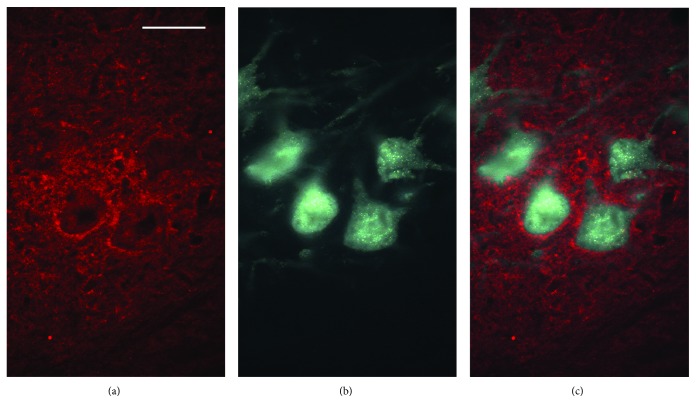
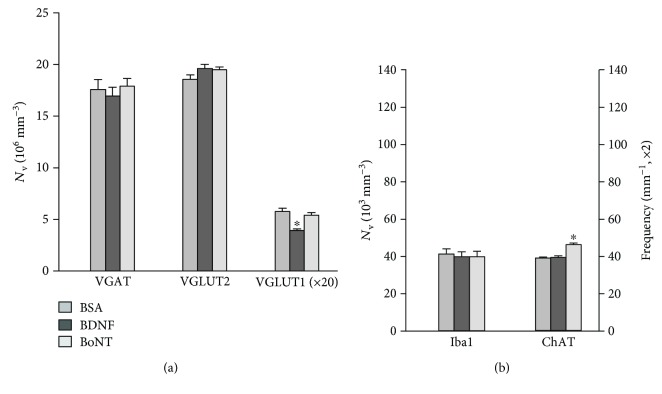
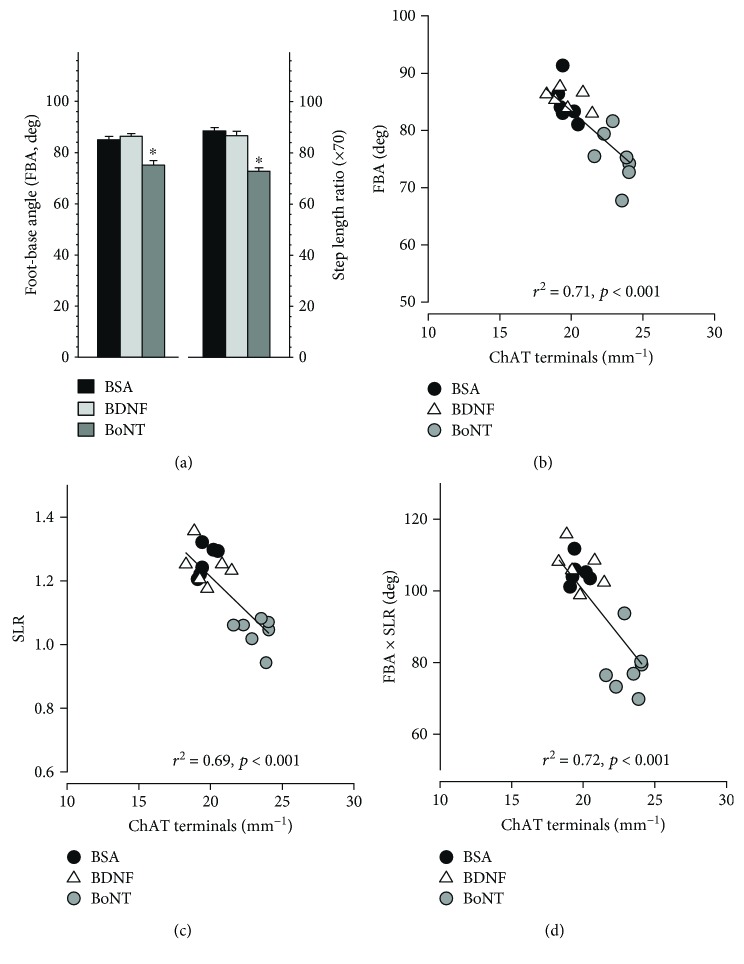
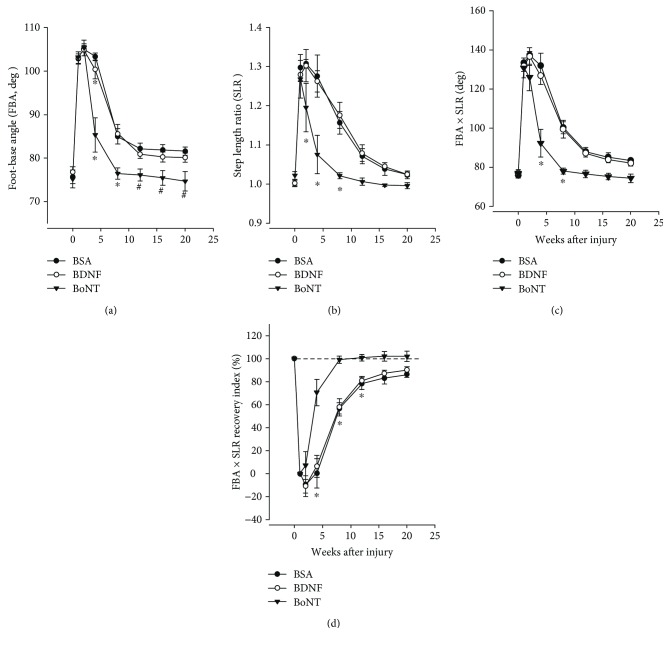
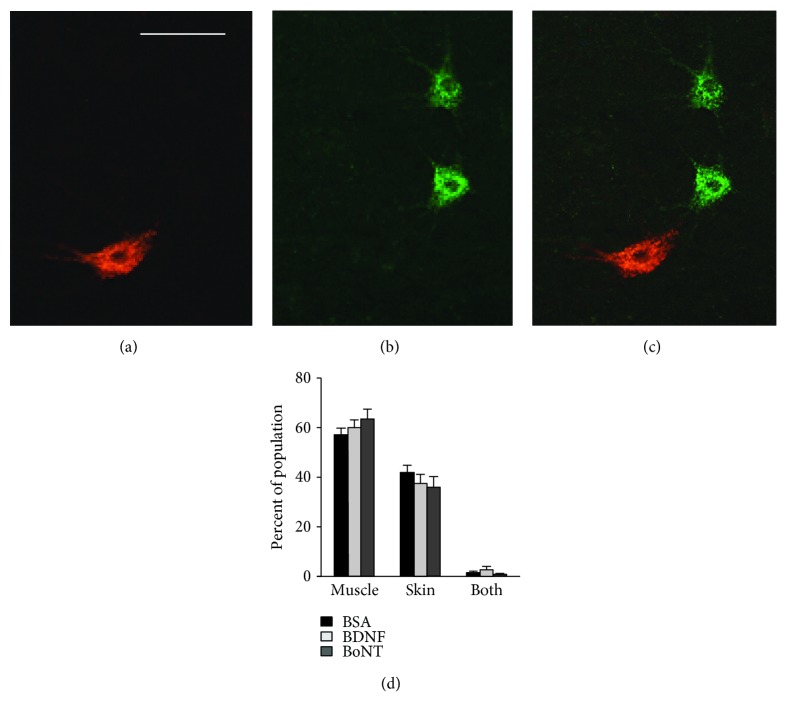
Botulinum neurotoxin A (BoNT) and brain-derived neurotrophic factor (BDNF) are known for their ability to influence synaptic inputs to neurons. Here, we tested if these drugs can modulate the deafferentation of motoneurons following nerve section/suture and, as a consequence, modify the outcome of peripheral nerve regeneration. We applied drug solutions to the proximal stump of the freshly cut femoral nerve of adult rats to achieve drug uptake and transport to the neuronal perikarya. The most marked effect of this application was a significant reduction of the axotomy-induced loss of perisomatic cholinergic terminals by BoNT at one week and two months post injury. The attenuation of the synaptic deficit was associated with enhanced motor recovery of the rats 2-20 weeks after injury. Although BDNF also reduced cholinergic terminal loss at 1 week, it had no effect on this parameter at two months and no effect on functional recovery. These findings strengthen the idea that persistent partial deafferentation of axotomized motoneurons may have a significant negative impact on functional outcome after nerve injury. Intraneural application of drugs may be a promising way to modify deafferentation and, thus, elucidate relationships between synaptic plasticity and restoration of function.


Figures

Figure 1
Figure 1
Drug application to the severed nerve. (a) The right femoral nerve trunk (arrow) prior to nerve injury. Proximally, the nerve is fixed by an epineural suture (short arrow) to the nearby muscle aponeurosis to prevent withdrawal of the proximal stump after nerve cut. Seen are also the 10–0 thread (upper arrowhead) used to fix the nerve and its needle (lower arrowhead), as well as the femoral vein (V). (b) The femoral nerve is transected, and the proximal stump is inserted in a self-made cup (T, see Materials and Methods) filled with drug solution. The distal nerve stump is marked by an asterisk.
Figure 2
Figure 2
Images of synaptic terminals and Iba1+ cells in the quadriceps motor nucleus. (a-b) A section containing back-labeled cell bodies of femoral motoneurons (a, arrows) is additionally stained for nuclei (a) and VGAT (b). The boundary of the quadriceps motor nucleus is indicated by a dotted line. Scale bar = 100 μm for (a-b). (c–e) VGAT+ and VGLUT 2+ axonal terminals (c, e) and VGLUT1+ varicosities (arrows, d). Scale bar = 10 μm for (c–e). (f) ChAT staining of two motoneuron cell bodies (MN) surrounded by cholinergic terminals (arrows). Counted were terminals around the MN soma with a visible nucleus (pale area in the center of the MN on the right hand side) which were in focus (thick arrows). Terminals out of focus or only partially seen in the focus plane (thin arrows) were not counted. No quantification was undertaken for the second MN profile (on the left hand side) since it had no visible nucleus. The arrowhead points to a ChAT+ cross-sectional profile of a dendrite close to the MN cell body. Such “perisomatic” dendritic profiles could be traced for long distances throughout the section thickness in contrast to the limited extent of the perisomatic terminals in the z-axis. (g) Iba1+ cells (arrows) some of which surround a motoneuron cell body (MN). Scale bar indicates 25 μm and 50 μm for panels (f) and (g), respectively. (a–g) Shown are representative images from tissue sections after different treatments to illustrate the quality of each staining which was similar in all experimental groups and time points.
Figure 3
Figure 3
Analysis of synaptic terminals and microglia in the quadriceps motor nucleus 1 week after femoral nerve injury and drug application. Included are also values from control rats without nerve injury and drug treatment (“Uninj.”). Shown are numerical densities (number per unit volume) of VGAT+, VGLUT1+, and VGLUT2+ terminals and Iba1+ microglial cells, as well as frequency (number per unit length) of ChAT+ perisomatic terminals (mean values + SEM). Asterisks indicate mean values significantly different from all other groups (one-way ANOVA, F3,16 = 4.87–44.8, p = 0.014–<0.001) with Holm-Sidak post hoc tests (p = 0.042–<0.001). N = 5 per group.
Figure 4
Figure 4
Cleaved SNAP-25 staining of a spinal cord section one week after injury and BoNT application. Immunostaining (a) is seen around the somata of back-labeled motoneurons and in the neuropil among them (b, c). Scale bar = 50 μm.
Figure 5
Figure 5
Analysis of synaptic terminals and microglia in the quadriceps motor nucleus two months after femoral nerve injury and drug application. Asterisks indicate mean values significantly different from all other groups (one-way ANOVA, F2,16 = 11.4 and 30.4, p < 0.002 and 0.001 for VGLUT1 and ChAT, resp.) with Holm-Sidak post hoc tests (p = 0.005–<0.001). N = 5–7 per group. Note that numbers of Iba1+ cells and ChAT+ terminals (b) and numbers of VGLUT1+ terminals (a) in BSA-treated animals are much lower than these at 1 week after injury (Figures 3(a) and 3(b)). This is consistent with previous findings [9, 10].
Figure 6
Figure 6
Motor recovery and correlations between functional parameters and ChAT terminal frequency two months after femoral nerve lesion and drug application. (a) Shown are mean values + SEM of foot-base angle (FBA) on the operated side and step length ratio (SLR). N = 6, 7, and 7 for BSA, BDNF, and BoNT, respectively. For both parameters, one-way ANOVA showed effects of treatment (F2,17 = 18.4 and 38.0 for FBA and SLR, respectively, p < 0.001 for both parameters). The BoNT group mean values were significantly different from the values of the BSA and BDNF groups (asterisks, p < 0.001, Holm-Sidak test). (b–d) Individual values of functional parameters plotted against numbers of ChAT terminals. Shown are regression lines, coefficients of determination (r2), and probability values (p).
Figure 7
Figure 7
Time course and degree of motor recovery after femoral nerve lesion and drug application. Shown are mean values ± SEM of foot-base angle on the operated side (FBA, a), step length ratio (SLR, b), product FBA × SLR (c), and recovery index for the product FBA × SLR (d) prior to injury (0 week) and 1–20 weeks p.o. The dashed horizontal line in (d) is drawn at 100%, a value indicating full degree of recovery. N = 7, 8, and 9 for BSA, BDNF, and BoNT, respectively. For all parameters shown, two-way ANOVA for repeated measures showed effects of time (F7,147 = 52.4–209, p < 0.001) and treatment (F2,21 = 9.51–15.6, p = 0.003–<0.001). Indicated by symbols are group mean values significantly different from the corresponding postoperative values of the BSA and BDNF groups and # the corresponding value of the BSA group (p < 0.05, Holm-Sidak post hoc procedure).
Figure 8
Figure 8
Retrograde labeling of motoneurons 20 weeks after lesion. (a–c) Representative images of motoneurons back-labeled through the muscle (quadriceps) and the skin (saphenous) branch of the femoral nerve (“Muscle” and “Skin”) using Fluoro-Ruby and Fluoro-Emerald (red and green fluorescence), (a) and (b), respectively, overlay in (c). Scale bar = 100 μm. (d) Quantitative analysis of retrogradely labeled cells including double-labeled motoneurons (“Both”). Shown are mean values + SEM. One-way ANOVA showed no effect of treatment on any of the motoneuron categories (F2,18 = 0.95–1.14, p = 0.342–0.533). N = 7 animals per group.

Similar articles

Cited by

References

    1. Blinzinger K., Kreutzberg G. Displacement of synaptic terminals from regenerating motoneurons by microglial cells. Zeitschrift für Zellforschung und Mikroskopische Anatomie. 1968;85(2):145–157. doi: 10.1007/BF00325030. - DOI - PubMed
    1. Borke R. C., Bridwell R. S., Nau M. E. The progression of deafferentation as a retrograde reaction to hypoglossal nerve injury. Journal of Neurocytology. 1995;24(10):763–774. doi: 10.1007/BF01191212. - DOI - PubMed
    1. Chen D. H. Qualitative and quantitative study of synaptic displacement in chromatolyzed spinal motoneurons of the cat. The Journal of Comparative Neurology. 1978;177(4):635–663. doi: 10.1002/cne.901770407. - DOI - PubMed
    1. Kerns J. M., Hinsman E. J. Neuroglial response to sciatic neurectomy. I. Light microscopy and autoradiography. Journal of Comparative Neurology. 1973;151(3):237–253. doi: 10.1002/cne.901510303. - DOI - PubMed
    1. Kreutzberg G. W. Dynamic changes in motoneurons during regeneration. Restorative Neurology and Neuroscience. 1993;5(1):59–60. doi: 10.3233/RNN-1993-5115. - DOI - PubMed

Substances

LinkOut - more resources