

Statin Use and Cancer Incidence in Patients with Type 2 Diabetes Mellitus: A Network Meta-Analysis
- PMID: 30254671
- PMCID: PMC6142785
- DOI: 10.1155/2018/8620682
Statin Use and Cancer Incidence in Patients with Type 2 Diabetes Mellitus: A Network Meta-Analysis
Abstract
Background: Type 2 diabetes mellitus (T2DM) patients are involved closely with cancer. This work aims to conduct a systematic review and network meta-analysis (NMA) to examine the effect of different types of statins on cancer incidence in patients with T2DM.
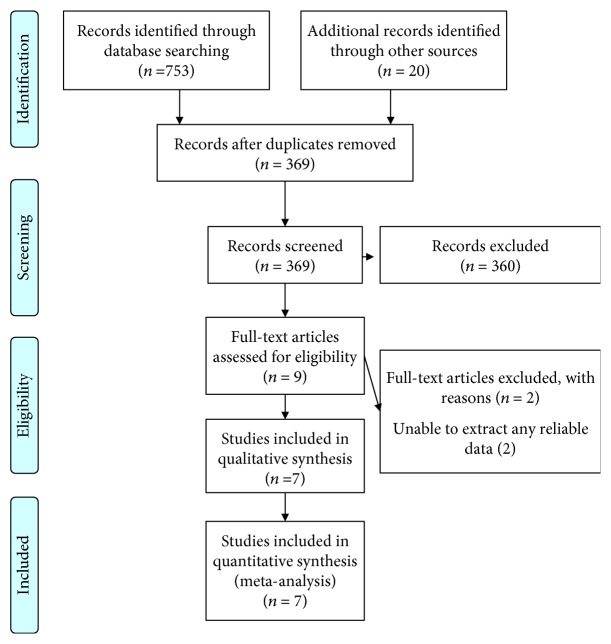
Methods: We systematically searched the Cochrane Library, PubMed, Embase, and Wanfang databases from January 1999 to March 2017. We performed a pairwise meta-analysis to estimate the pooled ratios (ORs) and 95% confidence intervals (CIs). A NMA was performed to compare different types of statins.
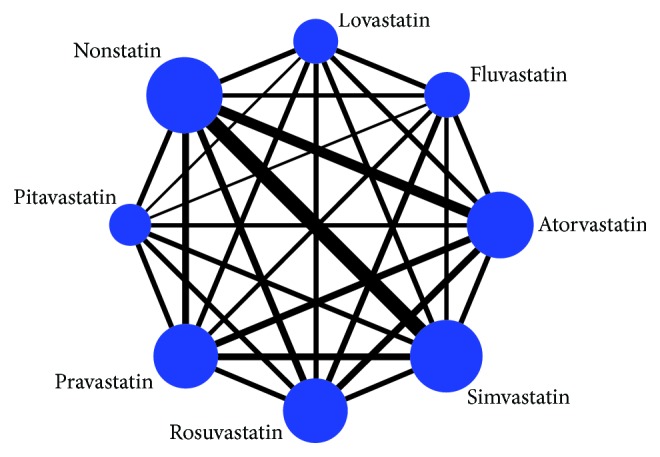
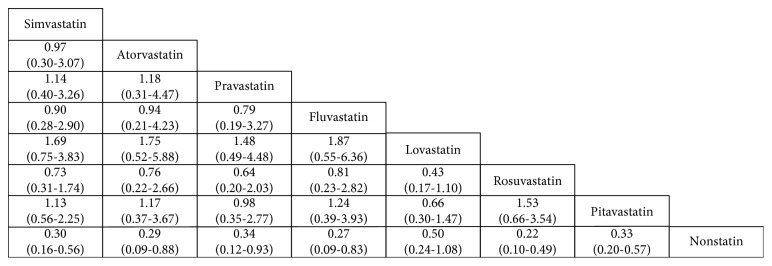
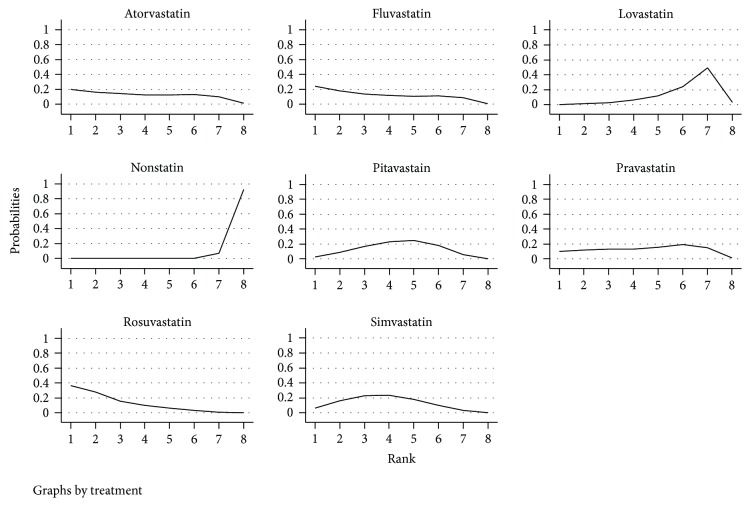
Results: Seven publications were included. In pairwise meta-analysis, the incidence of cancer in T2DM patients was reduced when simvastatin, atorvastatin, pravastatin, fluvastatin, lovastatin, rosuvastatin, and pitavastatin were used. In the result of NMA, the usage of simvastatin (RR 0.30 and 95% CI 0.16-0.56), atorvastatin (RR 0.29 and 95% CI 0.09-0.88), pravastatin (RR 0.34 and 95% CI 0.12-0.93), fluvastatin (RR 0.27 and 95% CI 0.09-0.83), rosuvastatin (RR 0.22 and 95% CI 0.10-0.49), and pitavastatin (RR 0.33 and 95% CI 0.20-0.57) was superior to the nonstatin groups. When compared with six other statins, rosuvastatin appeared to be the best one.
Conclusions: Different statins can reduce the risk of cancer in patients with T2DM. Our analyses suggest that rosuvastatin may be more effective than others.
Figures


Similar articles
-
Low-density lipoprotein cholesterol (LDL-C) levels and LDL-C goal attainment among elderly patients treated with rosuvastatin compared with other statins in routine clinical practice.Am J Geriatr Pharmacother. 2007 Sep;5(3):185-94. doi: 10.1016/j.amjopharm.2007.10.002. Am J Geriatr Pharmacother. 2007. PMID: 17996658
-
Long-term outcomes of statin dose, class, and use intensity on primary prevention of cardiovascular mortality: a national T2DM cohort study.Eur J Clin Pharmacol. 2023 May;79(5):687-700. doi: 10.1007/s00228-023-03488-2. Epub 2023 Apr 3. Eur J Clin Pharmacol. 2023. PMID: 37010535
-
Effect of different types and dosages of statins on plasma lipoprotein(a) levels: A network meta-analysis.Pharmacol Res. 2021 Jan;163:105275. doi: 10.1016/j.phrs.2020.105275. Epub 2020 Nov 7. Pharmacol Res. 2021. PMID: 33166736 Review.
-
Association between Statins Types with Incidence of Liver Cancer: An Updated Meta-analysis.Curr Med Chem. 2024;31(6):762-775. doi: 10.2174/0929867330666230701000400. Curr Med Chem. 2024. PMID: 37393552 Free PMC article.
-
Associations between statins and adverse events in secondary prevention of cardiovascular disease: Pairwise, network, and dose-response meta-analyses of 47 randomized controlled trials.Front Cardiovasc Med. 2022 Aug 25;9:929020. doi: 10.3389/fcvm.2022.929020. eCollection 2022. Front Cardiovasc Med. 2022. PMID: 36093163 Free PMC article.
Cited by
-
On-Target Low-Density Lipoprotein Cholesterol in Adults with Diabetes Not at High Cardiovascular Disease Risk Predicts Greater Mortality, Independent of Early Deaths or Frailty.J Clin Med. 2024 Dec 16;13(24):7667. doi: 10.3390/jcm13247667. J Clin Med. 2024. PMID: 39768591 Free PMC article.
-
Influence of Statin Therapy on the Incidence of Cardiovascular Events, Cancer, and All-Cause Mortality in People Living With HIV: A Meta-Analysis.Front Med (Lausanne). 2021 Nov 8;8:769740. doi: 10.3389/fmed.2021.769740. eCollection 2021. Front Med (Lausanne). 2021. PMID: 34820402 Free PMC article.
-
The Effect of Statins in Cancer Risk Reduction in Patients on Dialysis: A Population-Based Case-Control Study.J Clin Med. 2021 Nov 28;10(23):5602. doi: 10.3390/jcm10235602. J Clin Med. 2021. PMID: 34884304 Free PMC article.
-
Statin Type and Cancer Outcomes in Patients with Diabetes Type 2 and Solid Tumors.J Res Pharm Pract. 2021 May 13;10(1):50-56. doi: 10.4103/jrpp.JRPP_21_3. eCollection 2021 Jan-Mar. J Res Pharm Pract. 2021. PMID: 34295853 Free PMC article.
-
New drugs are not enough‑drug repositioning in oncology: An update.Int J Oncol. 2020 Mar;56(3):651-684. doi: 10.3892/ijo.2020.4966. Epub 2020 Jan 20. Int J Oncol. 2020. PMID: 32124955 Free PMC article. Review.
References
Publication types
LinkOut - more resources
Full Text Sources
Other Literature Sources
