. 2018 Sep 11:8:374.
doi: 10.3389/fonc.2018.00374. eCollection 2018.

Prognostic Genes of Breast Cancer Identified by Gene Co-expression Network Analysis

Affiliations

Prognostic Genes of Breast Cancer Identified by Gene Co-expression Network Analysis

Jianing Tang et al. Front Oncol. .

Abstract

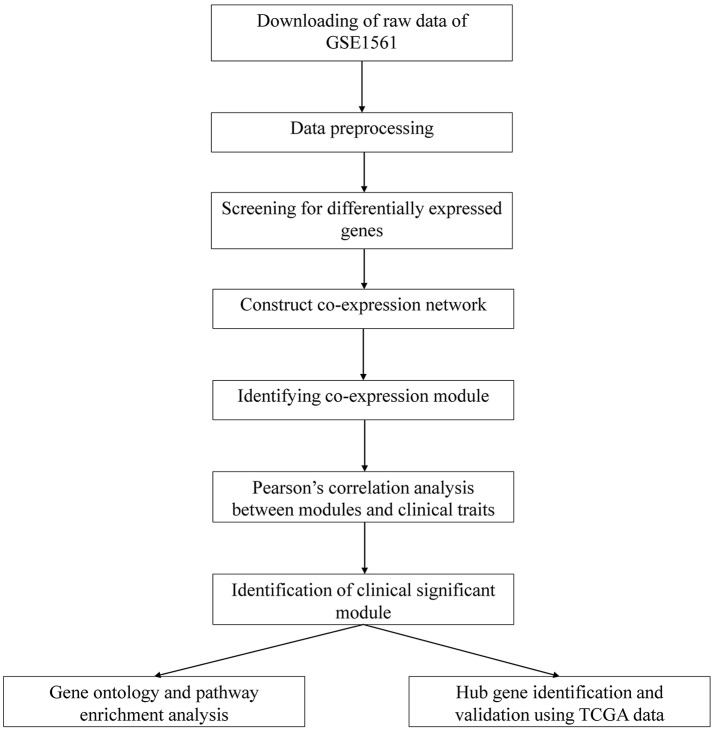
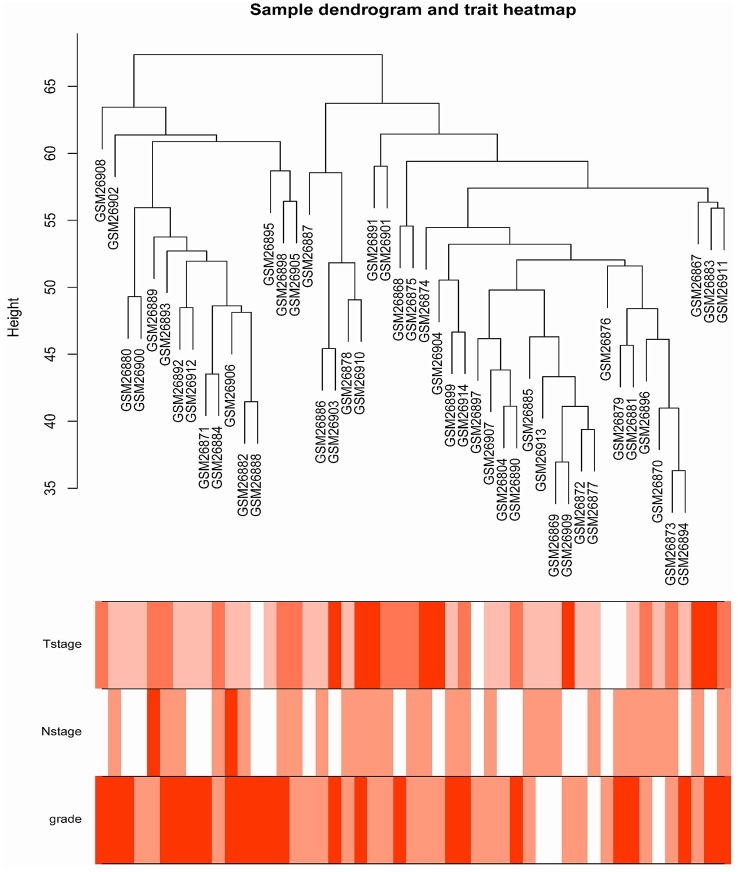
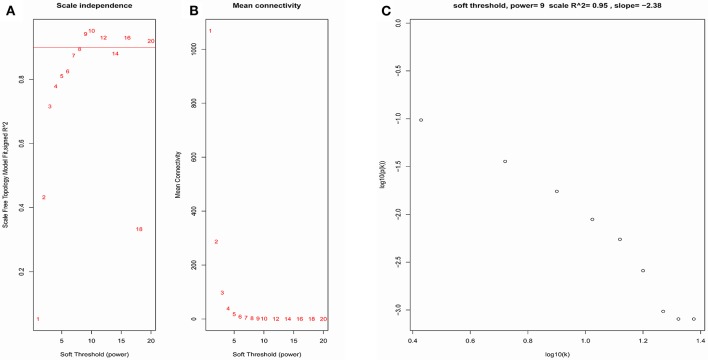
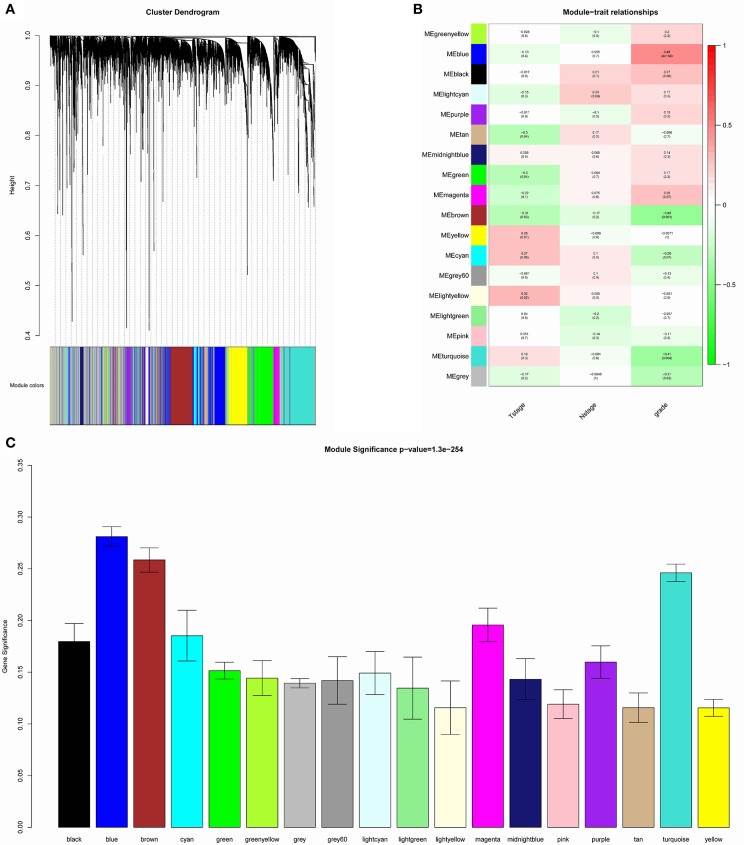
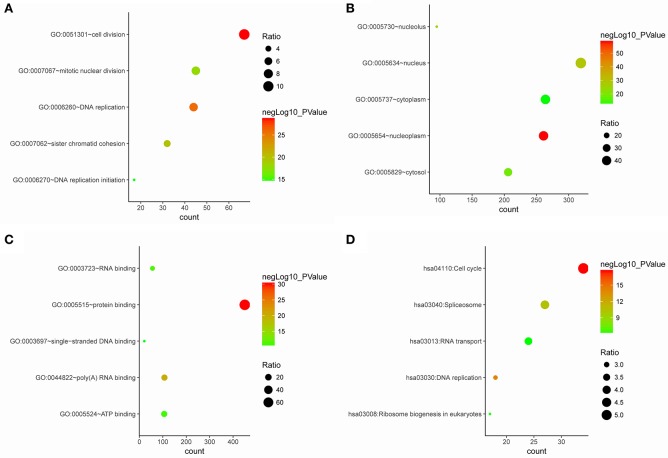
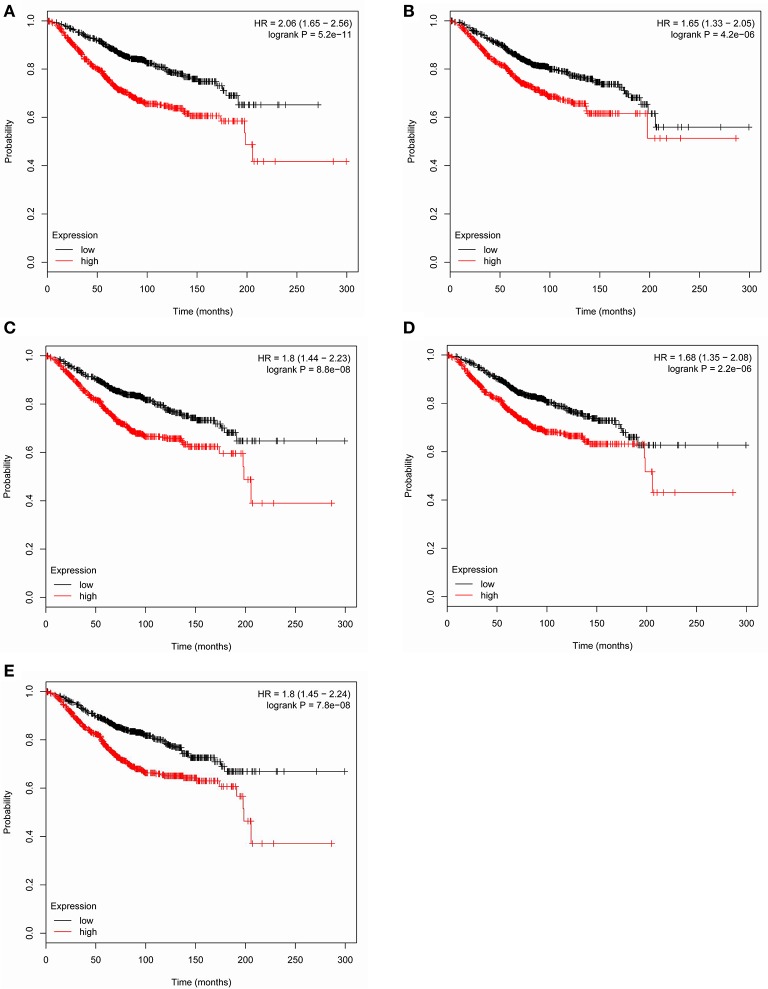
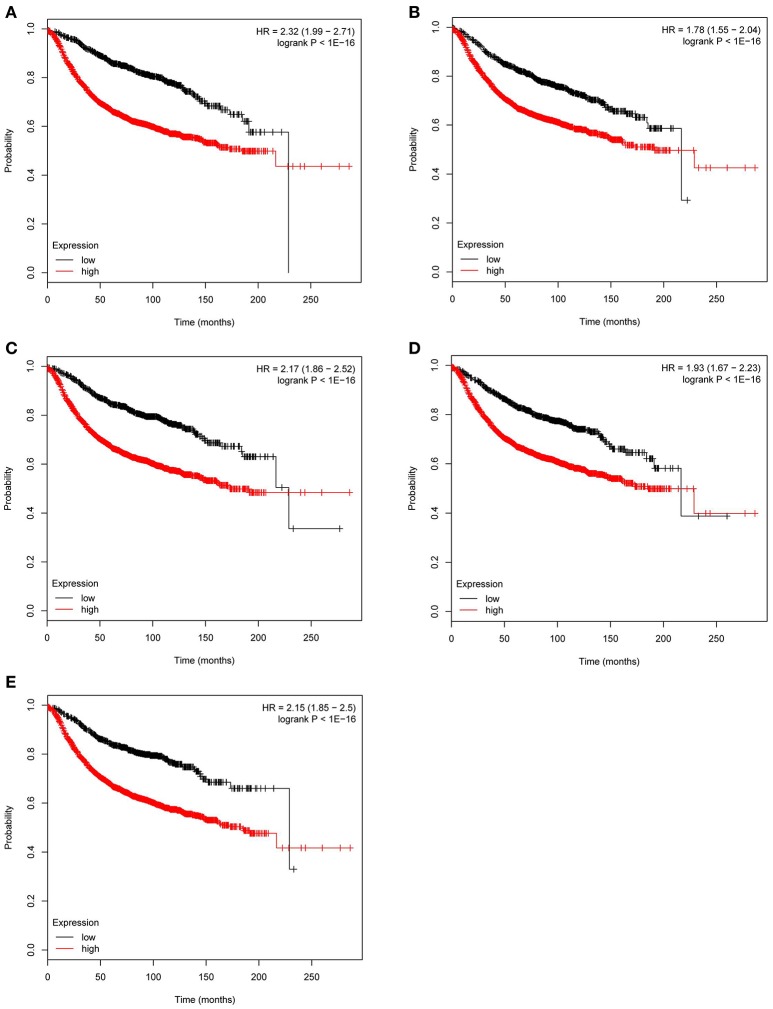
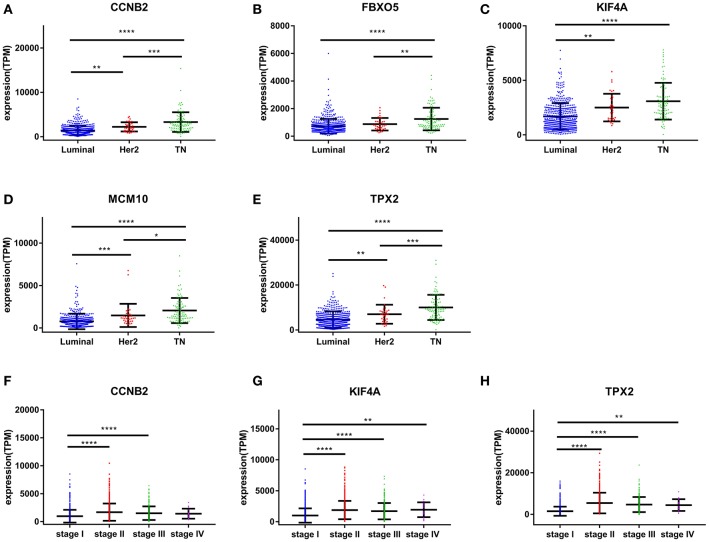
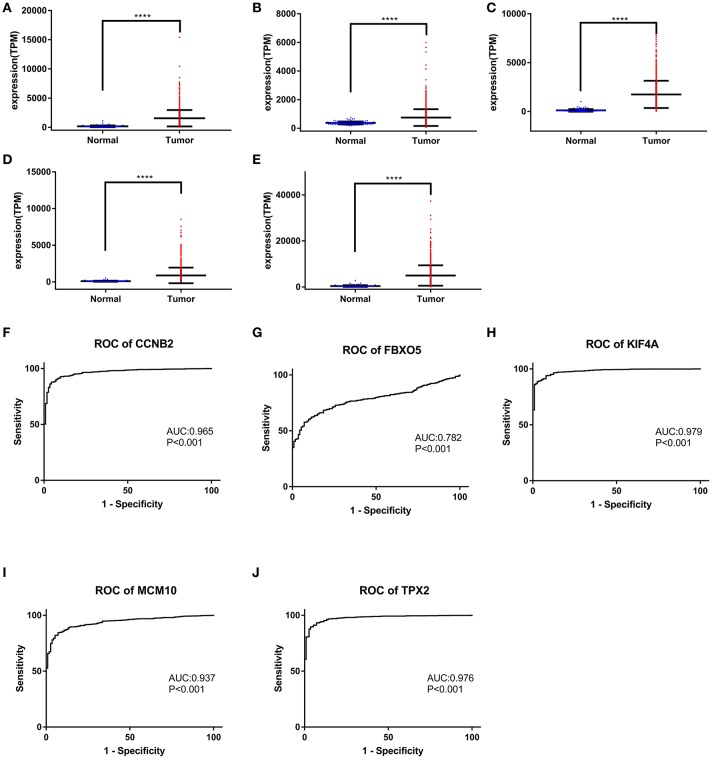
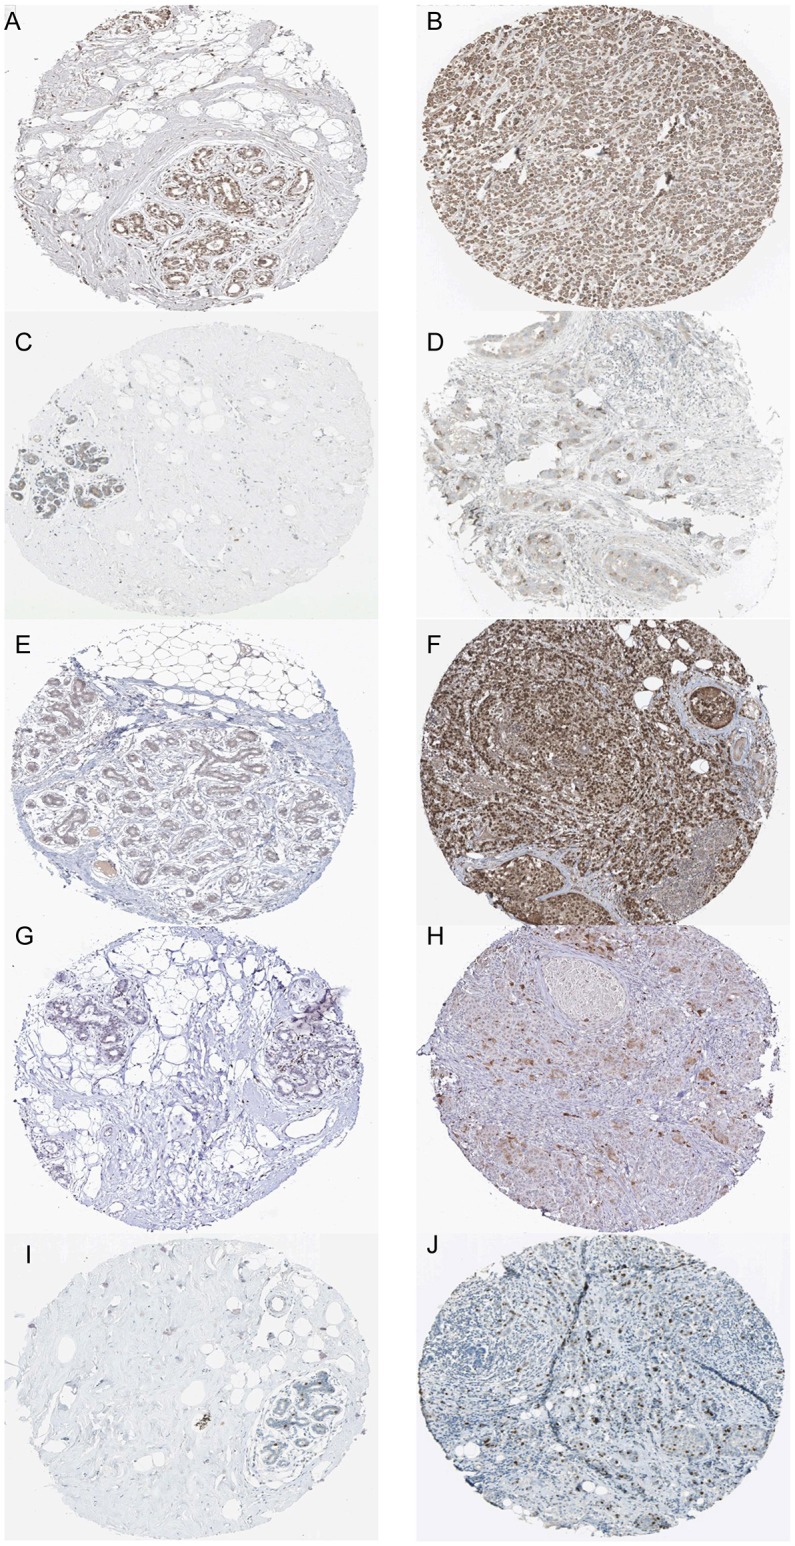
Breast cancer is one of the most common malignancies. The molecular mechanisms of its pathogenesis are still to be investigated. The aim of this study was to identify the potential genes associated with the progression of breast cancer. Weighted gene co-expression network analysis (WGCNA) was used to construct free-scale gene co-expression networks to explore the associations between gene sets and clinical features, and to identify candidate biomarkers. The gene expression profiles of GSE1561 were selected from the Gene Expression Omnibus (GEO) database. RNA-seq data and clinical information of breast cancer from TCGA were used for validation. A total of 18 modules were identified via the average linkage hierarchical clustering. In the significant module (R2 = 0.48), 42 network hub genes were identified. Based on the Cancer Genome Atlas (TCGA) data, 5 hub genes (CCNB2, FBXO5, KIF4A, MCM10, and TPX2) were correlated with poor prognosis. Receiver operating characteristic (ROC) curve validated that the mRNA levels of these 5 genes exhibited excellent diagnostic efficiency for normal and tumor tissues. In addition, the protein levels of these 5 genes were also significantly higher in tumor tissues compared with normal tissues. Among them, CCNB2, KIF4A, and TPX2 were further upregulated in advanced tumor stage. In conclusion, 5 candidate biomarkers were identified for further basic and clinical research on breast cancer with co-expression network analysis.

Keywords: GEO; TCGA; breast cancer; prognosis; weighted gene co-expression network analysis (WGCNA).


Figures

Figure 1
Figure 1
Flow chart of data preparation, processing, analysis, and validation.
Figure 2
Figure 2
Clustering dendrogram of 49 samples.
Figure 3
Figure 3
Determination of soft-thresholding power in the WGCNA. (A) Analysis of the scale-free fit index for various soft-thresholding powers (β). (B) Analysis of the mean connectivity for various soft-thresholding powers. (C) Checking the scale free topology when β = 9.
Figure 4
Figure 4
Identification of modules associated with the clinical traits of breast cancer. (A) Dendrogram of all differentially expressed genes clustered based on a dissimilarity measure (1-TOM). (B) Heatmap of the correlation between module eigengenes and clinical traits of breast cancer. (C) Distribution of average gene significance and errors in the modules associated with tumor grades of breast cancer.
Figure 5
Figure 5
Gene ontology and pathway enrichment analysis of blue module genes. (A) Biological process analysis. (B) Cellular component analysis. (C) Molecular function analysis. (D) KEGG pathway analysis.
Figure 6
Figure 6
Overall survival of the five hub genes in breast cancer based on Kaplan Meier-plotter. The patients were stratified into high-level group and low-level group according to median expression. (A) CCNB2. (B) FBXO5. (C) KIF4A. (D) MCM10. (E) TPX2.
Figure 7
Figure 7
Relapse free survival analysis of the five hub genes in breast cancer based on Kaplan Meier-plotter. The patients were stratified into high-level group and low-level group according to median expression (A) CCNB2. (B) FBXO5. (C) KIF4A. (D) MCM10. (E) TPX2.
Figure 8
Figure 8
Validation of CCNB2, FBXO5, KIF4A, MCM10, and TPX2. (A) The correlation of CCNB2 (A), FBXO5 (B), KIF4A (C), MCM10 (D), and TPX2 (E) expression with breast cancer molecular subtypes. (F) The correlation of CCNB2 expression with pathological stage. (G) The correlation of KIF4A expression with pathological stage. (H) The correlation of TPX2 expression with pathological stage.*P < 0.05; **P < 0.01; ***P < 0.001; ****P < 0.0001. One-way analysis of variance (ANOVA) was used to evaluate the statistical significance of differences.
Figure 9
Figure 9
Gene expression levels of CCNB2, FBXO5, KIF4A, MCM10, and TPX2 between normal breast and tumor samples. The mRNA levels of CCNB2 (A), CCNB2 (B), FBXO5 (C), KIF4A (D), and TPX2 (E). ROC curve of CCNB2 (F), FBXO5 (G), KIF4A (H), MCM10 (I), and TPX2 (J). (A–E) *P < 0.05; **P < 0.01; ***P < 0.001; ****P < 0.0001. Two-tailed Student's t-tests was used to evaluate the statistical significance of differences.
Figure 10
Figure 10
Immunohistochemistry of the five hub genes based on the Human Protein Atlas. (A) Protein levels of FBXO5 in normal tissue (staining: medium; intensity: moderate; quantity: >75%). (B) Protein levels of FBXO5 in tumor tissue (staining: high; intensity: strong; quantity: >75%). (C) Protein levels of CCNB2 in normal tissue (staining: low; intensity: moderate; quantity: <25%). (D) Protein levels of CCNB2 in tumor tissue (staining: medium; intensity: strong; quantity: <25%). (E) Protein levels of KIF4A in normal tissue (staining: low; intensity: weak; quantity: 25–75%). (F) Protein levels of KIF4A in tumor tissue (staining: high; intensity: strong; quantity: >75%). (G) Proteins level of MCM10 in normal tissue (staining: not detected; intensity: weak; quantity: <25%). (H) Protein levels of MCM10 in tumor tissue (staining: low; intensity: moderate; quantity: <25%). (I) Protein levels of TPX2 in normal tissue (staining: medium; intensity: strong; quantity: <25%). (J) Protein levels of TPX2 in tumor tissue (staining: medium; intensity: strong; quantity: <25%).

Similar articles

Cited by

References

    1. Jemal A, Bray F, Center MM, Ferlay J, Ward E, Forman D. Global cancer statistics. CA Cancer J Clin. (2011) 61:69–90. 10.3322/caac.20107 - DOI - PubMed
    1. Shi H, Zhang L, Qu Y, Hou L, Wang L, Zheng M. Prognostic genes of breast cancer revealed by gene co-expression network analysis. Oncol Lett. (2017) 14:4535–42. 10.3892/ol.2017.6779 - DOI - PMC - PubMed
    1. Redig AJ, McAllister SS. Breast cancer as a systemic disease: a view of metastasis. J Intern Med. (2013) 274:113–26. 10.1111/joim.12084 - DOI - PMC - PubMed
    1. McAllister SS, Gifford AM, Greiner AL, Kelleher SP, Saelzler MP, Ince TA, et al. . Systemic endocrine instigation of indolent tumor growth requires osteopontin. Cell (2008) 133:994–1005. 10.1016/j.cell.2008.04.045 - DOI - PMC - PubMed
    1. Zhang Y, Lv F, Yang Y, Qian X, Lang R, Fan Y, et al. . Clinicopathological features and prognosis of metaplastic breast carcinoma: experience of a major Chinese cancer center. PLoS ONE (2015) 10:e0131409. 10.1371/journal.pone.0131409 - DOI - PMC - PubMed