. 2018 Sep 11:5:84.
doi: 10.3389/fnut.2018.00084. eCollection 2018.

Effects of Graded Whey Supplementation During Extreme-Volume Resistance Training

Affiliations

Effects of Graded Whey Supplementation During Extreme-Volume Resistance Training

Cody T Haun et al. Front Nutr. .

Abstract

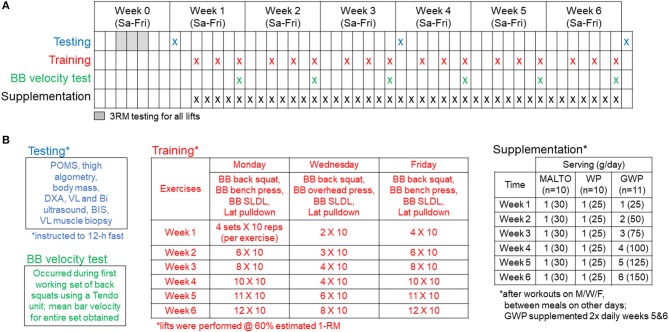
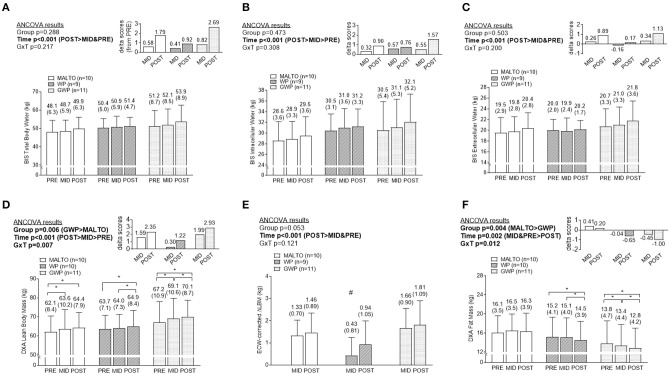
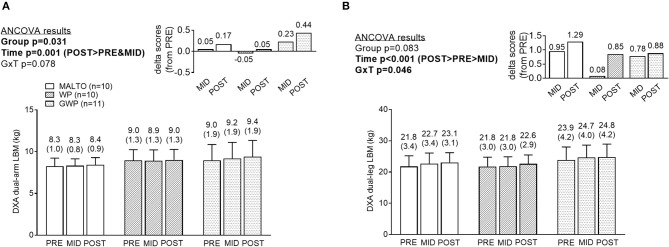
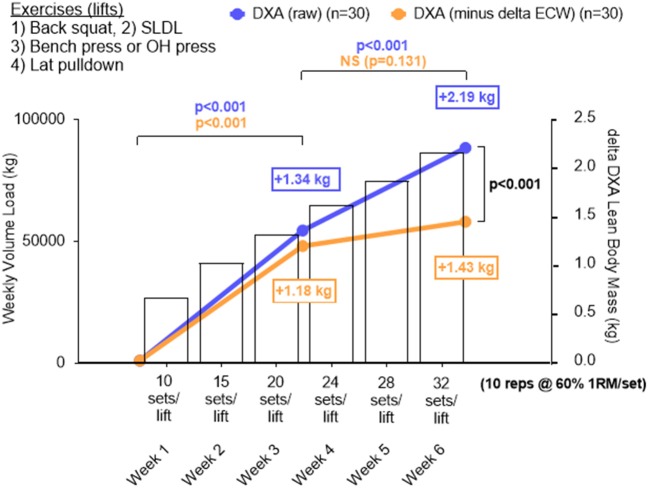
We examined hypertrophic outcomes of weekly graded whey protein dosing (GWP) vs. whey protein (WP) or maltodextrin (MALTO) dosed once daily during 6 weeks of high-volume resistance training (RT). College-aged resistance-trained males (training age = 5 ± 3 years; mean ± SD) performed 6 weeks of RT wherein frequency was 3 d/week and each session involved 2 upper- and 2 lower-body exercises (10 repetitions/set). Volume increased from 10 sets/exercise (week 1) to 32 sets/exercise (week 6), which is the highest volume investigated in this timeframe. Participants were assigned to WP (25 g/d; n = 10), MALTO (30 g/d; n = 10), or GWP (25-150 g/d from weeks 1-6; n = 11), and supplementation occurred throughout training. Dual-energy x-ray absorptiometry (DXA), vastus lateralis (VL), and biceps brachii ultrasounds for muscle thicknesses, and bioelectrical impedance spectroscopy (BIS) were performed prior to training (PRE) and after weeks 3 (MID) and 6 (POST). VL biopsies were also collected for immunohistochemical staining. The GWP group experienced the greatest PRE to POST reduction in DXA fat mass (FM) (-1.00 kg, p < 0.05), and a robust increase in DXA fat- and bone-free mass [termed lean body mass (LBM) throughout] (+2.93 kg, p < 0.05). However, the MALTO group also experienced a PRE to POST increase in DXA LBM (+2.35 kg, p < 0.05), and the GWP and MALTO groups experienced similar PRE to POST increases in type II muscle fiber cross-sectional area (~+300 μm2). When examining the effects of training on LBM increases (ΔLBM) in all participants combined, PRE to MID (+1.34 kg, p < 0.001) and MID to POST (+0.85 kg, p < 0.001) increases were observed. However, when adjusting ΔLBM for extracellular water (ECW) changes, intending to remove the confounder of edema, a significant increase was observed from PRE to MID (+1.18 kg, p < 0.001) but not MID to POST (+0.25 kg; p = 0.131). Based upon DXA data, GWP supplementation may be a viable strategy to improve body composition during high-volume RT. However, large LBM increases observed in the MALTO group preclude us from suggesting that GWP supplementation is clearly superior in facilitating skeletal muscle hypertrophy. With regard to the implemented RT program, ECW-corrected ΔLBM gains were largely dampened, but still positive, in resistance-trained participants when RT exceeded ~20 sets/exercise/wk.

Keywords: adaptation; graded whey protein; muscle hypertrophy; recovery; resistance training.


Figures

Figure 1
Figure 1
Study design. Panel (A) outlines testing, training, and supplementation days. Panel (B) (upper left inset) describes the testing battery which included (in order) a profile and mood state questionnaire (POMS), outer thigh pain assessment using algometry, body mass assessment, and whole-body dual x-ray absorptiometry (DXA) scan, a vastus lateralis (VL) and biceps (Bi) ultrasound, total body water assessment using bioelectrical impedance spectroscopy (BIS), and a VL muscle biopsy. Panel (B) (lower left inset) describes the BB squat velocity test that occurred during the first set of barbell squats every Friday from weeks 1 to 6 of training. Panel (B) (middle inset) outlines the supervised training regimen described in greater detail in the methods. Panel (B) (right inset) outlines the supplementation regimen described in greater detail in the methods.
Figure 2
Figure 2
Differences in training volume, back squat lifting velocity, thigh soreness, and total mood disturbance among supplementation groups. Only a significant time effect was observed for training volume with values increasing on a weekly basis (A). No main effects or group × interaction was observed for back squat lifting velocity (B). Only a significant time effect was observed for thigh pressure-to-pain values (lower values indicates greater soreness) (C). Only a significant time effect was observed for profile of mood state (POMS) total mood disturbance (TMD) (greater values indicates more mood disturbance) (D). All data are presented as means ± standard deviation values, and values in (C,D) are indicated above each bar; values for panels a and b are not indicated due to space constraints but are provided in the raw data file. Additionally, each data panel has delta values from PRE included as inset data. MALTO, maltodextrin group; WP, standardized whey protein group; GWP, graded whey protein group.
Figure 3
Figure 3
Body composition differences between supplementation groups. Only significant time effects were observed for total body water content (A) assessed via bioelectrical impedance spectroscopy (BIS), BIS intracellular water content (B), and BIS extracellular water content (C). For all of these metrics, POST values were significantly greater than PRE and MID values. Significant main group and time effects as well as a group × time interaction were observed for lean body mass (D) assessed via dual x-ray absorptiometry (DXA). Post-hoc tests indicated lean body mass increased within groups from PRE to MID (MALTO and GWP; *p < 0.05), MID to POST (WP abd GWP; *p < 0.05), and PRE to POST (all groups; *p < 0.05). However, no significant between-group differences existed at each level of time. A significant main time effect as well as a group × time interaction was observed for change scores in DXA lean body mass corrected for change scores in ECW (E). Post-hoc tests indicated this metric increased within groups from PRE to MID (MALTO and GWP; *p < 0.05), and PRE to POST (all groups; *p < 0.05). Additionally, MID WP was significantly lower than MID GWP (#p = 0.004). Significant main group and time effects as well as a group × time interaction were observed for fat mass (F) assessed via DXA. Post-hoc tests indicated fat mass decreased within groups from PRE to MID (GWP; *p < 0.05), MID to POST (WP and GWP; *p < 0.05), and PRE to POST (WP and GWP; *p < 0.05). However, no significant between-group differences existed at any level of time. All data are presented as means ± standard deviation values, and values are indicated above each bar. Additionally, each data panel (except E) has delta values from PRE included as inset data. MALTO, maltodextrin group; WP, standardized whey protein group; GWP, graded whey protein group.
Figure 4
Figure 4
Segmental DXA data differences between supplementation groups. Significant time effects were observed for DXA dual-arm LBM (A) and DXA dual-leg LBM (B), with MID, and/or POST values being greater than PRE. While a significant group × time interaction was observed for DXA dual-leg LBM, no significant between-group differences at each time point were observed. All data are presented as means ± standard deviation values, and values are indicated above each bar. Additionally, each data panel has delta values from PRE included as inset data. MALTO, maltodextrin group; WP, standardized whey protein group; GWP, graded whey protein group.
Figure 5
Figure 5
Muscle thickness and VL fiber size differences between supplementation groups. Only a significant time effect was observed for biceps thickness (A) assessed via ultrasound with MID values being greater than PRE- and POST values. Only a significant time effect was observed for VL thickness (B) assessed via ultrasound with MID values being less than POST values. Panel (C) provides representative images of ultrasound scans from the same participants. Only significant time effects were observed for total fiber cross sectional area (fCSA) (D), type I fCSA (E), and type II fCSA (F) assessed via histology with MID values being less than PRE and POST values. Panel (G) provides representative 10x objective histology images from VL biopsies of the same participant. All data are presented as means ± standard deviation values, and values are indicated above each bar. Additionally, each data panel has delta values from PRE included as inset data. MALTO, maltodextrin group; WP, standardized whey protein group; GWP, graded whey protein group.
Figure 6
Figure 6
Change in DXA lean body mass plotted against increases in training volume for all participants. Data in this figure include DXA lean body mass changes (blue line graph), changes in LBM by subtracting changes in extracellular water (i.e., ECW-corrected ΔLBM), and training volume (bar data) from all 30 participants who underwent DXA and BIS testing. A significant increase in LBM from PRE to MID (p < 0.001) and MID to POST (p < 0.001) was observed in DXA LBM and this was proportional to the increase in training volume over time. When considering ECW-corrected ΔLBM changes, a similar increase occurred across groups from PRE to MID (p < 0.001), but the increase from MID to POST was not significant (p = 0.131). Additionally, POST DXA LBM was significantly higher than POST ECW-corrected ΔLBM. All data is presented as mean changes, and bars depicting standard deviation were left off of these panels in order to simplify the figure.

References

    1. Burd NA, Holwerda AM, Selby KC, West DW, Staples AW, Cain NE, et al. . Resistance exercise volume affects myofibrillar protein synthesis and anabolic signalling molecule phosphorylation in young men. J Physiol. (2010) 588:3119–30. 10.1113/jphysiol.2010.192856 - DOI - PMC - PubMed
    1. Atherton PJ, Smith K. Muscle protein synthesis in response to nutrition and exercise. J Physiol. (2012) 590:1049–57. 10.1113/jphysiol.2011.225003 - DOI - PMC - PubMed
    1. Witard OC, Jackman SR, Breen L, Smith K, Selby A, Tipton KD. Myofibrillar muscle protein synthesis rates subsequent to a meal in response to increasing doses of whey protein at rest and after resistance exercise. Am J Clin Nutr. (2014) 99:86–95. 10.3945/ajcn.112.055517 - DOI - PubMed
    1. Macnaughton LS, Wardle SL, Witard OC, Mcglory C, Hamilton DL, Jeromson S, et al. . The response of muscle protein synthesis following whole-body resistance exercise is greater following 40 g than 20 g of ingested whey protein. Physiol Rep. (2016) 4: e12893. 10.14814/phy2.12893 - DOI - PMC - PubMed
    1. Morton RW, Murphy KT, Mckellar SR, Schoenfeld BJ, Henselmans M, Helms E, et al. . A systematic review, meta-analysis and meta-regression of the effect of protein supplementation on resistance training-induced gains in muscle mass and strength in healthy adults. Br J Sports Med. (2018) 52:376–84. 10.1136/bjsports-2017-097608 - DOI - PMC - PubMed

LinkOut - more resources