. 2018 Sep 24;5(5):ENEURO.0273-18.2018.
doi: 10.1523/ENEURO.0273-18.2018. eCollection 2018 Sep-Oct.

Dynamic and Sex-Specific Changes in Gonadotropin-Releasing Hormone Neuron Activity and Excitability in a Mouse Model of Temporal Lobe Epilepsy

Affiliations

Dynamic and Sex-Specific Changes in Gonadotropin-Releasing Hormone Neuron Activity and Excitability in a Mouse Model of Temporal Lobe Epilepsy

Jiang Li et al. eNeuro. .

Abstract

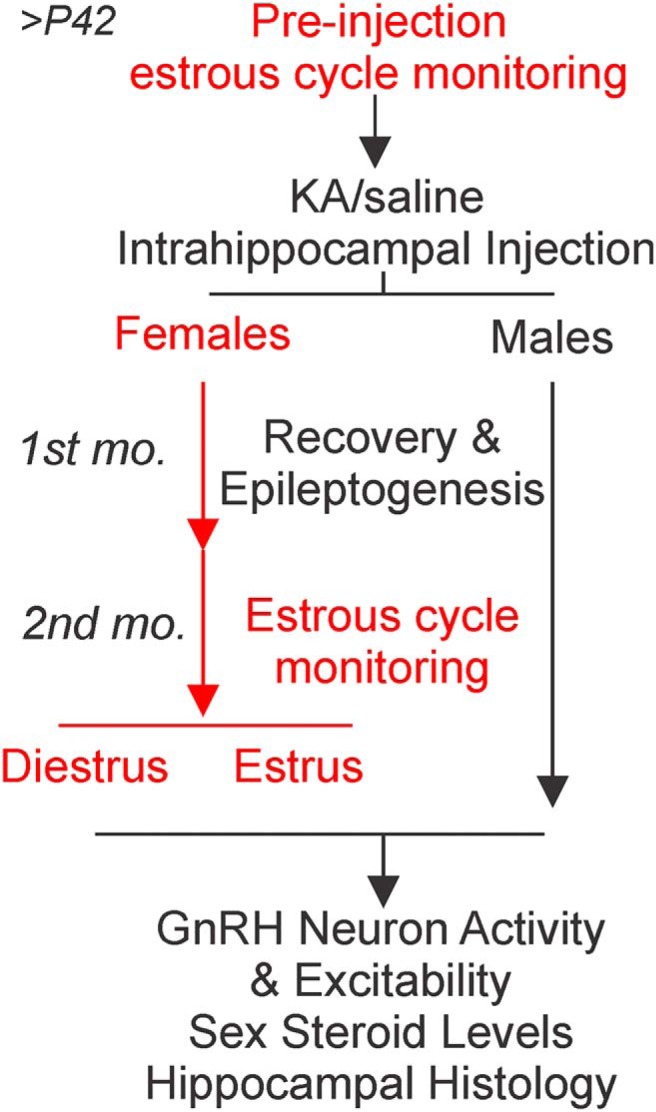
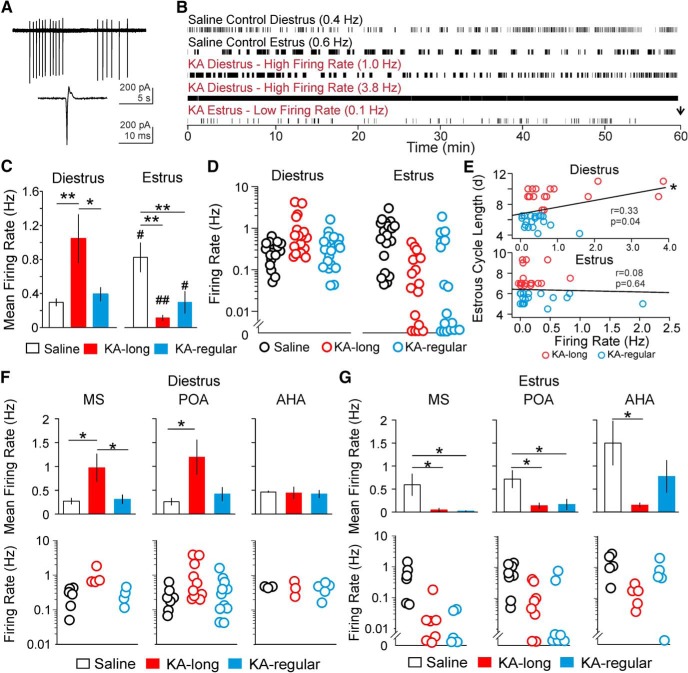
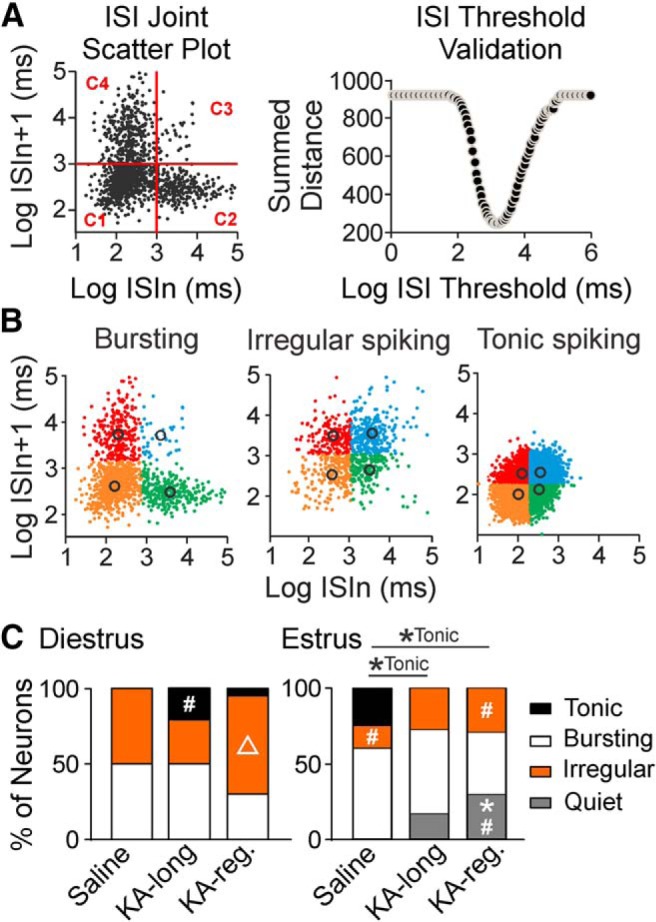
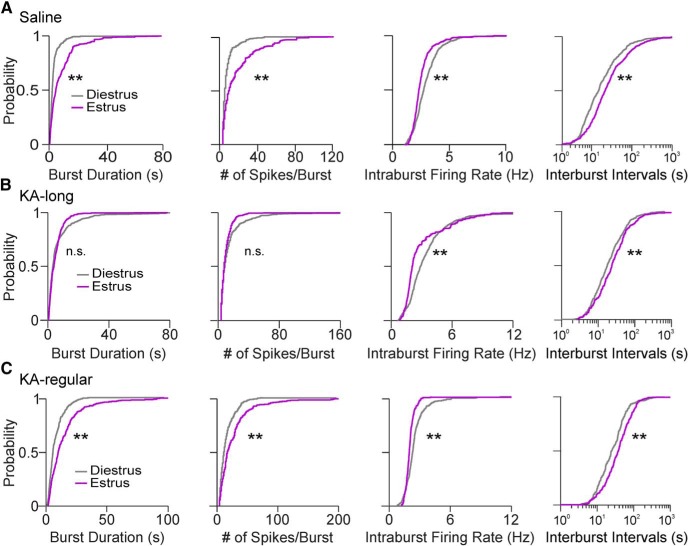
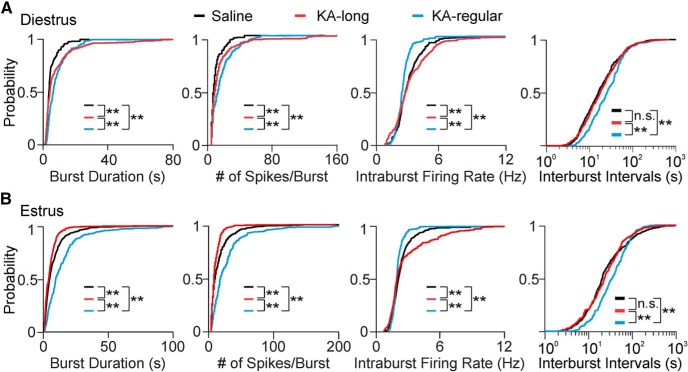
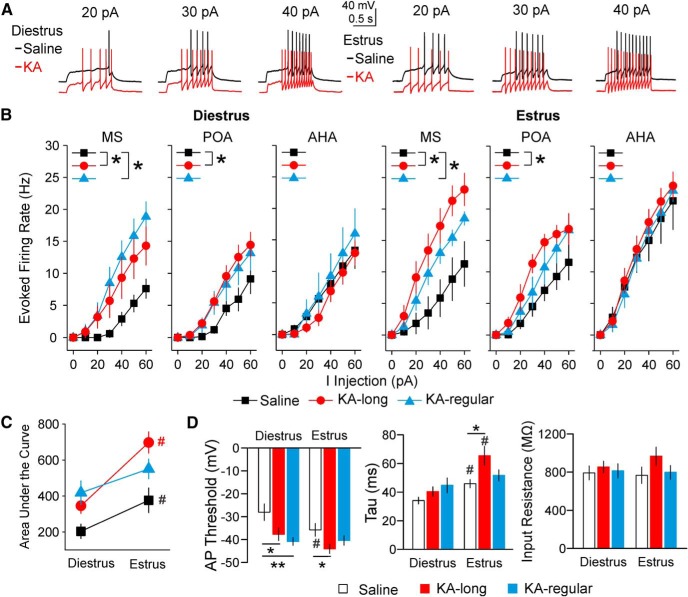
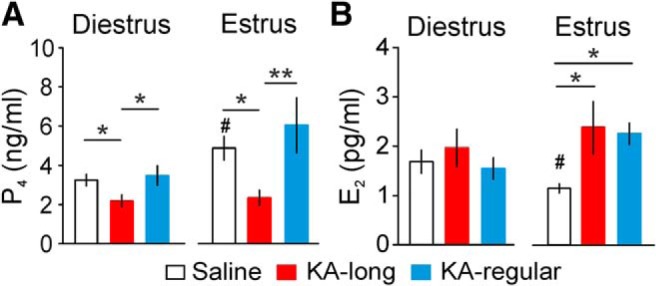
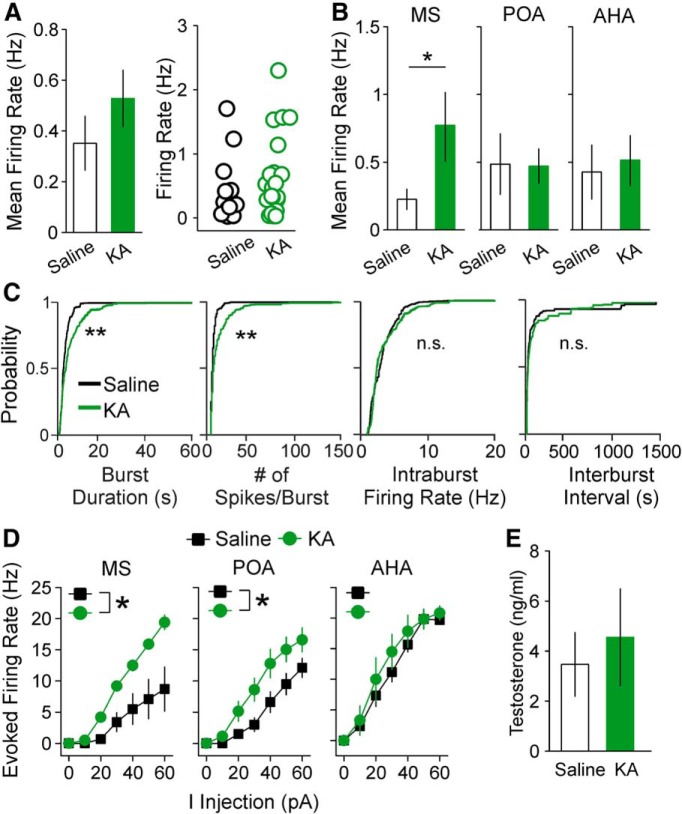
Reproductive endocrine disorders are prominent comorbidities of temporal lobe epilepsy (TLE) in both men and women. The neural mechanisms underlying these comorbidities remain unclear, but hypothalamic gonadotropin-releasing hormone (GnRH) neurons may be involved. Here, we report the first direct demonstrations of aberrant GnRH neuron function in an animal model of epilepsy. Recordings of GnRH neuron firing and excitability were made in acute mouse brain slices prepared two months after intrahippocampal injection of kainate (KA) or control saline, a well-established TLE model in which most females develop comorbid estrous cycle disruption. GnRH neurons from control females showed elevated firing and excitability on estrus compared with diestrus. By contrast, cells from KA-injected females that developed prolonged, disrupted estrous cycles (KA-long) showed the reverse pattern. Firing rates of cells from KA-injected females that maintained regular cycles (KA-regular) were not different from controls on diestrus, but were reduced on estrus. In KA-injected males, only GnRH neurons in the medial septum displayed elevated firing. In contrast to the diestrus versus estrus and sex-specific changes in firing, GnRH neuron intrinsic excitability was elevated in all KA-injected groups, indicating a role for afferent synaptic and neuromodulatory inputs in shaping overall changes in firing activity. Furthermore, KA-injected females showed cycle-stage-specific changes in circulating sex steroids on diestrus and estrus that also differed between KA-long and KA-regular groups. Together, these findings reveal that the effects of epilepsy on the neural control of reproduction are dynamic across the estrous cycle, distinct in association with comorbid estrous cycle disruption severity, and sex-specific.

Keywords: GnRH; excitability; hormone; patch clamp electrophysiology; temporal lobe epilepsy.


Figures

Figure 1.
Figure 1.
Experimental design and timeline illustrating paradigm of test groups, procedures, and experimental time points. Procedures exclusive to experiments in females are marked in red.
Figure 2.
Figure 2.
Verification of KA injection targeting. A, Example cresyl violet staining from a KA-regular female with marked granule cell dispersion ipsilateral to the injection, and intact hippocampus contralateral to the injection. B, Cresyl violet (top) and GFAP/DAPI staining (bottom) from a KA-regular female. Note the strong GFAP immunoreactivity in the injected hippocampus, despite absence of major pathology observed in cresyl violet staining of adjacent sections. GFAP, green; DAPI, blue. Left, Ipsilateral to the injection. C, Example GFAP staining in tissue from a saline-injected mouse. Scale bar: 500 μm. Black arrow, hippocampal sclerosis detected by cresyl violet stain; white arrows, gliosis in CA and dentate gyrus detected by GFAP staining.
Figure 3.
Figure 3.
Diestrus versus estrus shifts in GnRH neuron mean firing rate are compromised in the intrahippocampal KA mouse model of TLE. A, Example raw traces of bursts (top) and individual (bottom) action currents detected in loose patch recordings. B, Representative raster plots of activity in GnRH neurons from control and KA-injected females. The black arrow marks the end of recording. The mean firing rate of each cell is given in parentheses. C, Mean ± SEM for GnRH neuron firing rate in control (open bars), KA-long (red bars), and KA-regular (blue bars) groups. KA-injected females are divided into KA-long and KA-regular groups based on their estrous cycle length (KA-long ≥ 7 d, KA-regular 4–6 d). Cells were recorded on diestrus (left) or estrus (right). D, Firing rates in individual cells, plotted on a logarithmic scale to show the full range. E, Correlation analyses between GnRH neuron firing rate and estrous cycle length in KA-injected females performed with data combined from KA-long (red circles) and KA-regular (blue circles) groups. Black line, line of best fit for all points. F, G, Comparison of GnRH neuron firing rate between controls, KA-long, and KA-regular groups based on anatomic location of somata for cells recorded on diestrus (F) or estrus (G). Data are shown as group mean firing rates (top, mean ± SEM) and individual neuron firing rates (bottom); *p < 0.05, **p < 0.01 for comparisons between saline, KA-long, and KA-regular females by Kruskal–Wallis with Dunn’s post hoc tests; #p < 0.05, ##p < 0.01 for comparisons between diestrus and estrus within groups by t tests or Mann–Whitney tests. In scatter plots of individual neuron firing rate, neurons plotted below y = 0.01 showed firing rates ≥0 Hz and below 0.01 Hz.
Figure 4.
Figure 4.
GnRH neuron firing patterns are altered in KA-injected female mice on both diestrus and estrus. A, B, Examples of burst detection and firing pattern categorization. A, left, Example ISI joint scatter plot with a randomly selected candidate burst ISI threshold value (red line). The four quadrants divide all data into four clusters: C1, C2, C3, and C4. Right, Example ISI threshold validation shows the summed distance for each candidate burst ISI threshold value. The summed distance is calculated by the summation of squared distance between every point and its corresponding cluster centroid. The candidate value with the smallest summed distance is chosen as the optimal burst ISI threshold. B, Examples of scatter plots for GnRH neuron bursting (left), irregular spiking (middle), and tonic spiking (right) patterns. The different colors represent the final C1 to C4 distribution with the optimal burst ISI threshold for each cell. Black circles, individual centroids of clusters C1–C4. C, Proportion of GnRH neurons from female mice categorized into each pattern on diestrus (left) and estrus (right); *p < 0.05 for pair-wise Fisher’s exact test comparisons for indicated firing pattern between control and KA-injected groups; #p < 0.05 for comparisons for indicated firing pattern between diestrus and estrus within control and KA-injected groups. Δ, p < 0.05 for comparisons for indicated firing pattern between KA-long and KA-regular groups within the same estrous cycle stage.
Figure 5.
Figure 5.
GnRH neuron burst properties on diestrus and estrus; only neurons displaying burst spiking patterns were used for comparisons. A, Cumulative probability distributions for burst properties of GnRH neurons from control female mice on diestrus (gray traces) and estrus (purple traces). Cumulative distributions were constructed using 100 randomly selected bursts per cell. B, Burst properties from KA-long female mice. C, Burst properties from KA-regular female mice; **p < 0.0001 for comparisons by Kolmogorov–Smirnov tests. n.s., not significant. The interburst intervals are presented on logarithmic scales for better visualization of the major portion (1–99%) of the distributions.
Figure 6.
Figure 6.
Bursting GnRH neurons from KA-injected female mice show changed burst properties. A, Cumulative probability distributions for burst properties in cells displaying bursting patterns from control (black traces), KA-long (red traces), and KA-regular (blue traces) mice recorded on diestrus. Cumulative distributions were constructed using 100 randomly selected bursts per cell. B, Cumulative probability distributions for burst properties recorded on estrus; **p < 0.01 for comparisons between saline, KA-long, or KA-regular groups by pairwise Kolmogorov–Smirnov tests. n.s., not significant. The interburst intervals are presented on logarithmic scales for better visualization of the major portion (1–99%) of the distributions.
Figure 7.
Figure 7.
GnRH neuron intrinsic excitability is elevated on both diestrus and estrus in the intrahippocampal KA mouse model of TLE. A, Representative examples of evoked firing in response to depolarizing current steps in cells recorded on diestrus (left) and estrus (right). The KA traces are offset to highlight differences in spiking. All traces started from a membrane potential of approximately -73 mV, corrected for the liquid junction potential. B, Frequency-current (F-I) curves for GnRH neurons recorded on diestrus (left) or estrus (right), classified by the location of the somata of recorded neurons. Depolarizing current steps were applied in increments of 10 pA; *p < 0.05 for comparisons of area under the curve by three-way ANOVA with Fisher’s LSD. C, Mean ± SEM for area under the curve of evoked firing rate plots on diestrus and estrus in cells from control (black symbols and line), KA-long (red symbols and line), and KA-regular (blue symbols and line) mice. D, Mean ± SEM for AP threshold, membrane time constant (τ), and input resistance; *p < 0.05, **p < 0.01 by two-way ANOVA with Fisher’s LSD; #p < 0.05 for comparisons between diestrus and estrus within groups by three-way ANOVA with Fisher’s LSD.
Figure 8.
Figure 8.
Changes in circulating P4 and E2 levels on diestrus and estrus as measured two months after KA injection. A, Mean ± SEM for P4 levels on diestrus (left) and estrus (right) in control (open bars), KA-long (red bars), and KA-regular (blue bars) mice. B, Mean ± SEM for E2 levels on diestrus (left) and estrus (right); *p < 0.05 for comparisons between saline, KA-long, and KA-regular groups by one-way ANOVA and Fisher’s post hoc tests; #p < 0.05 for comparisons between estrus and diestrus within groups by t tests.
Figure 9.
Figure 9.
Impacts of KA injection on GnRH neuron mean firing rate and excitability in male mice depend on soma location. A, Mean ± SEM for mean firing rate (left) and firing rates for individual GnRH neurons (right) from males treated with saline (open bars and circles) or KA (green bars and circles). B, Mean ± SEM for mean firing rate of GnRH neurons from control and KA-injected males classified by soma location; *p < 0.05, two-sample t test. C, Cumulative probability distributions for burst duration, number of spikes per burst, intraburst firing rate, and interburst intervals in cells from control and KA-injected males; **p < 0.0001 by Kolmogorov–Smirnov tests. D, F-I curves for GnRH neurons from control and KA-injected males; *p < 0.05 for comparison of area under the curve by two-way ANOVA with Fisher’s LSD post hoc tests. E, Mean ± SEM for serum T in control and KA-injected male mice.

Similar articles

Cited by

References

    1. Amado D, Verreschi IT, Berzaghi MP, Cavalheiro EA (1987) Effects of intrahippocampal injection of kainic acid on estrous cycle in rats. Braz J Med Biol Res 20:829–832. - PubMed
    1. Amado D, Cavalheiro E, Bentivoglio M (1993) Epilepsy and hormonal regulation: the patterns of GnRH and galanin immunoreactivity in the hypothalamus of epileptic female rats. Epilepsy Res 14:149–159. - PubMed
    1. Amado D, Cavalheiro E (1998) Hormonal and gestational parameters in female rats submitted to the pilocarpine model of epilepsy. Epilepsy Res 32:266–274. 10.1016/S0920-1211(98)00057-6 - DOI - PubMed
    1. Bashour NM, Wray S (2012) Progesterone directly and rapidly inhibits GnRH neuronal activity via progesterone receptor membrane component 1. Endocrinology 153:4457–4469. 10.1210/en.2012-1122 - DOI - PMC - PubMed
    1. Bauer J, Jarre A, Klingmüller D, Elger CE (2000) Polycystic ovary syndrome in patients with focal epilepsy: a study in 93 women. Epilepsy Res 41:163–167. - PubMed

Publication types

Substances

LinkOut - more resources