

Light scattering corrections to linear dichroism spectroscopy for liposomes in shear flow using calcein fluorescence and modified Rayleigh-Gans-Debye-Mie scattering
- PMID: 30255222
- PMCID: PMC6233352
- DOI: 10.1007/s12551-018-0458-8
Light scattering corrections to linear dichroism spectroscopy for liposomes in shear flow using calcein fluorescence and modified Rayleigh-Gans-Debye-Mie scattering
Abstract
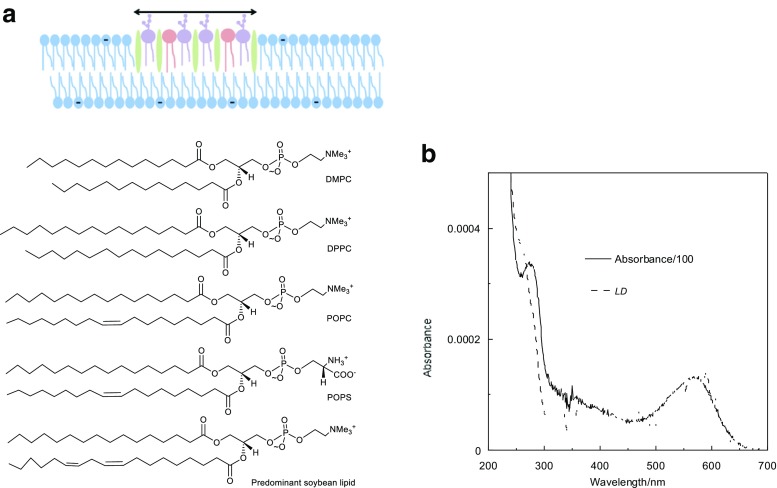
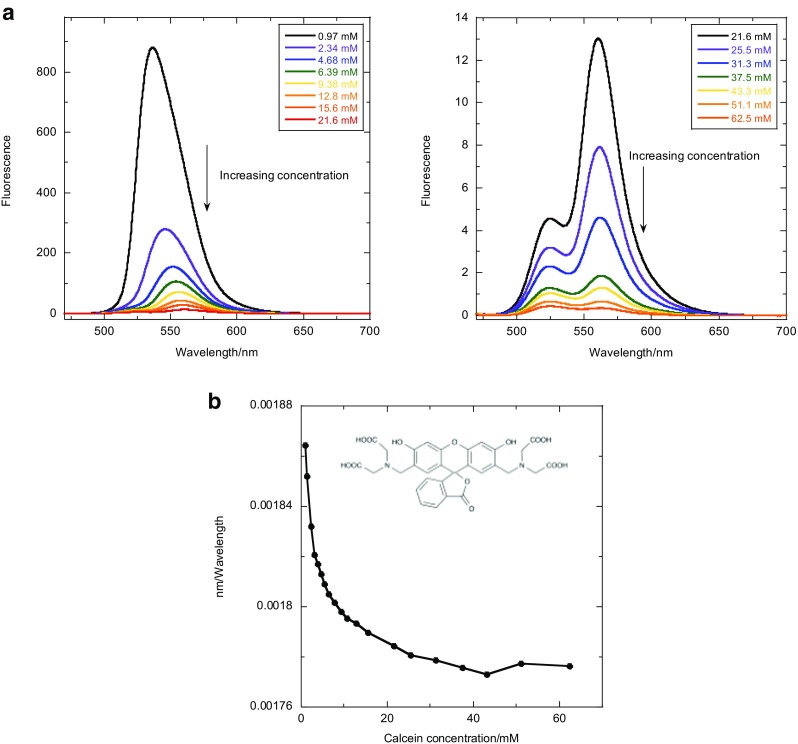
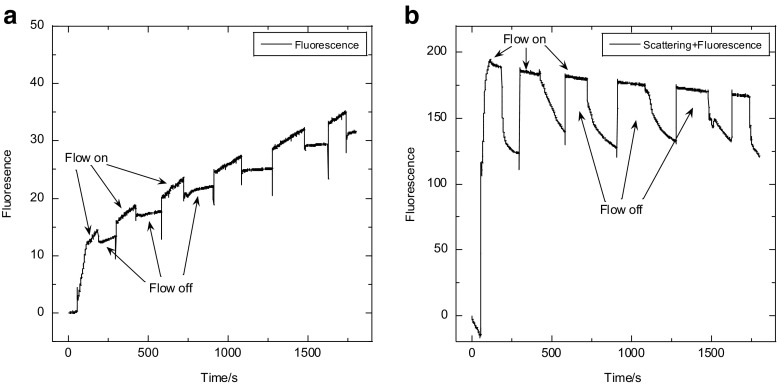
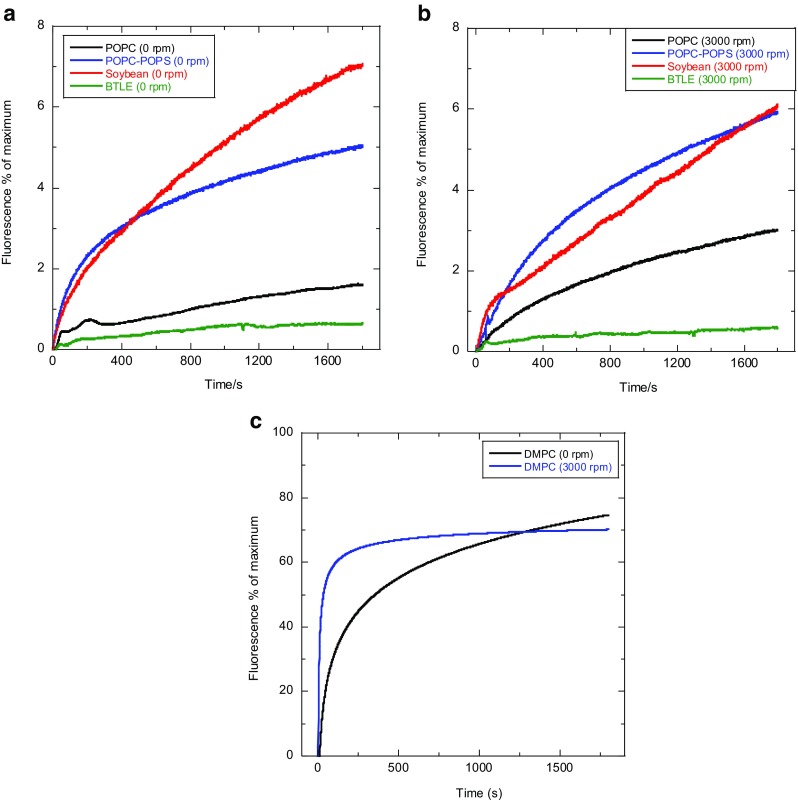
The interpretation of data from absorbance spectroscopy experiments of liposomes in flow systems is often complicated by the fact that there is currently no easy way to account for scattering artefacts. This has proved particularly problematic for linear dichroism (LD) spectroscopy, which may be used to determine binding modes of small molecules, peptides and proteins to liposomes if we can extract the absorbance signal from the combined absorbance/scattering experiment. Equations for a modified Rayleigh-Gans-Debye (RGD) approximation to the turbidity (scattering) LD spectrum are available in the literature though have not been implemented. This review summarises the literature and shows how it can be implemented. The implementation proceeds by first determining volume loss that occurs when a spherical liposome is subjected to flow. Calcein fluorescence can be used for this purpose since at high concentrations (> 60 mM) it has low intensity fluorescence with maxima at 525 and 563 nm whereas at low concentrations (<1 mM) the fluorescence intensity is enhanced and the band shifts to 536 nm. The scattering calculation process yields the average axis ratios of the distorted liposome ellipsoids and extent of orientation of the liposomes in flow. The scattering calculations require methods to estimate liposome integrity, volume loss, and orientation when subjected to shear stresses under flow.
Keywords: Mie Scattering; Rayleigh-Gans-Debye; Scattering; calcein; linear dichroism; liposomes.
Figures


Similar articles
-
Rayleigh and Rayleigh-Debye-Gans light scattering intensities and spetroturbidimetry of dispersions of unilamellar vesicles and multilamellar liposomes.J Colloid Interface Sci. 2020 Oct 15;578:471-483. doi: 10.1016/j.jcis.2020.05.085. Epub 2020 May 30. J Colloid Interface Sci. 2020. PMID: 32540549
-
Rayleigh-Debye-Gans as a model for continuous monitoring of biological particles: Part I, assessment of theoretical limits and approximations.Opt Express. 2006 Sep 18;14(19):8849-65. doi: 10.1364/oe.14.008849. Opt Express. 2006. PMID: 19529266
-
Rayleigh-Debye-Gans as a model for continuous monitoring of biological particles: Part II, development of a hybrid model.Opt Express. 2008 Mar 31;16(7):4671-87. doi: 10.1364/oe.16.004671. Opt Express. 2008. PMID: 18542564
-
Optical characterization of liposomes by right angle light scattering and turbidity measurement.Biochim Biophys Acta. 2000 Jul 31;1467(1):219-26. doi: 10.1016/s0005-2736(00)00223-6. Biochim Biophys Acta. 2000. PMID: 10930524
-
Spectroscopy of model-membrane liposome-protein systems: complementarity of linear dichroism, circular dichroism, fluorescence and SERS.Emerg Top Life Sci. 2021 May 14;5(1):61-75. doi: 10.1042/ETLS20200354. Emerg Top Life Sci. 2021. PMID: 33942863 Review.
Cited by
-
Flow Linear Dichroism of Protein-Membrane Systems.Methods Mol Biol. 2021;2263:449-463. doi: 10.1007/978-1-0716-1197-5_21. Methods Mol Biol. 2021. PMID: 33877612
-
Encapsulation of ε-Viniferin into Multi-Lamellar Liposomes: Development of a Rapid, Easy and Cost-Efficient Separation Method to Determine the Encapsulation Efficiency.Pharmaceutics. 2021 Apr 16;13(4):566. doi: 10.3390/pharmaceutics13040566. Pharmaceutics. 2021. PMID: 33923723 Free PMC article.
References
-
- Ardhammar M, Mikati N, Nordén B. Chromophore orientation in liposome membranes probed with flow linear dichroism. J Am Chem Soc. 1998;120:9957–9958. doi: 10.1021/ja981102g. - DOI
Publication types
Grants and funding
LinkOut - more resources
Full Text Sources
Other Literature Sources
Research Materials
