. 2018 Dec;61(12):2621-2632.
doi: 10.1007/s00125-018-4730-z. Epub 2018 Sep 25.

Silencing of high-affinity insulin-reactive B lymphocytes by anergy and impact of the NOD genetic background in mice

Affiliations

Silencing of high-affinity insulin-reactive B lymphocytes by anergy and impact of the NOD genetic background in mice

Mia J Smith et al. Diabetologia. 2018 Dec.

Abstract

Aims/hypothesis: Previous studies have demonstrated that high-affinity insulin-binding B cells (IBCs) silenced by anergy in healthy humans lose their anergy in islet autoantibody-positive individuals with recent-onset type 1 diabetes, and in autoantibody-negative first-degree relatives carrying certain risk alleles. Here we explore the hypothesis that IBCs are found in the immune periphery of disease-resistant C57BL/6-H2g7 mice, where, as in healthy humans, they are anergic, but that in disease-prone genetic backgrounds (NOD) they become activated and migrate to the pancreas and pancreatic lymph nodes, where they participate in the development of type 1 diabetes.

Methods: We compared the status of high-affinity IBCs in disease-resistant VH125.C57BL/6-H2g7 and disease-prone VH125.NOD mice.

Results: Consistent with findings in healthy humans, high-affinity IBCs reach the periphery in disease-resistant mice and are anergic, as indicated by a reduced expression of membrane IgM, unresponsiveness to antigen and failure to become activated or accumulate in the pancreatic lymph nodes or pancreas. In NOD mice, high-affinity IBCs reach the periphery early in life and increase in number prior to the onset of hyperglycaemia. These cells are not anergic; they become activated, produce autoantibodies and accumulate in the pancreas and pancreatic lymph nodes prior to disease development.

Conclusions/interpretation: These findings are consistent with genetic determination of the escape of high-affinity IBCs from anergy and their early contribution to the development of type 1 diabetes.

Keywords: Anergy; Autoantibodies; Autoimmunity; B cell; Diabetes; Insulin; NOD.


Conflict of interest statement

Duality of interest The authors declare that there is no duality of interest associated with this manuscript.

Figures

Fig. 1
Fig. 1
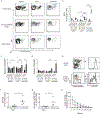
Detection and enrichment of IBCs in disease-resistant and disease-prone mice. (a) Diagram of the absorbent used for the magnetic-particle-based staining and enrichment of IBCs. Splenic cells from VH125.NOD mice were subjected to the enrichment protocol in the presence of 50× unlabelled insulin, or in the absence of biotinylated insulin. (b) Representative cytograms comparing the total and enriched populations of splenic IBCs from female 8- to 12-week-old VH125.C57BL/6-H2g7, VH125.NOD, VH281.NOD and NOD mice. (c) MFI of IBCs compared across the four strains (n=5 for each group). (d, e) Total (d) and enriched (e) splenic IBCs as a percentage of B220+ B cells in the various mouse stains (n=10 for each group). Results are representative of at least three replicate experiments and are expressed as mean ± SEM. **p<0.01, ***p<0.001, unpaired Student’s t test
Fig. 2
Fig. 2
BCR specificity for insulin contributes to development of diabetes in NOD mice. (a) Disease development in female VH125.NOD (n=56), NOD (n=74), VH281.NOD (n=31) and VH125.C57BL/6-H2g7 (n=45) mice based on weekly blood glucose monitoring from weaning until disease onset or 40 weeks of age. (b) Total splenic IBC numbers (B220+) for 8- to 12-week-old female mice. (c) Male VH125.NOD (n=21) were evaluated in the same manner as in (a). Black circles, female VH125.NOD mice; light grey squares, female NOD mice. (d) Total splenic IBC numbers (B220+) for 10- to 20-week-old mice. The mean for each group is plotted as a horizontal line. Statistically significant differences in disease development were determined by logrank tests. Differences in the number of IBCs between the various strains were determined by unpaired Student’s t tests; *p<0.05, ***p<0.001
Fig. 3
Fig. 3
Defective peripheral silencing of IBCs in NOD mice. (a) Representative cytograms of IgM expression vs insulin binding in VH125.C57BL/6-H2g7 and VH125.NOD mice. Staining reveals a low-affinity IBC population, designated Insulinlo (black ovals), and a high-affinity IBC population, Insulinhi (grey ovals), in VH125.C57BL/6-H2g7 mice. In VH125.NOD mice, both the Insulinlo and Insulinhi B cell populations had a high affinity for antigen. The two cytograms are overlaid for comparison of IgM levels and insulin reactivity. (b) Enriched IBCs as a percentage of B220+ cells for Insulinlo and Insulinhi B cells in VH125.C57BL/6-H2g7 and VH125.NOD mice. (c) Relative IgM expression (compared with non-IBCs) of Insulinlo and Insulinhi B cells in VH125.C57BL/6-H2g7 and VH125.NOD mice. (d, e) Percentage and relative usage of λ (compared with non-IBCs) of splenic λ-positive CD19+ B cells in the Insulinlo and Insulinhi B cell populations from the two strains. (f) Changes in the number of splenic IBCs with age and progression to type 1 diabetes in VH125.C57/B6-H2g7 (black circles), VH125.NOD (dark grey squares) and wild-type NOD mice (light grey triangles). (g) Changes in the number of Insulinlo (black squares) and Insulinhi (grey squares) splenic B cells in VH125.NOD mice with age and progression to type 1 diabetes. (h) Representative cytograms and splenic B cell subpopulation distribution of Insulinlo (black), Insulinhi (red) and non-IBC (light grey) cells in the spleen of 10-week-old VH125.C57BL/6-H2g7 and VH125.NOD mice. MZ, marginal zone; T1, transitional type 1; T2, transitional type 2, FO, follicular; T3, transitional type 3; An1, anergic. (i) MZ, T1 and T2 B cells are CD21hi CD23lo. (j) FO, T3 and An1 cells are CD21lo CD23hi. Results are representative of at least three experiments with at least three mice in each group. The mean for each group is shown as a horizontal line. *p<0.05, **p<0.01, ***p<0.001, Mann– Whitney U tests
Fig. 4
Fig. 4
IBCs in VH125.NOD are functionally responsive. (a) Gating strategy to identify IBCs in VH125.C57BL/6-H2g7 and VH125.NOD mice for assay of calcium mobilisation. Cytograms depicting gates when insulin is omitted are shown for comparison and to demonstrate the specificity of the binding. IBCs in VH125.C57BL/6-H2g7 mice are probably Insulinhi due to decreased mIgM expression and do not show a mobilisation of intracellular calcium ([Ca2+]i) following stimulation (black line) compared with non-IBCs (light grey line), indicative of anergy. IBCs in VH125.NOD mice show increased mIgM expression and equal calcium mobilisation (dark grey line) compared with non-IBCs (light grey line), suggesting they are not anergic. (b) Representative histograms of pSyk before (dotted lines) and after (solid lines) stimulation in non-IBCs (Insulin) and IBCs (Insulin+) from VH125.C57BL/6-H2g7 (B6) and VH125.NOD (NOD) mice. Gating on IBCs and non-IBCs is similar to that shown in Fig. 1b. Stim, stimulated; unstim, unstimulated. (c) Change in geometric MFI (gMFI) of phosphorylated Syk following stimulation in IBCs and non-IBCs in the two strains. (d) Representative basal PTEN levels in non-IBCs and IBCs from the two strains. Gating on IBCs and non-IBCs is similar to that shown in Fig. 1b. (e) Basal PTEN levels in IBCs vs non-IBCs in VH125.C57BL/6-H2g7 and VH125.NOD mice. Results are representative of at least three independent experiments with at least three mice per group. Results from the other two experiments demonstrated a greater than 70% decrease in calcium flux in IBCs from all VH125.C57BL/6-H2g7 mice assayed compared with IBCs in VH125.NOD mice. In the experiments not shown, the ΔgMFI of pSyk in IBCs from VH125.C57BL/6-H2g7 mice was on average (mean) 145 and 128 times less than that for insulin cells (p<0.01 for both experiments), whereas the IBCs from VH125.NOD mice had a gMFI on average 43 and 65 times higher than that in non-IBCs (p<0.01 and p<0.001, respectively). Basal PTEN levels in IBCs from VH125.C57BL/6-H2g7 mice showed an average 30 and 62 times higher gMFI than non-IBCs (p<0.05 and p<0.01, respectively), whereas IBCs from VH125.NOD mice had on average a 22 and 37 times lower gMFI than non-IBCs (*p<0.05 for both). For stimulation experiments, cells were stimulated with 5 μg/ml of F(ab′)2 goat anti-mouse IgM. *p<0.05, **p<0.01, ***p<0.001 determined by Mann–Whitney U test. Data in (c) and (e) are mean ± SEM
Fig. 5
Fig. 5
IBCs in VH125.NOD mice accumulate in the pLNs and pancreas, express activation markers and produce autoantibodies. (a) Representative cytograms of Insulinlo, Insulinhi and Insulin+ B cells in the spleen, pLNs and pancreas from unenriched tissue samples. Staining from VH281.NOD mice is shown as a negative control for insulin binding. (b) IBCs as a percentage of B220+ B cells are compared for each organ in the two strains. IBCs accumulate in the pLNs and pancreas of VH125.NOD (NOD) but not VH125.C57BL/6-H2g7 (B6) mice. (c, d) Relative CD86 and CD69 geometric MFI (gMFI) of IBCs compared with non-IBCs in each organ is compared for the two strains. Insulinhi B cells in VH125.NOD mice upregulate both activation markers. (e) Representative gating strategy for IBC plasmablasts (PBs) in the pLNs of both strains. (f) The percentage of IBC PBs is increased in the pLNs of VH125.NOD compared with VH125.C57BL/6-H2g7 mice. The percentage of IBC PBs was determined by multiplying the frequency of B220lo IBC+ cells in the lymphocyte gate in the pLNs by the percentage that were also CD138+. (g) The absolute number of IBC PBs is also increased in the pLNs of VH125.NOD compared with VH125.C57BL/6-H2g7 mice. (h) ELISA of serum demonstrating that IBCs in VH125.NOD (dark grey squares), but not VH125.C57BL/6-H2g7 (black circles) mice, probably produce anti-insulin antibodies, and are increased compared with wild-type NOD (light grey triangles) mice. Insulin reactivity in the serum of VH125.NOD mice was significantly elevated compared with VH125.C57BL/6-H2g7 mice (p<0.01). All experiments used n=5 female, non-diabetic, 8- to 12-week-old mice. Results are representative of at least three experiments with at least three mice per group. *p<0.05, **p<0.01, ***p<0.001; Mann–Whitney U tests were used for all assays except ELISA, in which a one-way ANOVA with repeated measures was used

Similar articles

Cited by

References

    1. Serreze DV, Chapman HD, Varnum DS et al. (1996) B lymphocytes are essential for the initiation of T cell-mediated autoimmune diabetes: analysis of a new “speed congenic” stock of NOD.Ig mu null mice. J Exp Med 184: 2049–2053 - PMC - PubMed
    1. Noorchashm H, Noorchashm N, Kern J, Rostami SY, Barker CF, Naji A (1997) B-cells are required for the initiation of insulitis and sialitis in nonobese diabetic mice. Diabetes 46: 941–946 - PubMed
    1. Pescovitz MD, Greenbaum CJ, Krause-Steinrauf H et al. (2009) Rituximab, B-lymphocyte depletion, and preservation of beta-cell function. N Engl J Med 361: 2143–2152 - PMC - PubMed
    1. Hu CY, Rodriguez-Pinto D, Du W et al. (2007) Treatment with CD20-specific antibody prevents and reverses autoimmune diabetes in mice. J Clin Invest 117: 3857–3867 - PMC - PubMed
    1. Xiu Y, Wong CP, Bouaziz JD et al. (2008) B lymphocyte depletion by CD20 monoclonal antibody prevents diabetes in nonobese diabetic mice despite isotype-specific differences in Fc gamma R effector functions. J Immunol 180: 2863–2875 - PubMed

Publication types