. 2018 Sep;24(3):1-12.
doi: 10.1117/1.JBO.24.3.031008.

Combined high-speed holographic shape and full-field displacement measurements of tympanic membrane

Affiliations

Combined high-speed holographic shape and full-field displacement measurements of tympanic membrane

Payam Razavi et al. J Biomed Opt. 2018 Sep.

Abstract

The conical shape of the tympanic membrane (TM or eardrum) plays an important role in its function, such that variations in shape alter the acoustically induced motions of the TM. We present a method that precisely determines both shape and acoustically induced transient response of the entire TM using the same optics and maintaining the same coordinate system, where the TM transient displacements due to a broadband acoustic click excitation (50-μs impulse) and the shape are consecutively measured within <200 ms. Interferograms gathered with continuous high-speed (>2 kHz) optical phase sampling during a single 100-ms wavelength tuning ramp allow precise and rapid reconstructions of the TM shape at varied resolutions (50 to 200 μm). This rapid acquisition of full-field displacements and shape is immune to slow disturbances introduced by breathing or heartbeat of live subjects. Knowledge of TM shape and displacements enables the estimation of surface normal displacements regardless of the orientation of the TM within the measurement system. The proposed method helps better define TM mechanics and provides TM structure and function information useful for the diagnosis of ear disease.

Keywords: high-speed holography; middle ear; shape and displacement measurement; tympanic membrane.


Figures
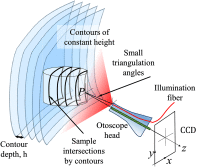
Fig. 1
Fig. 1
Schematic representation of contours of constant phase intersecting the sample in the MWHI shape measurements method. h or “contour depth” is the distance corresponding to a 2π interference phase directly related to the synthetic wavelength.
Fig. 2
Fig. 2
The variations of Λ with respect to base wavelength λ and wavelength difference percentile λp [Eq. (2)]. The left axis (in blue color) shows the normalized Λ by the base wavelength λ. The right axis (in orange color) is the synthetic wavelength conversion of the left axis for λ=780  nm.
Fig. 3
Fig. 3
(a) Typical human TM shape and orientation dimensions (the TM has a tent-like conical shape 8 to 10 mm in diameter and 2 to 3 mm in height) and (b) the relation between the shape gradient [governed by angle θ shown in (a)] with respect to spatial resolution of the imaging sensor and the contour depth (governed by Λ).
Fig. 4
Fig. 4
Schematic representation of high-speed multiresolution MWHI shape measurement method. (a) An illustration of the temporal variation in the wavelength of illumination as it varies regularly between 1 and 2 over 100 ms. Each of the circled stem lines marks the initiation of a 500-μs period of continuous phase shift and high-speed holographic measurement described in (b); (b) Illustrates one of the high-speed phase shifts with nearly stable wavelength at λi. The dashed red line shows a 0 to 2π phase shift introduced into the reference path, and the fainter red rectangles illustrate the timing of images captured by the high-speed camera; (c) As in (b), the continuous red line shows the total real phase shift that results from the controlled wavelength variation, sample motions, and continuous phase shift applied to the reference path (dashed red line). The colored boxes show the camera frames that the later described correlation algorithm chose to define frames of desired total phase shift.
Fig. 5
Fig. 5
Timeline of events during a set of displacement measurements. The blue line shows the phase shifter position. For phase quantification purposes, a continuous phase shift is performed prior to sample excitation with a stable phase during the sample response. The high-speed camera continuously captures reference and deformed frames for the desired duration. Using the automated correlation algorithm, we choose the reference frame with π/2 phase shift relative to the stable value. Note that the phase-shifted references have a phase that is negative compared with the baseline reference that results in change of the sign in Eq. (4), ΔϕΔϕ.
Fig. 6
Fig. 6
(a) Schematic representation of the shape and displacements measurements setup and (b) photograph of the setup. VBSs are to balance the intensity ratio between the reference and object at different wavelengths and polarizers in the reference arm correct for the polarization mismatch caused by the VBS and polarizing wedge (W) beam combiner. The high-speed camera is Photron Fastcam SA-Z with a pixel peach of 20  μm and operates at 67.2 kHz (512×512  pixels). MS, mechanical shutters; DM, dichroic mirror; PL, polarizers; BE-S, BEam-shaper (Anamorphic Prism); M, mirror; EL, expansion lens; IL, imaging lens.
Fig. 7
Fig. 7
Flowchart and timeline of a set of combined HDH shape and displacement measurements.
Fig. 8
Fig. 8
Measurement methods for cadaveric human ears: (a) top view, (b) back view, and (c) photograph of the human cadaveric TM. The black contour shows the outline of the manubrium (the handle of the malleus embedded in the TM) and the umbo (the manubrial tip labeled with a U).
Fig. 9
Fig. 9
Schematics of optical path length difference of a thin-shell having dominant out-of-plane displacements. Δϕ is the interference phase due to displacements, K=k2k1 is the sensitivity vector, L is the displacements vector, and n is the surface normal vector at the point zp.
Fig. 10
Fig. 10
Spatial distribution of errors between the measured radius and the NIST traceable gauge nominal radius.
Fig. 11
Fig. 11
The results of the shape measurements repeatability test. (a) a custom-made conical-shaped latex membrane to study the repeatability of the shape measurements, (b) calibrated wrapped modulo 2π phase corresponding to five consecutive measurements of the shape of the custom sample, (c) shape map of the sample from one of the measurements in (b), and (d) shape profiles along the dashed black line in (c) for all five iterations; represented by different colors.
Fig. 12
Fig. 12
Representative phase maps highlighting shape measurements at multiple resolutions: (a) timing of the triggers relative to the wavelength variation during the tune. The red line shows the theoretical change in the variable wavelength λ during a wavelength tune. The green, magenta, and blue lines show repeated measurements of λ using a wavelength meter. The jumps observed in the wavelength readings are due to the low temporal resolution of the meter (<80  Hz); there are no jumps in the actual wavelength tuning. The black vertical lines show positions where a brief phase ramp was applied to measure wavelength and interference phase [Fig. 4(b)]. The measurements are numbered by their temporal sequence during the tuning ramp; (b) wrapped and unwrapped phase maps taken with selected arbitrary combinations showing various number of fringes across the sample; (c) the filtered wrapped phase map measured with optimum resolution; (d) wrapped phase map of panel (c) after calibration; and (e) measured 3-D shape of TM.
Fig. 13
Fig. 13
(a) spatial distribution of surface normal vectors on a TM, (b) spatial distribution of surface normals (red arrows) as well as sensitivity vectors (black arrows) along the red line of panel (a) showing spatial variations of angle α (defined in Fig. 9) across the red line in (a), and (c) computed sensitivity multiplier map to determine surface-normal displacements from interference phase information.
Fig. 14
Fig. 14
3-D shape and 1000 times exaggerated TM transient response surface normal displacements due to an acoustic click. This video consists of five sections: (a) the still image here shows nine temporal instances while the video shows up to 2.5 ms of the response. The manubrium of the malleus is shown with a black line and U represents the umbo location; (b and c) show the shape and displacements along the red and blue lines shown in (a); (d) the timeline of displacements at the intersection of the red and blue lines (umbo); and (e) modulo 2π phase map (Δϕ) of each frame (Video 1, MPEG-4, 10.9 Mb [URL: https://doi.org/10.1117/1.JBO.24.3.031008.1]).
Fig. 15
Fig. 15
Time waveforms of six selected regions as shown in the top left panel. The sound pressure signal is shown only on region-1 panel. Note that the range of displacement axis is different at each region.
Fig. 16
Fig. 16
A map of the absolute displacement difference between the corrected surface-normal displacements and the displacements estimated by the assumption of uniform sensitivity without shape compensation for the set of human postmortem TM measurements. The spatial distribution of the differences along the red and blue lines is shown in the bottom and right panels, respectively, showing >100-nm differences. The manubrium of the malleus is shown with a black line and U represents the umbo location.

Similar articles

Cited by

References

    1. Geisler C. D., From Sound to Synapse: Physiology of the Mammalian Ear, Oxford University Press, Oxford: (1998).
    1. Rosowski J. J., “Outer and middle ears,” in Comparative Hearing: Mammals, Fay R. R., Popper A. N., Eds., pp. 172–247, Springer, New York: (1994).
    1. Fay J. P., Puria S., Steele C. R., “The discordant eardrum,” Proc. Natl. Acad. Sci. U.S.A. 103(52), 19743–19748 (2006).10.1073/pnas.0603898104 - DOI - PMC - PubMed
    1. Volandri G., et al. , “Biomechanics of the tympanic membrane,” J. Biomech. 44(7), 1219–1236 (2011).JBMCB510.1016/j.jbiomech.2010.12.023 - DOI - PubMed
    1. Cheng T., Dai C., Gan R. Z., “Viscoelastic properties of human tympanic membrane,” Ann. Biomed. Eng. 35(2), 305–314 (2007).ABMECF10.1007/s10439-006-9227-0 - DOI - PubMed

Publication types