A graph-based filtering method for top-down mass spectral identification
- PMID: 30255788
- PMCID: PMC6157290
- DOI: 10.1186/s12864-018-5026-x
A graph-based filtering method for top-down mass spectral identification
Abstract
Background: Database search has been the main approach for proteoform identification by top-down tandem mass spectrometry. However, when the target proteoform that produced the spectrum contains post-translational modifications (PTMs) and/or mutations, it is quite time consuming to align a query spectrum against all protein sequences without any PTMs and mutations in a large database. Consequently, it is essential to develop efficient and sensitive filtering algorithms for speeding up database search.
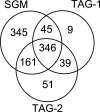
Results: In this paper, we propose a spectrum graph matching (SGM) based protein sequence filtering method for top-down mass spectral identification. It uses the subspectra of a query spectrum to generate spectrum graphs and searches them against a protein database to report the best candidates. As the sequence tag and gaped tag approaches need the preprocessing step to extract and select tags, the SGM filtering method circumvents this preprocessing step, thus simplifying data processing. We evaluated the filtration efficiency of the SGM filtering method with various parameter settings on an Escherichia coli top-down mass spectrometry data set and compared the performances of the SGM filtering method and two tag-based filtering methods on a data set of MCF-7 cells.
Conclusions: Experimental results on the data sets show that the SGM filtering method achieves high sensitivity in protein sequence filtration. When coupled with a spectral alignment algorithm, the SGM filtering method significantly increases the number of identified proteoform spectrum-matches compared with the tag-based methods in top-down mass spectrometry data analysis.
Keywords: Filtering algorithm; Mass spectrometry; Spectrum graph.
Conflict of interest statement
Ethics approval and consent to participate
Not applicable.
Consent for publication
Not applicable.
Competing interests
The authors declare that there are no competing interests.
Publisher’s Note
Springer Nature remains neutral with regard to jurisdictional claims in published maps and institutional affiliations.
Figures


Similar articles
-
Systematic Evaluation of Protein Sequence Filtering Algorithms for Proteoform Identification Using Top-Down Mass Spectrometry.Proteomics. 2018 Feb;18(3-4):10.1002/pmic.201700306. doi: 10.1002/pmic.201700306. Epub 2018 Feb 6. Proteomics. 2018. PMID: 29327814 Free PMC article.
-
A Spectrum Graph-Based Protein Sequence Filtering Algorithm for Proteoform Identification by Top-Down Mass Spectrometry.Proceedings (IEEE Int Conf Bioinformatics Biomed). 2017 Nov;2017:222-229. doi: 10.1109/BIBM.2017.8217653. Epub 2017 Dec 18. Proceedings (IEEE Int Conf Bioinformatics Biomed). 2017. PMID: 29503761 Free PMC article.
-
Evaluation of top-down mass spectral identification with homologous protein sequences.BMC Bioinformatics. 2018 Dec 28;19(Suppl 17):494. doi: 10.1186/s12859-018-2462-1. BMC Bioinformatics. 2018. PMID: 30591035 Free PMC article.
-
Top-Down Proteomics and the Challenges of True Proteoform Characterization.J Proteome Res. 2023 Dec 1;22(12):3663-3675. doi: 10.1021/acs.jproteome.3c00416. Epub 2023 Nov 8. J Proteome Res. 2023. PMID: 37937372 Free PMC article. Review.
-
Proteoform characterization based on top-down mass spectrometry.Brief Bioinform. 2021 Mar 22;22(2):1729-1750. doi: 10.1093/bib/bbaa015. Brief Bioinform. 2021. PMID: 32118252 Review.
References
MeSH terms
Substances
LinkOut - more resources
Full Text Sources
Other Literature Sources
Research Materials
Miscellaneous

