

Epilepsy-predictive magnetic resonance imaging changes following experimental febrile status epilepticus: Are they translatable to the clinic?
- PMID: 30256385
- PMCID: PMC6217797
- DOI: 10.1111/epi.14561
Epilepsy-predictive magnetic resonance imaging changes following experimental febrile status epilepticus: Are they translatable to the clinic?
Abstract
Objective: A subset of children with febrile status epilepticus (FSE) are at risk for development of temporal lobe epilepsy later in life. We sought a noninvasive predictive marker of those at risk that can be identified soon after FSE, within a clinically realistic timeframe.
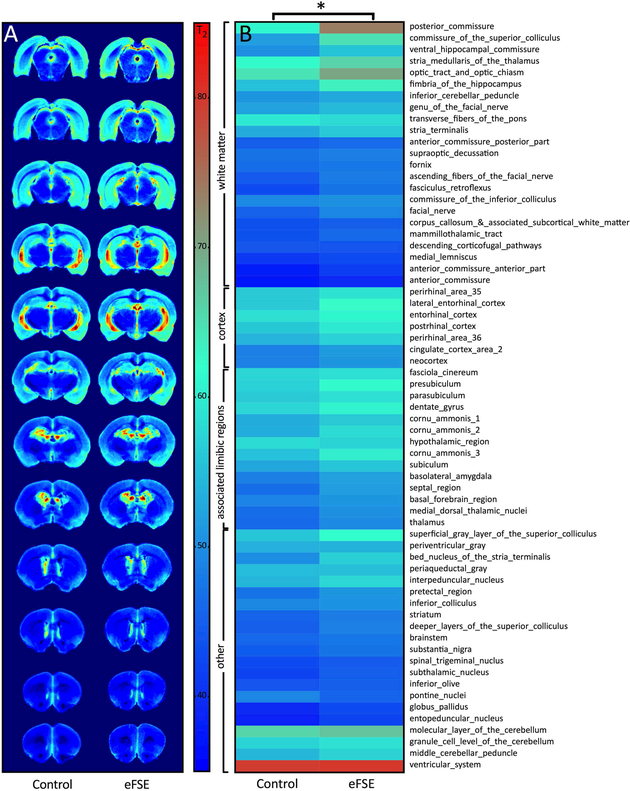
Methods: Longitudinal T2 -weighted magnetic resonance imaging (T2 WI MRI) of rat pups at several time points after experimental FSE (eFSE) was performed on a high-field scanner followed by long-term continuous electroencephalography. In parallel, T2 WI MRI scans were performed on a 3.0-T clinical scanner. Finally, chronic T2 WI MRI signal changes were examined in rats that experienced eFSE and were imaged months later in adulthood.
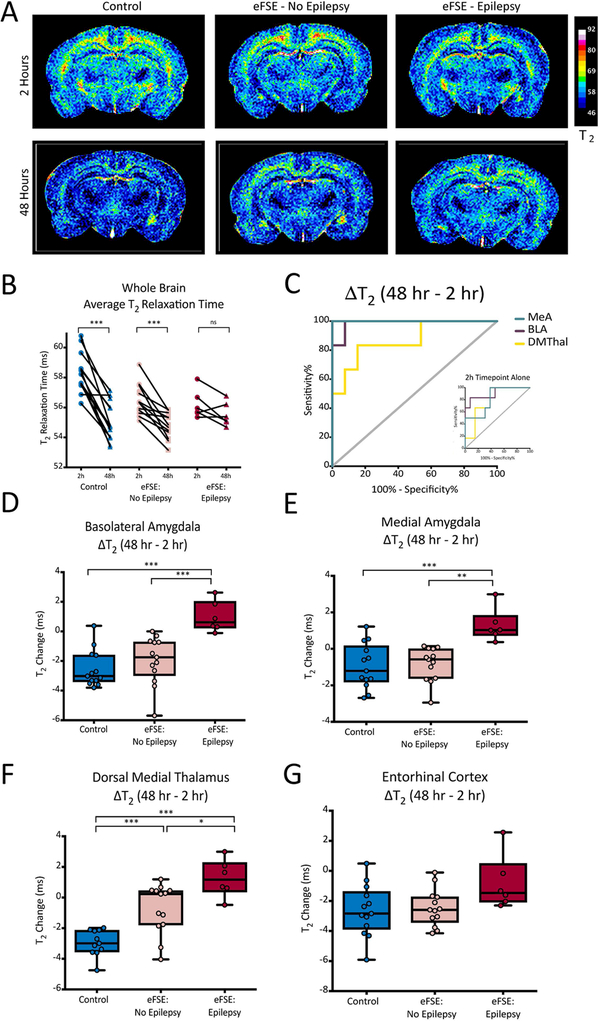
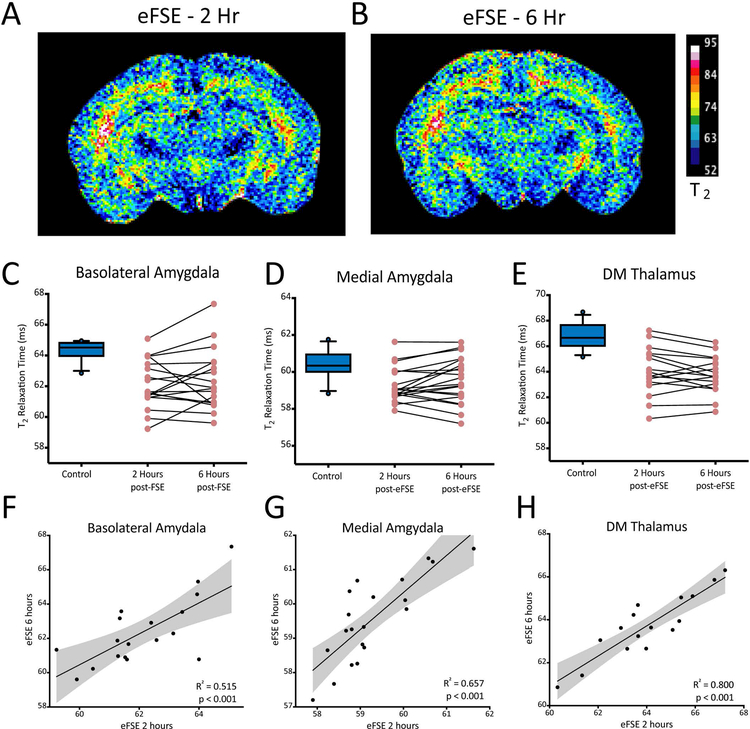
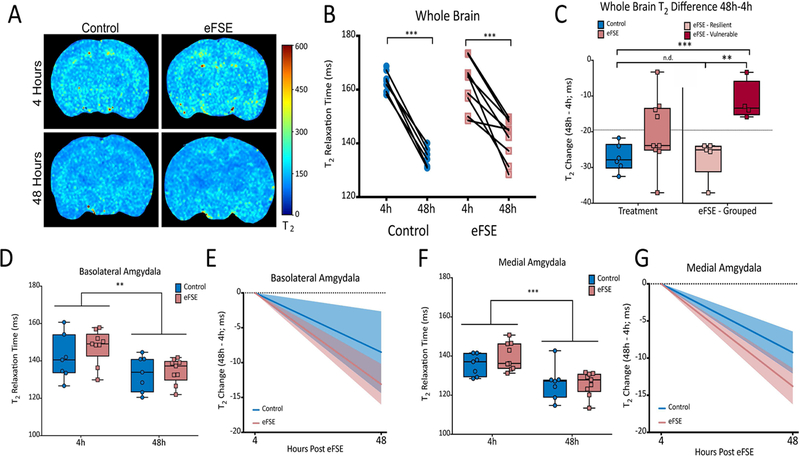
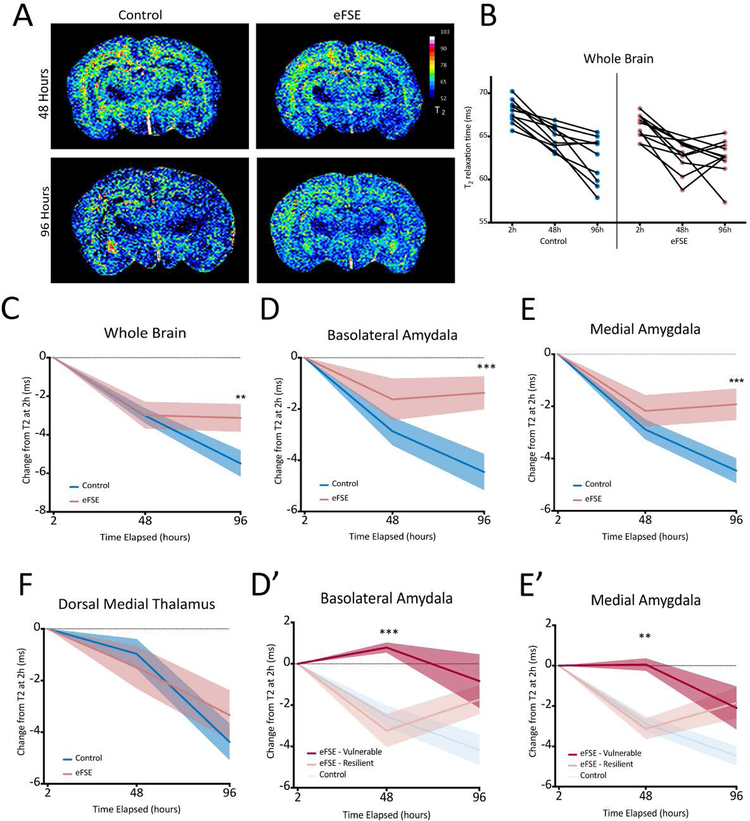
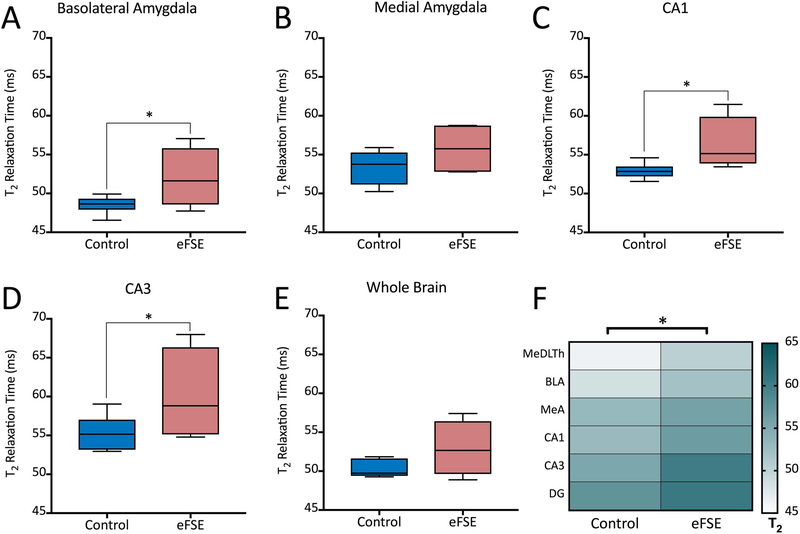
Results: Epilepsy-predicting T2 changes, previously observed at 2 hours after eFSE, persisted for at least 6 hours, enabling translation to the clinic. Repeated scans, creating MRI trajectories of T2 relaxation times following eFSE, provided improved prediction of epileptogenesis compared with a single MRI scan. Predictive signal changes centered on limbic structures, such as the basolateral and medial amygdala. T2 WI MRI changes, originally described on high-field scanners, can also be measured on clinical MRI scanners. Chronically elevated T2 relaxation times in hippocampus were observed months after eFSE in rats, as noted for post-FSE changes in children.
Significance: Early T2 WI MRI changes after eFSE provide a strong predictive measure of epileptogenesis following eFSE, on both high-field and clinical MRI scanners. Importantly, the extension of the acute signal changes to at least 6 hours after the FSE enables its inclusion in clinical studies. Chronic elevations of T2 relaxation times within the hippocampal formation and related structures are common to human and rodent FSE, suggesting that similar processes are involved across species.
Keywords: epileptogenesis; febrile seizures; febrile status epilepticus; magnetic resonance imaging; temporal lobe epilepsy.
Wiley Periodicals, Inc. © 2018 International League Against Epilepsy.
Conflict of interest statement
Conflict of Interest: None of the authors has any conflict of interest to disclose.
Figures
Similar articles
-
Augmented seizure susceptibility and hippocampal epileptogenesis in a translational mouse model of febrile status epilepticus.Epilepsia. 2021 Mar;62(3):647-658. doi: 10.1111/epi.16814. Epub 2021 Jan 21. Epilepsia. 2021. PMID: 33475157 Free PMC article.
-
A novel, noninvasive, predictive epilepsy biomarker with clinical potential.J Neurosci. 2014 Jun 25;34(26):8672-84. doi: 10.1523/JNEUROSCI.4806-13.2014. J Neurosci. 2014. PMID: 24966369 Free PMC article.
-
Dexamethasone Attenuates Hyperexcitability Provoked by Experimental Febrile Status Epilepticus.eNeuro. 2019 Nov 15;6(6):ENEURO.0430-19.2019. doi: 10.1523/ENEURO.0430-19.2019. Print 2019 Nov/Dec. eNeuro. 2019. PMID: 31685676 Free PMC article.
-
Management of Febrile Status Epilepticus: Past, Present, and Future.In: Noebels JL, Avoli M, Rogawski MA, Vezzani A, Delgado-Escueta AV, editors. Jasper's Basic Mechanisms of the Epilepsies. 5th edition. New York: Oxford University Press; 2024. Chapter 69. In: Noebels JL, Avoli M, Rogawski MA, Vezzani A, Delgado-Escueta AV, editors. Jasper's Basic Mechanisms of the Epilepsies. 5th edition. New York: Oxford University Press; 2024. Chapter 69. PMID: 39637113 Free Books & Documents. Review.
-
Origins of temporal lobe epilepsy: febrile seizures and febrile status epilepticus.Neurotherapeutics. 2014 Apr;11(2):242-50. doi: 10.1007/s13311-014-0263-4. Neurotherapeutics. 2014. PMID: 24604424 Free PMC article. Review.
Cited by
-
Vascular topology and blood flow are acutely impacted by experimental febrile status epilepticus.J Cereb Blood Flow Metab. 2023 Jan;43(1):84-98. doi: 10.1177/0271678X221117625. Epub 2022 Aug 1. J Cereb Blood Flow Metab. 2023. PMID: 35912523 Free PMC article.
-
Update on the Neuroimaging and Electroencephalographic Biomarkers of Epileptogenesis: A Literature Review.Front Neurol. 2021 Aug 27;12:738658. doi: 10.3389/fneur.2021.738658. eCollection 2021. Front Neurol. 2021. PMID: 34512540 Free PMC article. Review.
-
Augmented seizure susceptibility and hippocampal epileptogenesis in a translational mouse model of febrile status epilepticus.Epilepsia. 2021 Mar;62(3):647-658. doi: 10.1111/epi.16814. Epub 2021 Jan 21. Epilepsia. 2021. PMID: 33475157 Free PMC article.
-
The Roof is Leaking and a Storm is Raging: Repairing the Blood-Brain Barrier in the Fight Against Epilepsy.Epilepsy Curr. 2019 May-Jun;19(3):177-181. doi: 10.1177/1535759719844750. Epub 2019 Apr 30. Epilepsy Curr. 2019. PMID: 31037960 Free PMC article.
-
Quantitative T2 MRI is predictive of neurodegeneration following organophosphate exposure in a rat model.Sci Rep. 2020 Aug 3;10(1):13007. doi: 10.1038/s41598-020-69991-z. Sci Rep. 2020. PMID: 32747689 Free PMC article.
References
-
- Baram TZ, Shinnar S. Febrile Seizures. San Diego, CA: Academic press; 2002.
-
- Annegers JF, Hauser WA, Shirts SB, et al. Factors prognostic of unprovoked seizures after febrile convulsions. N Engl J Med. 1987;316:493–8. - PubMed
-
- Cendes F, Andermann F, Dubeau F, et al. Early childhood prolonged febrile convulsions, atrophy and sclerosis of mesial structures, and temporal lobe epilepsy: an MRI volumetric study. Neurology. 1993;43:1083–7. - PubMed
-
- Berg AT, Shinnar S. Complex febrile seizures. Epilepsia. 1996; 37:126–33. - PubMed
Publication types
MeSH terms
Grants and funding
LinkOut - more resources
Full Text Sources
Other Literature Sources
Medical
