

A patient-derived cellular model for Huntington's disease reveals phenotypes at clinically relevant CAG lengths
- PMID: 30256717
- PMCID: PMC6249865
- DOI: 10.1091/mbc.E18-09-0590
A patient-derived cellular model for Huntington's disease reveals phenotypes at clinically relevant CAG lengths
Abstract
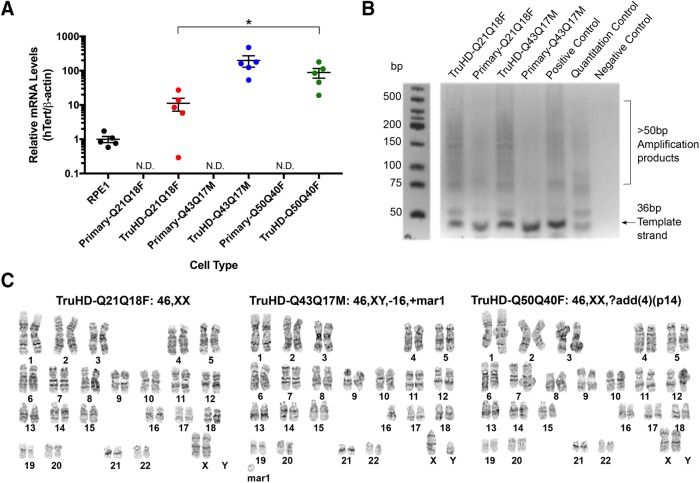
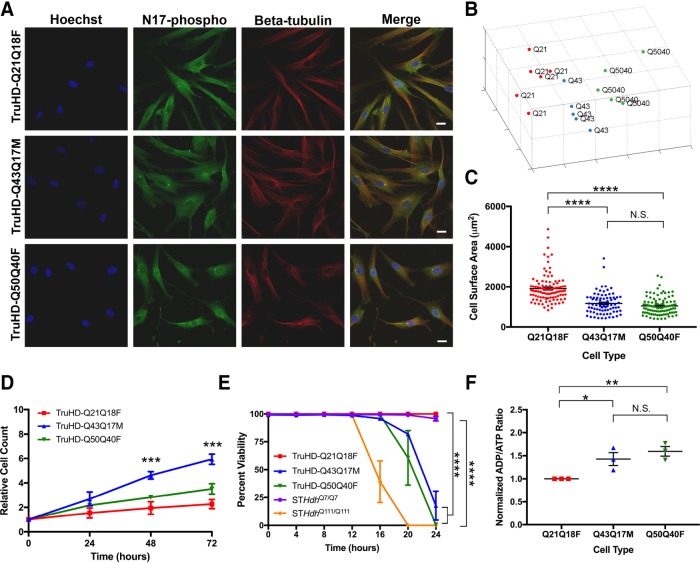
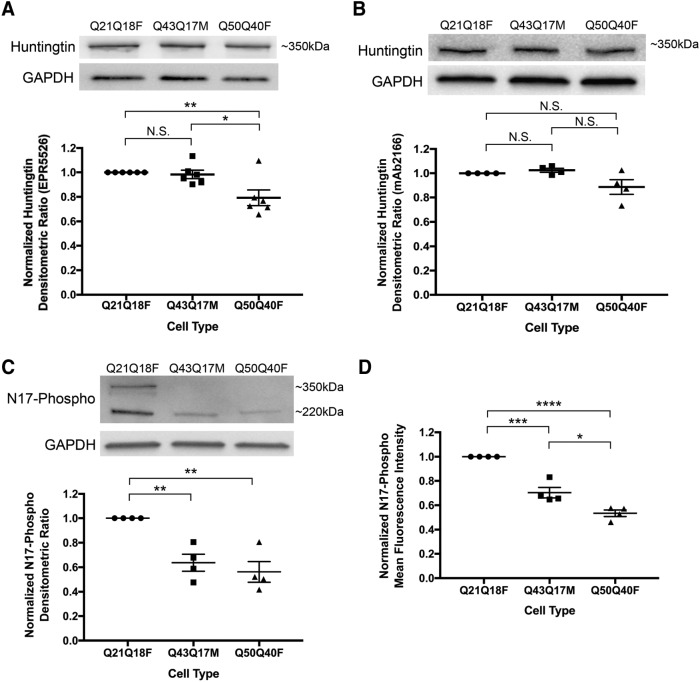
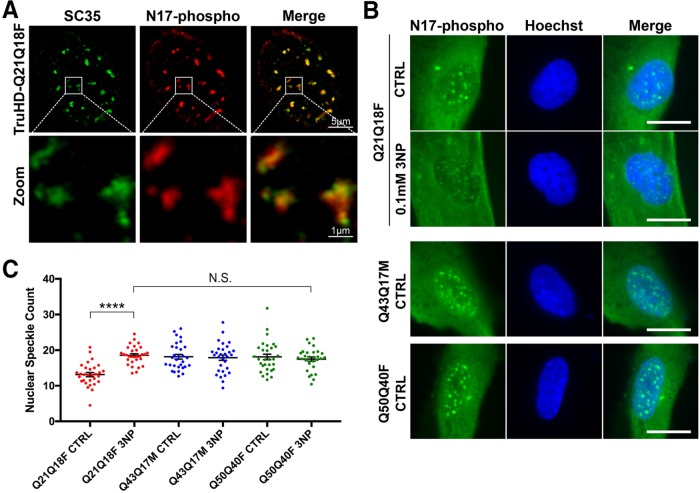
The huntingtin protein participates in several cellular processes that are disrupted when the polyglutamine tract is expanded beyond a threshold of 37 CAG DNA repeats in Huntington's disease (HD). Cellular biology approaches to understand these functional disruptions in HD have primarily focused on cell lines with synthetically long CAG length alleles that clinically represent outliers in this disease and a more severe form of HD that lacks age onset. Patient-derived fibroblasts are limited to a finite number of passages before succumbing to cellular senescence. We used human telomerase reverse transcriptase (hTERT) to immortalize fibroblasts taken from individuals of varying age, sex, disease onset, and CAG repeat length, which we have termed TruHD cells. TruHD cells display classic HD phenotypes of altered morphology, size and growth rate, increased sensitivity to oxidative stress, aberrant adenosine diphosphate/adenosine triphosphate (ADP/ATP) ratios, and hypophosphorylated huntingtin protein. We additionally observed dysregulated reactive oxygen species (ROS)-dependent huntingtin localization to nuclear speckles in HD cells. We report the generation and characterization of a human, clinically relevant cellular model for investigating disease mechanisms in HD at the single-cell level, which, unlike transformed cell lines, maintains functions critical for huntingtin transcriptional regulation and genomic integrity.
Figures
Similar articles
-
Centrosome disorganization in fibroblast cultures derived from R6/2 Huntington's disease (HD) transgenic mice and HD patients.Hum Mol Genet. 2001 Oct 1;10(21):2425-35. doi: 10.1093/hmg/10.21.2425. Hum Mol Genet. 2001. PMID: 11689489
-
HD CAG repeat implicates a dominant property of huntingtin in mitochondrial energy metabolism.Hum Mol Genet. 2005 Oct 1;14(19):2871-80. doi: 10.1093/hmg/ddi319. Epub 2005 Aug 22. Hum Mol Genet. 2005. PMID: 16115812
-
Lack of huntingtin promotes neural stem cells differentiation into glial cells while neurons expressing huntingtin with expanded polyglutamine tracts undergo cell death.Neurobiol Dis. 2013 Feb;50:160-70. doi: 10.1016/j.nbd.2012.10.015. Epub 2012 Oct 23. Neurobiol Dis. 2013. PMID: 23089356
-
Multiple clinical features of Huntington's disease correlate with mutant HTT gene CAG repeat lengths and neurodegeneration.J Neurol. 2019 Mar;266(3):551-564. doi: 10.1007/s00415-018-8940-6. Epub 2018 Jun 28. J Neurol. 2019. PMID: 29956026 Review.
-
Juvenile Huntington's disease: does a dosage-effect pathogenic mechanism differ from the classical adult disease?Mech Ageing Dev. 2006 Feb;127(2):208-12. doi: 10.1016/j.mad.2005.09.012. Epub 2005 Nov 7. Mech Ageing Dev. 2006. PMID: 16274727 Review.
Cited by
-
Antagonistic roles of canonical and Alternative-RPA in disease-associated tandem CAG repeat instability.Cell. 2023 Oct 26;186(22):4898-4919.e25. doi: 10.1016/j.cell.2023.09.008. Epub 2023 Oct 11. Cell. 2023. PMID: 37827155 Free PMC article.
-
Huntingtin interactome reveals huntingtin role in regulation of double strand break DNA damage response (DSB/DDR), chromatin remodeling and RNA processing pathways.bioRxiv [Preprint]. 2024 Dec 27:2024.12.27.630542. doi: 10.1101/2024.12.27.630542. bioRxiv. 2024. PMID: 39763784 Free PMC article. Preprint.
-
PAM-flexible genome editing with an engineered chimeric Cas9.Nat Commun. 2023 Oct 4;14(1):6175. doi: 10.1038/s41467-023-41829-y. Nat Commun. 2023. PMID: 37794046 Free PMC article.
-
Image-based profiling for drug discovery: due for a machine-learning upgrade?Nat Rev Drug Discov. 2021 Feb;20(2):145-159. doi: 10.1038/s41573-020-00117-w. Epub 2020 Dec 22. Nat Rev Drug Discov. 2021. PMID: 33353986 Free PMC article. Review.
-
Experimental Cell Models for Investigating Neurodegenerative Diseases.Int J Mol Sci. 2024 Sep 9;25(17):9747. doi: 10.3390/ijms25179747. Int J Mol Sci. 2024. PMID: 39273694 Free PMC article. Review.
References
-
- Atwal RS, Desmond CR, Caron N, Maiuri T, Xia J, Sipione S, Truant R. (2011). Kinase inhibitors modulate huntingtin cell localization and toxicity. Nat Chem Biol , 453–460. - PubMed
-
- Atwal RS, Truant R. (2008). A stress sensitive ER membrane-association domain in Huntingtin protein defines a potential role for Huntingtin in the regulation of autophagy. Autophagy , 91–93. - PubMed
-
- Atwal RS, Xia J, Pinchev D, Taylor J, Epand RM, Truant R. (2007). Huntingtin has a membrane association signal that can modulate huntingtin aggregation, nuclear entry and toxicity. Hum Mol Genet , 2600–2615. - PubMed
-
- Bae BI, Xu H, Igarashi S, Fujimuro M, Agrawal N, Taya Y, Hayward SD, Moran TH, Montell C, Ross CA, et al (2005). p53 mediates cellular dysfunction and behavioral abnormalities in Huntington’s disease. Neuron , 29–41. - PubMed
Publication types
MeSH terms
Substances
LinkOut - more resources
Full Text Sources
Other Literature Sources
Medical
Research Materials
