. 2018 Dec 1;29(25):3039-3051.
doi: 10.1091/mbc.E18-04-0256. Epub 2018 Sep 26.

Compressive force induces reversible chromatin condensation and cell geometry-dependent transcriptional response

Affiliations

Compressive force induces reversible chromatin condensation and cell geometry-dependent transcriptional response

Karthik Damodaran et al. Mol Biol Cell. .

Abstract

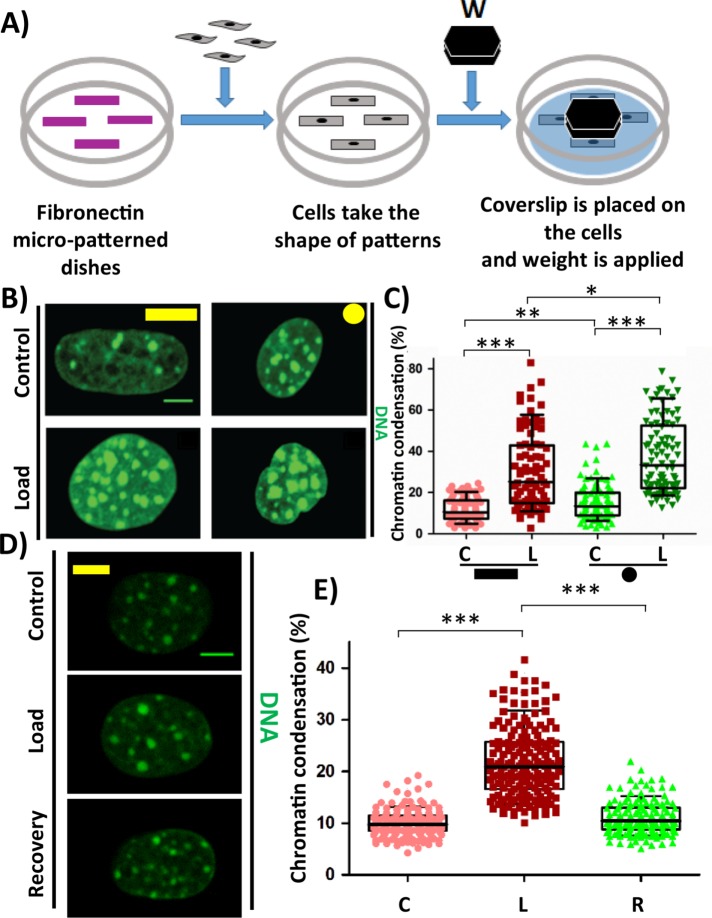
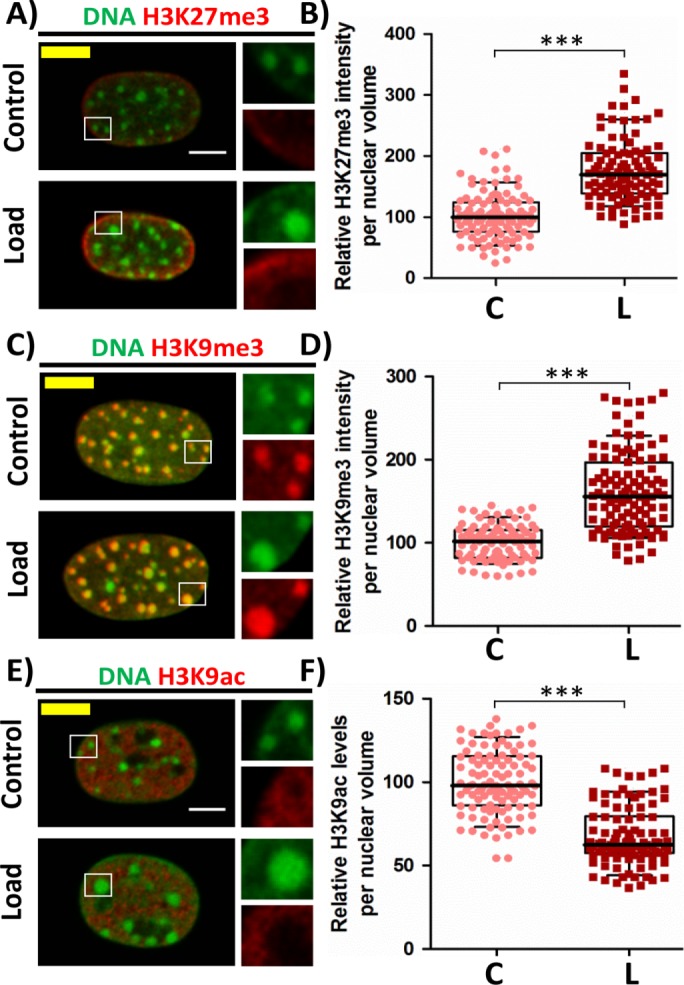
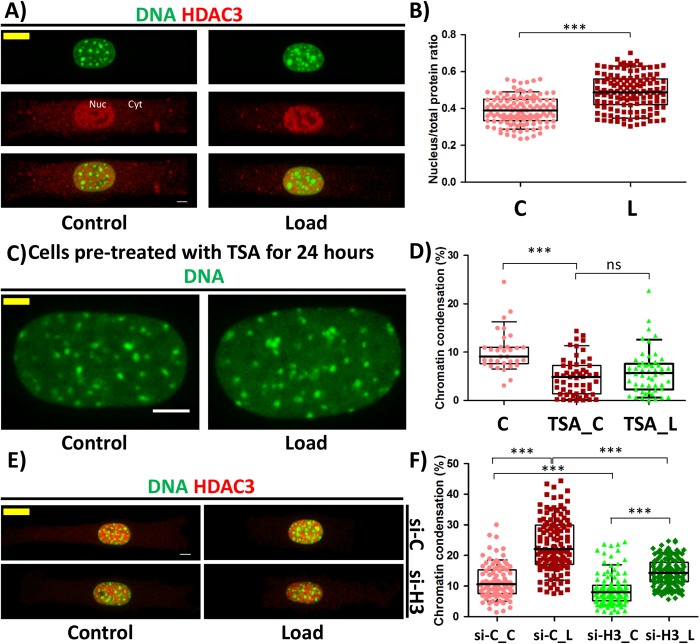
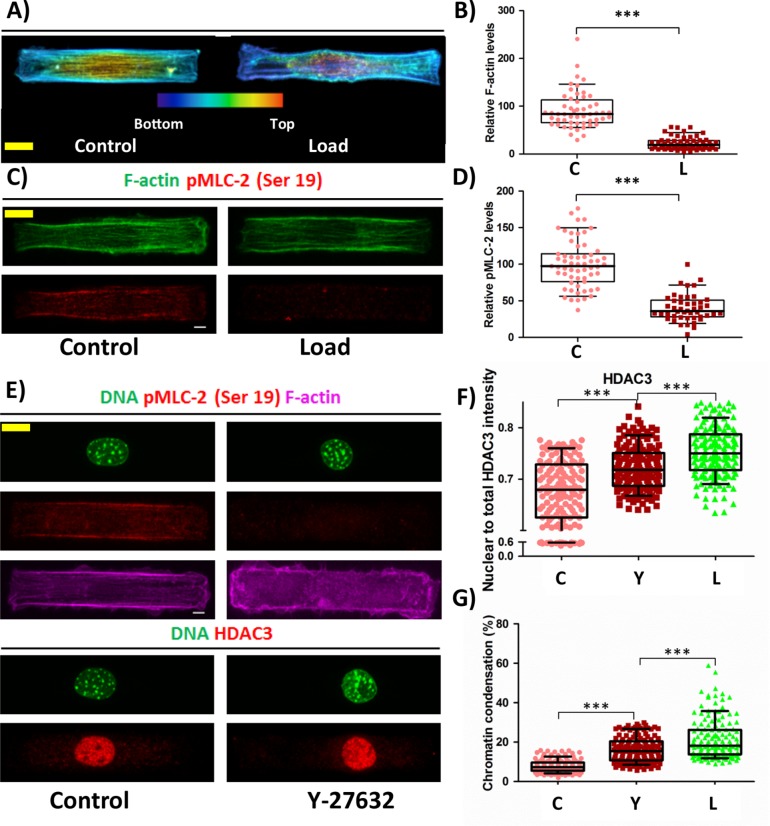
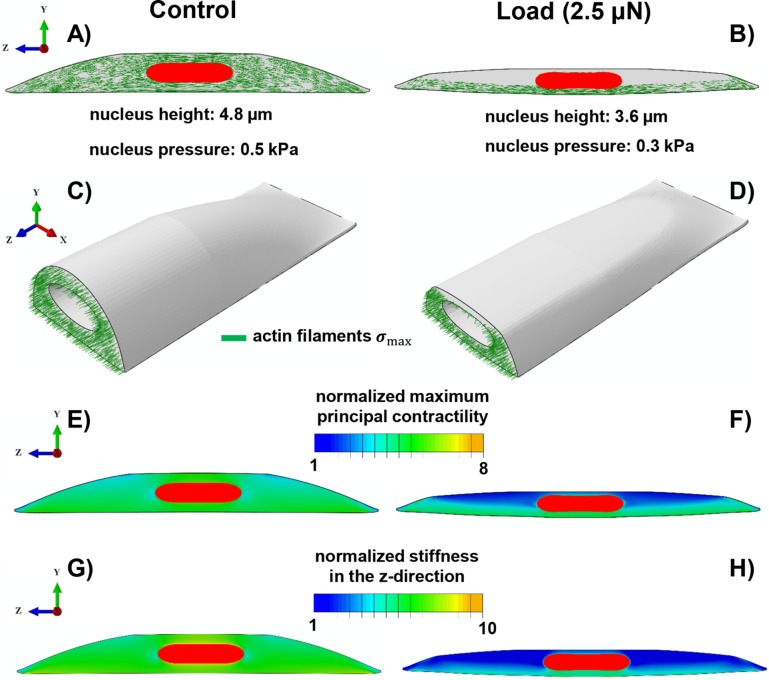
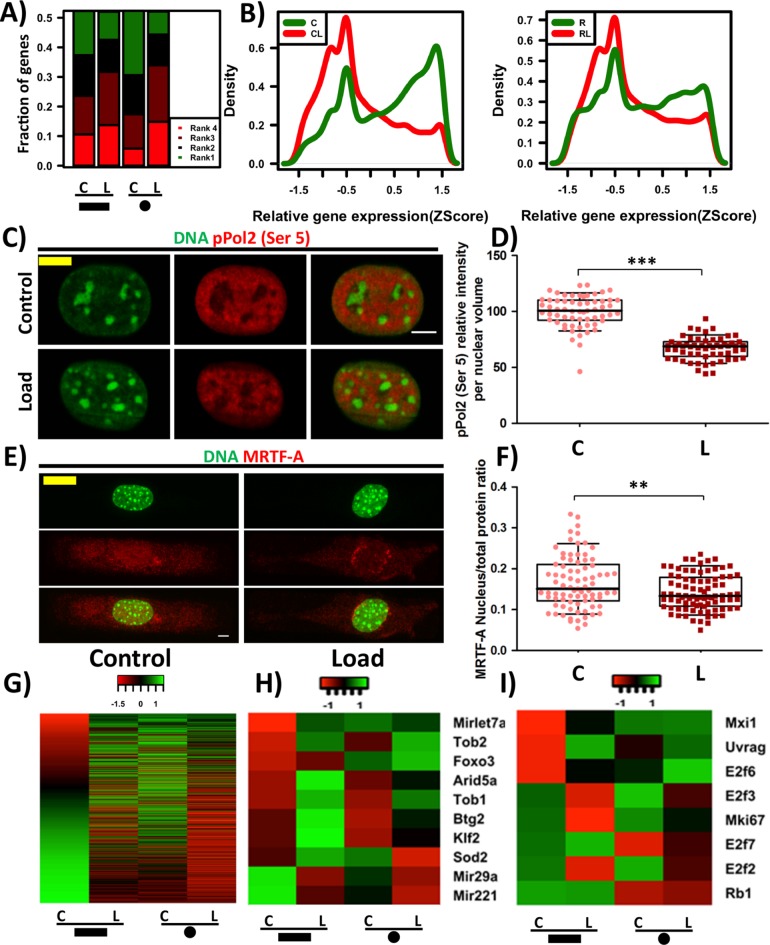
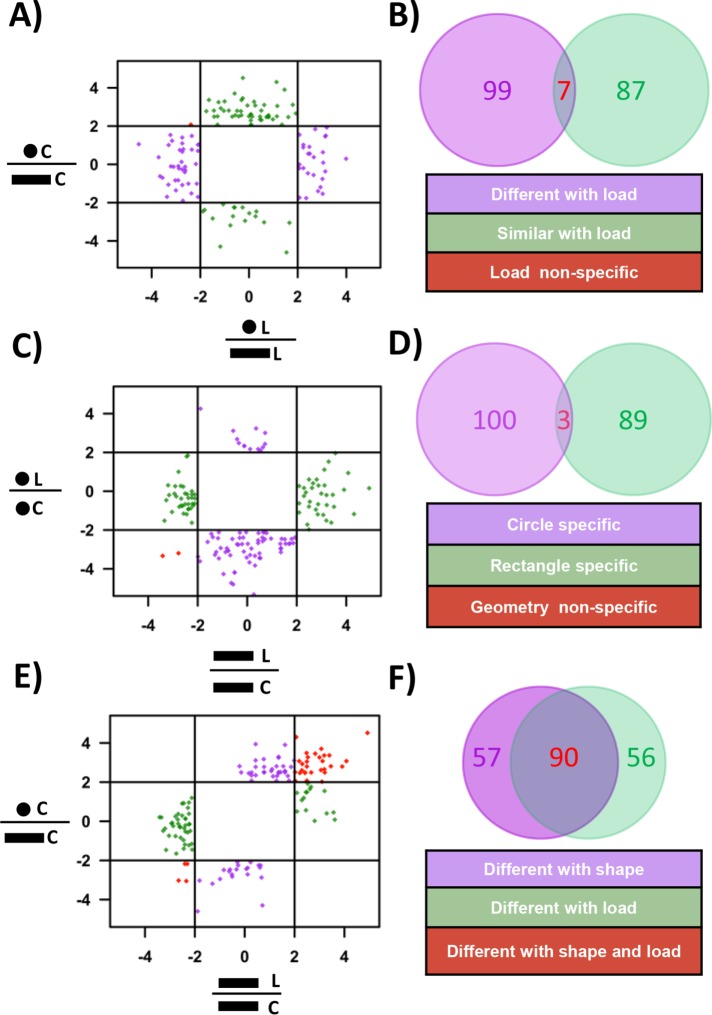
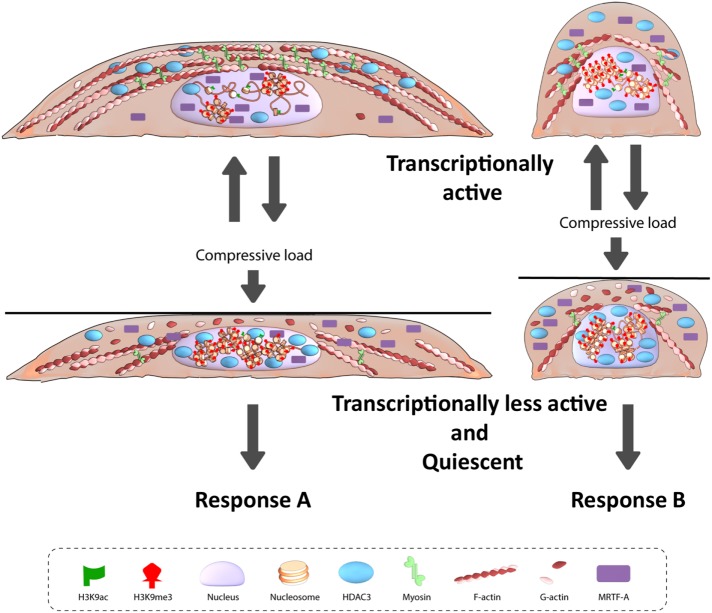
Fibroblasts exhibit heterogeneous cell geometries in tissues and integrate both mechanical and biochemical signals in their local microenvironment to regulate genomic programs via chromatin remodelling. While in connective tissues fibroblasts experience tensile and compressive forces (CFs), the role of compressive forces in regulating cell behavior and, in particular, the impact of cell geometry in modulating transcriptional response to such extrinsic mechanical forces is unclear. Here we show that CF on geometrically well-defined mouse fibroblast cells reduces actomyosin contractility and shuttles histone deacetylase 3 (HDAC3) into the nucleus. HDAC3 then triggers an increase in the heterochromatin content by initiating removal of acetylation marks on the histone tails. This suggests that, in response to CF, fibroblasts condense their chromatin and enter into a transcriptionally less active and quiescent states as also revealed by transcriptome analysis. On removal of CF, the alteration in chromatin condensation was reversed. We also present a quantitative model linking CF-dependent changes in actomyosin contractility leading to chromatin condensation. Further, transcriptome analysis also revealed that the transcriptional response of cells to CF was geometry dependent. Collectively, our results suggest that CFs induce chromatin condensation and geometry-dependent differential transcriptional response in fibroblasts that allows maintenance of tissue homeostasis.


Figures

FIGURE 1:
FIGURE 1:
Compressive force causes chromatin condensation. (A) Experimental setup for Compressive force experiment. (B) Maximum intensity projection of confocal images of nucleus. DNA stained with DAPI (green). (C) Chromatin condensation in percentage based on DAPI stain of the nucleus. N: Rectangle (C# = 83, L# = 83); Circle (C# = 93 and L# = 90). (D) Maximum intensity projection of confocal images of nucleus. DNA stained with DAPI (green). (E) Chromatin condensation in percentage based on DAPI stain of the nucleus. C# = 138, L# = 144, R# = 124. Whisker box plotted from 10 to 90 percentile. Student’s t test, ***p < 0.0001, **p < 0.01, *p < 0.05, ns = not significant. Scale bar: 5 µm. #C = control; L = load, and R = load + recovery.
FIGURE 2:
FIGURE 2:
Increased heterochromatin marks and decreased euchromatin mark in response to CF. (A) Single cross-sectional slice of the nucleus. DNA stained with DAPI (green) and IF staining of H3K27me3 (red). (B) Relative H3K27me3 intensity levels per nuclear volume based on IF staining. N: C# = 107, L# = 99. (C) Maximum intensity projection of confocal images of nucleus. DNA stained with DAPI (green) and IF staining of H3K9me3 (red). (D) Relative H3K9me3 intensity levels per nuclear volume based on IF staining. N: C# = 86, L# = 111. (E) Single cross-sectional slice of the nucleus. DNA stained with DAPI (green) and IF staining of H3K9ac (red). (F) Relative H3K9ac intensity levels per nuclear volume based on IF staining. N: C# = 103, L# = 102. Whisker box plotted from 10 to 90 percentile. Student’s t test, ***p < 0.0001. Scale bar: 5 µm. #C = control and L = load.
FIGURE 3:
FIGURE 3:
HDAC3 is a critical regulator of compressive force–induced heterochromatin. (A) Maximum intensity projection of confocal images of cell. DNA stained with DAPI (green) and IF staining of HDAC3 (red). Nuc = nucleus fraction and Cyt = cytoplasmic fraction (B) Nuclear to total protein ratio of HDAC3 based on IF staining. N: C# = 124, L# = 132. (C) Maximum intensity projection of confocal images of a nucleus from cells treated with Trichostatin A. DNA stained with DAPI (green). Scale bar: 5 µm. (D) Chromatin condensation in percentage based on DAPI stain of the nucleus. N: C# = 33, TSA_ C# = 55, TSA_ L# = 53. (E) Maximum intensity projection of confocal images of cell. DNA stained with DAPI (green) and IF staining of HDAC3 (red). Si-C = Cells transfected with control siRNA and si-H3 = cells transfected with siHDAC3. (F) Chromatin condensation in percentage based on DAPI stain of the nucleus. N: si-C_C = 96, si-C_L = 125, si-H3_C = 114, si-H3_L = 131. Whisker box plotted from 10 to 90 percentile. Student’s t test, ***p < 0.0001, ns = not significant. Scale bar: 5 µm. #C = control; L = load; TSA_C = TSA-treated control; TSA_L = TSA-treated load; si-C_C = control siRNA-treated rectangle control; si-C_L = control siRNA-treated rectangle load; si-H3_C = HDAC3 siRNA-treated rectangle control; si-H3_L = HDAC3 siRNA-treated rectangle load.
FIGURE 4:
FIGURE 4:
HDAC3 is shuttled to the nucleus on reduction in actomyosin contractility resulting in increased chromatin condensation. (A) Maximum intensity projection of confocal images of a cell. Actin stained by phalloidin. Color coded based on height. Bottom (blue) to top (red). (B) Relative F-actin intensity levels. N: C# = 53, L# = 60. (C) Maximum intensity projection of confocal images of a cell. F-actin stained with phalloidin (green) and IF staining of pMLC-2 (ser 19) (red). (D) Relative phosphorylated MLC-2 at Ser-19 levels based on IF staining. N: C# = 59, L# = 46. (E) Maximum intensity projection of confocal images of a cell. Top: DNA stained with DAPI (green), IF staining of pMLC (red), and F-actin stained with phalloidin (majenta). Bottom: DNA stained with DAPI (green) and IF staining of HDAC3 (red). (F) Nuclear to total protein ratio of HDAC3 based on IF staining. N: C# = 145, Y# = 157, L# = 165. (G) Chromatin condensation in percentage based on DAPI stain of the nucleus. N: C# = 150, Y# = 150, L# = 150. Whisker box plotted from 10 to 90 percentile. Student’s t test, ***p < 0.0001, **p < 0.01. Scale bar: 5 µm. #C = control; L = load, and Y = Y-27632.
FIGURE 5:
FIGURE 5:
Simulation results of the mechanochemical model depicting the role of compressive forces on apical actin and nuclear morphology. Starting with isotropic contractility (the same concentration of the phosphorylated myosin motors in all directions), our model predicts an increase in the density of the phosphorylated myosin motors (density of force dipoles) along the long axis of the cell (i.e., polarized contraction). The polarized contraction results in higher tensile stresses along the cell’s polarization direction and subsequently formation of actin filaments along the long axis of the cell (A, C) as observed in our experiments (see Figure 4A). A compressive force of 2.5 µN causes a significant reduction in the cell contractility (a decrease in the density of phosphorylated myosin motors) in the apical regions as shown in F. This reduction in the contractility leads to a decrease in the tensile stresses in the apical regions and subsequently depolymerization of apical actin filaments as shown in B and D. Our model also predicts a decrease in cell stiffness associated with the depolymerization of apical actin filaments in response to the compressive force as depicted in H when compared to G.
FIGURE 6:
FIGURE 6:
Compressive force–induced chromatin condensation results in reduced transcriptional activity and cellular quiescence. (A) A stacked bar plot that quantifies the frequency of the gene expression ranks in the various samples. Rank1 represents highest expression and Rank 4, the least for a particular gene. Note: This is a mere ranking of z-score values and the ranks do not indicate significant differences in the gene expression. (B) Probability density plots of relative expression of all genes in the genome, in rectangular and circular cells (with and without load). (C) Single cross-sectional slice of the nucleus. DNA stained with DAPI (green) and phosphorylated Pol2 (pS5) IF staining (red). (D) Relative phosphorylated Pol2 (pS5) intensity levels per nuclear volume based on IF staining. N: C# = 61, L# = 59. (E) Maximum intensity projection of confocal images of cell. DNA stained with DAPI (green) and IF staining of MRTF-A (red). (F) Nuclear to total protein ratio of MRTF-A based on IF staining. N: C# = 81, L# = 85. (G) Heat map for MRTF-A target genes. Heat map for quiescence- (H) and proliferative- (I) related genes. Whisker box plotted from 10 to 90 percentile. Student’s t test, ***p < 0.0001, **p < 0.01. Scale bar: 5 μm. #C = control and L = load.
FIGURE 7:
FIGURE 7:
Geometry specific global gene expression changes in response to compressive force. (A) Plot between the expression ratio log2 (fold change) of genes between circular and rectangular cells with and without exposure to compressive force. (B) Venn diagram representing the number of genes that are either similar or different with load. (C) Plot between the expression ratio log2 (fold change) of genes with and without exposure to compressive force in circular and rectangular cells. (D) Venn diagram representing the number of genes whose expression is unique to either of the two geometries. (E) Plot between the gene expression ratio log2 (fold change) of genes before and after applying compressive force on rectangular cells and expression ratio between circular and rectangular cells. (F) Venn diagram representing the number of genes whose expression is unique to compressive force or changing geometries. C = control and L = load.
FIGURE 8:
FIGURE 8:
Model for geometry-dependent response to compressive force.

Similar articles

Cited by

References

    1. Afgan E, Baker D, van den Beek M, Blankenberg D, Bouvier D, Cech M, Chilton J, Clements D, Coraor N, Eberhard C, et al (2016). The Galaxy platform for accessible, reproducible and collaborative biomedical analyses: 2016 update. Nucleic Acids Res , W3–W10. - PMC - PubMed
    1. Albiez H, Cremer M, Tiberi C, Vecchio L, Schermelleh L, Dittrich S, Kupper K, Joffe B, Thormeyer T, von Hase J, et al (2006). Chromatin domains and the interchromatin compartment form structurally defined and functionally interacting nuclear networks. Chromosome Res , 707–733. - PubMed
    1. Anders S, Pyl PT, Huber W. (2015). HTSeq–a Python framework to work with high-throughput sequencing data. Bioinformatics , 166–169. - PMC - PubMed
    1. Andrews S. (2010). FastQC: a quality control tool for high throughput sequence data, version 0.11.4. Available online at www.bioinformatics.babraham.ac.uk/projects/fastqc (accessed April 2017).
    1. Anwar T, Sen B, Aggarwal S, Nath R, Pathak N, Katoch A, Aiyaz M, Trehanpati N, Khosla S, Ramakrishna G. (2018). Differentially regulated gene expression in quiescence versus senescence and identification of ARID5A as a quiescence associated marker. J Cell Physiol , 3695–3712. - PubMed