. 2018 Dec 1;120(6):2819-2833.
doi: 10.1152/jn.00875.2017. Epub 2018 Sep 26.

Neuronal adaptation to sound statistics in the inferior colliculus of behaving macaques does not reduce the effectiveness of the masking noise

Affiliations

Neuronal adaptation to sound statistics in the inferior colliculus of behaving macaques does not reduce the effectiveness of the masking noise

Francesca Rocchi et al. J Neurophysiol. .

Abstract

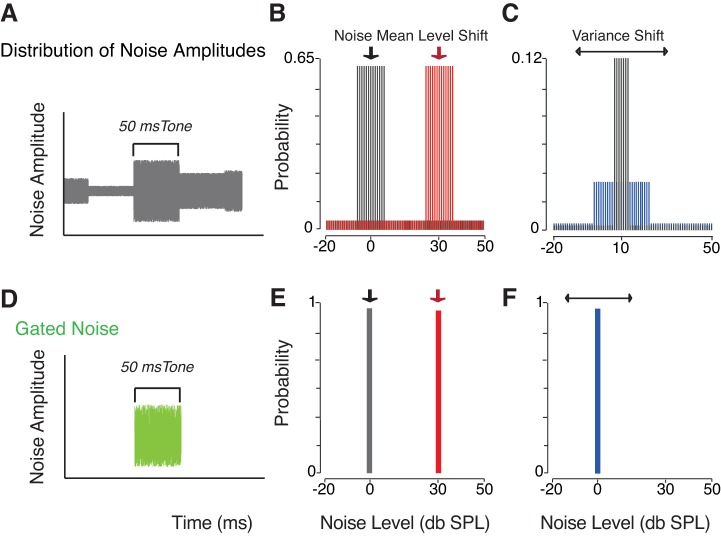
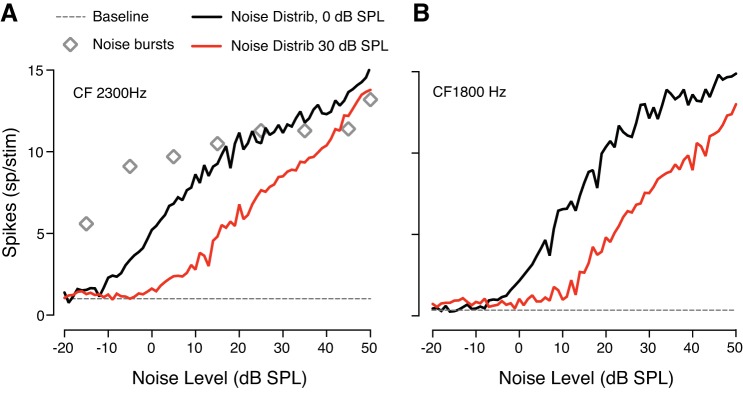
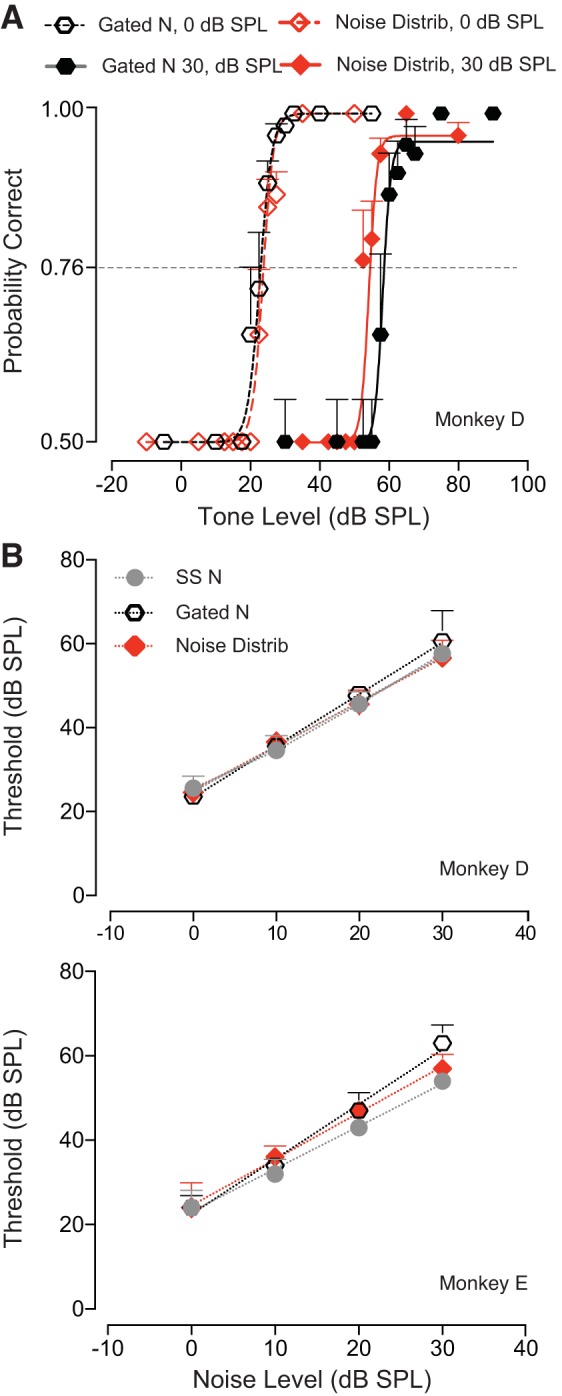
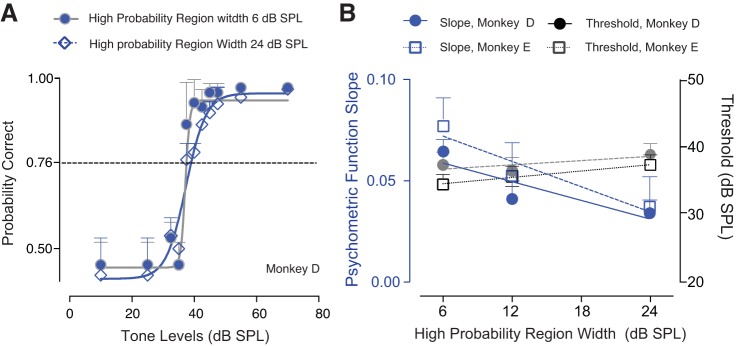
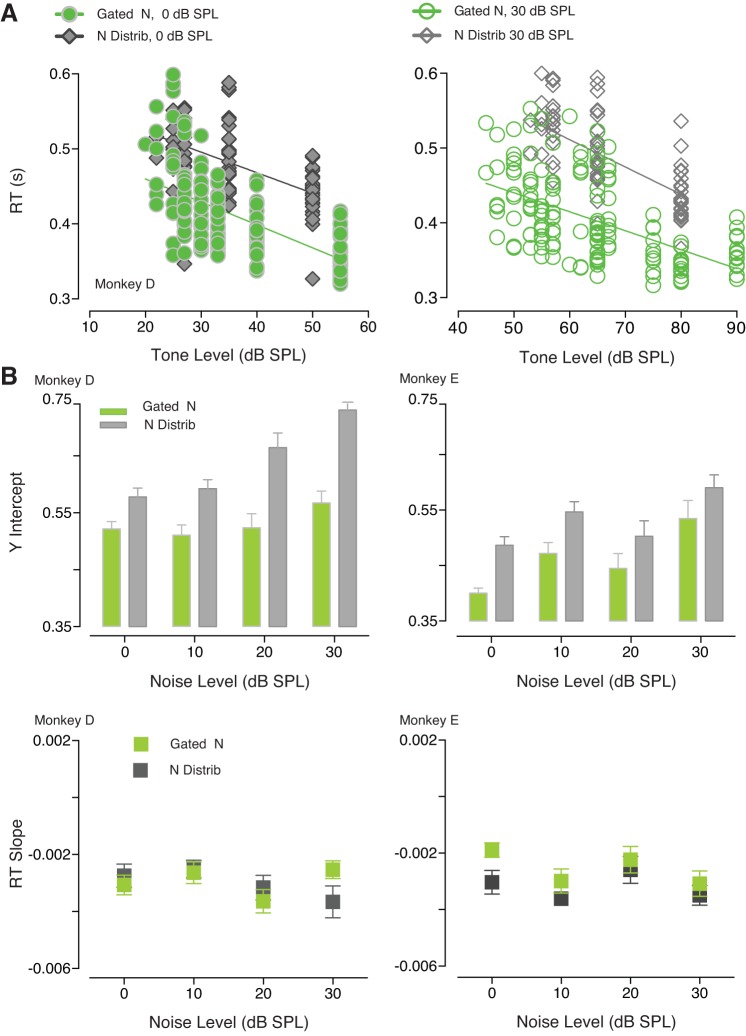
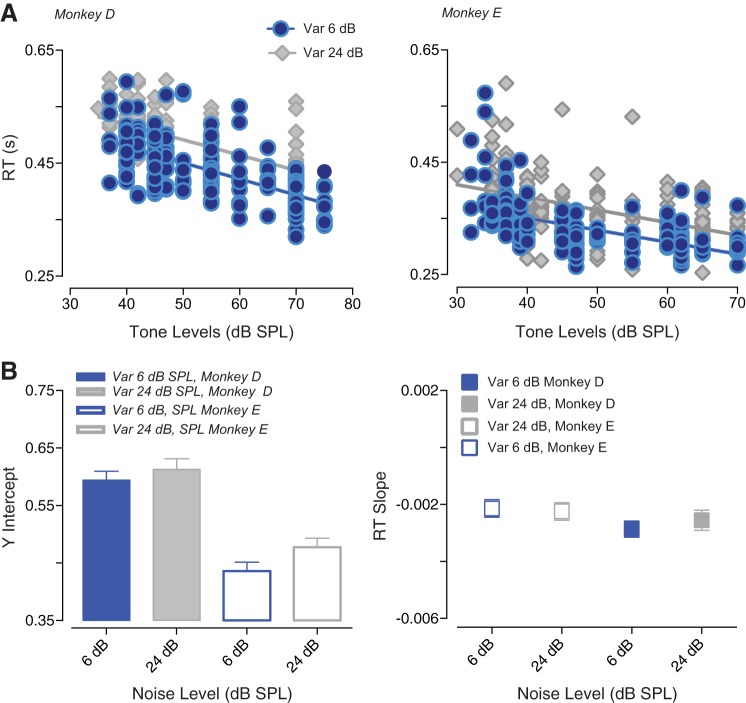
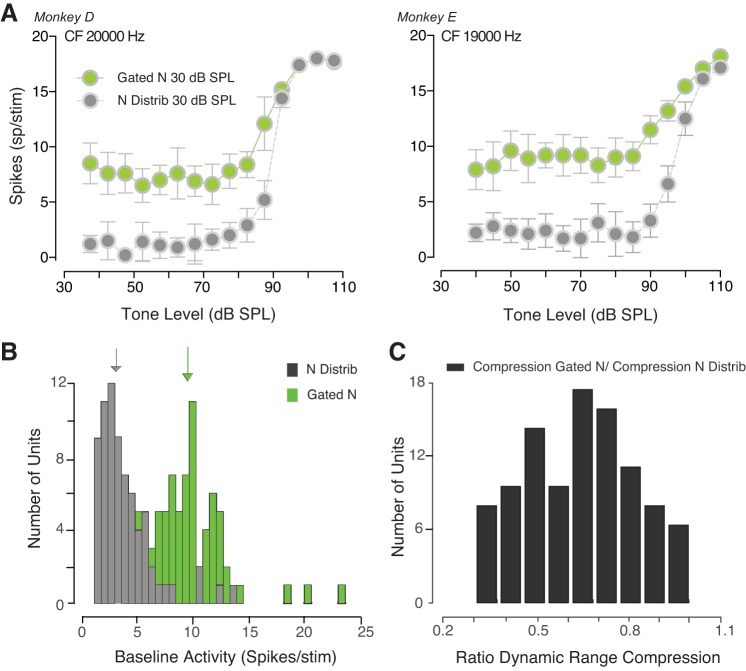
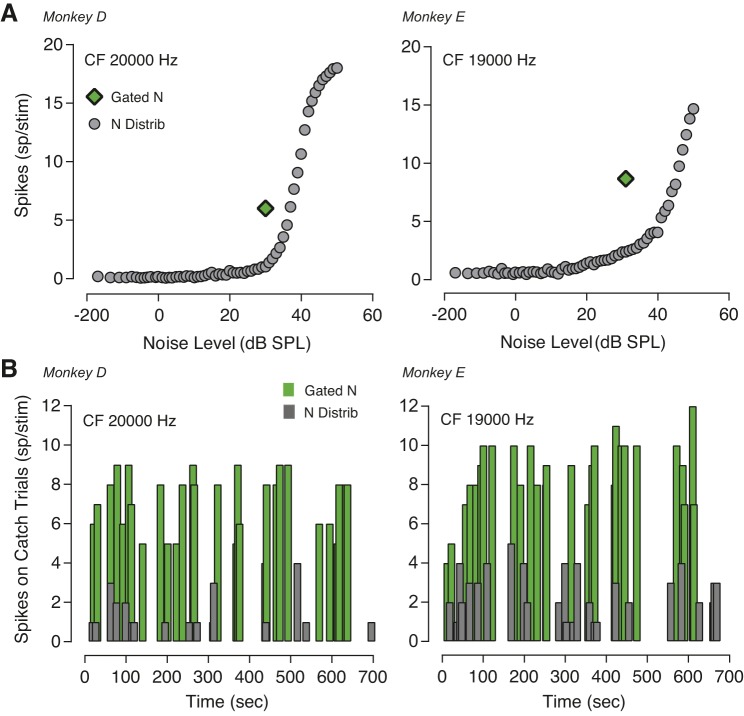
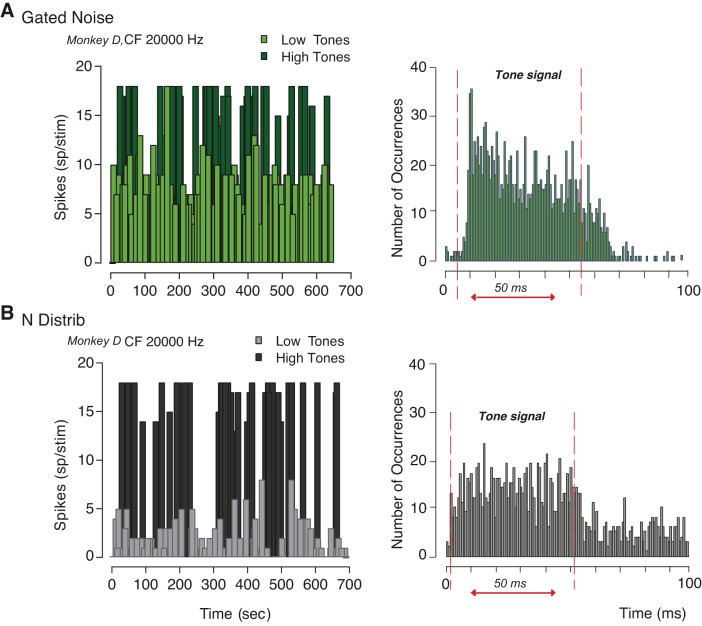
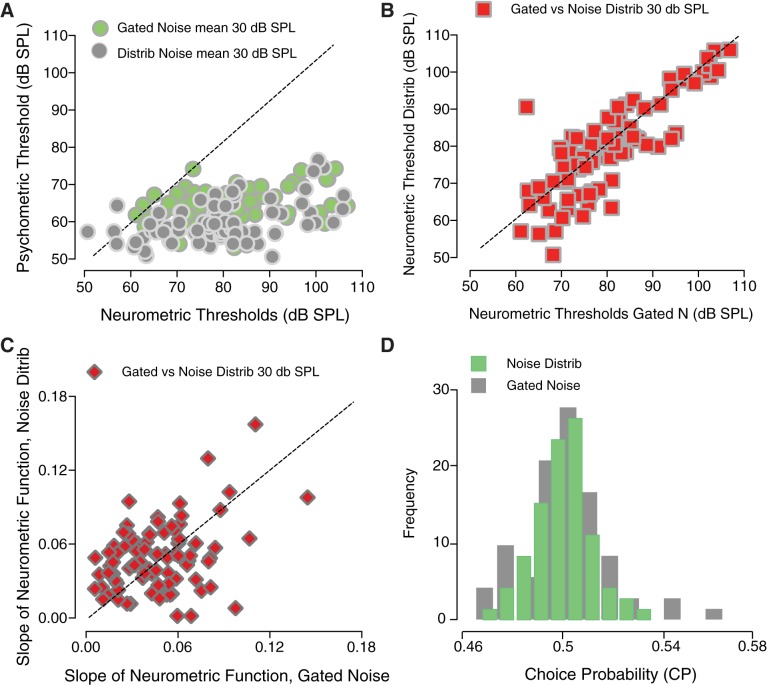
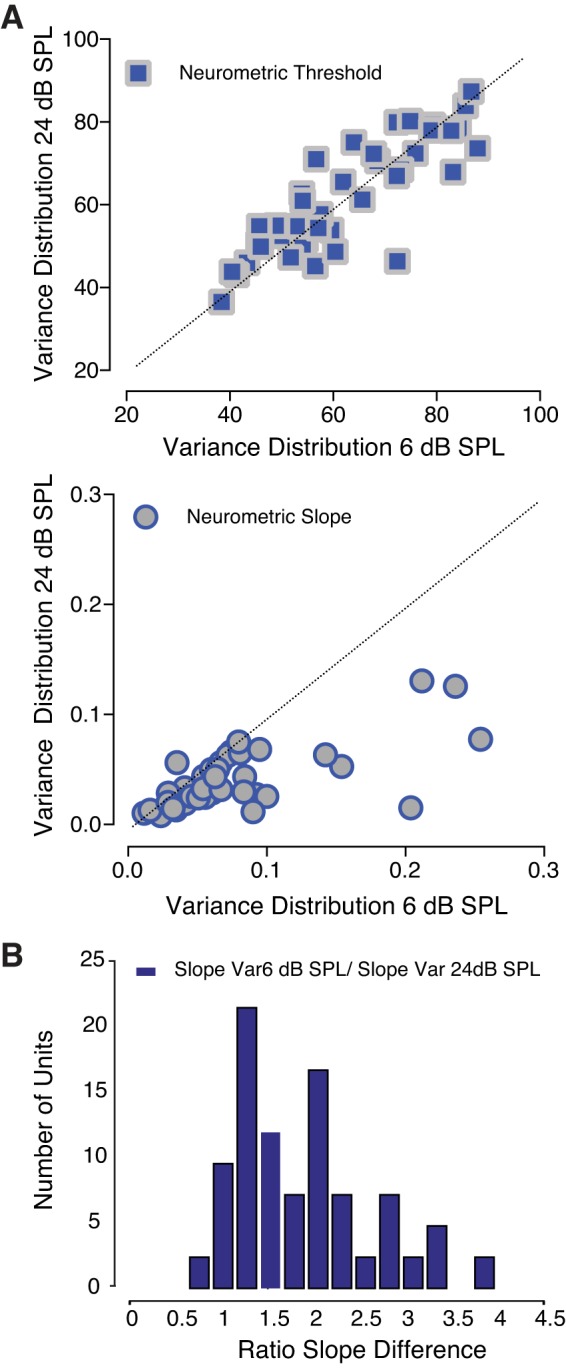
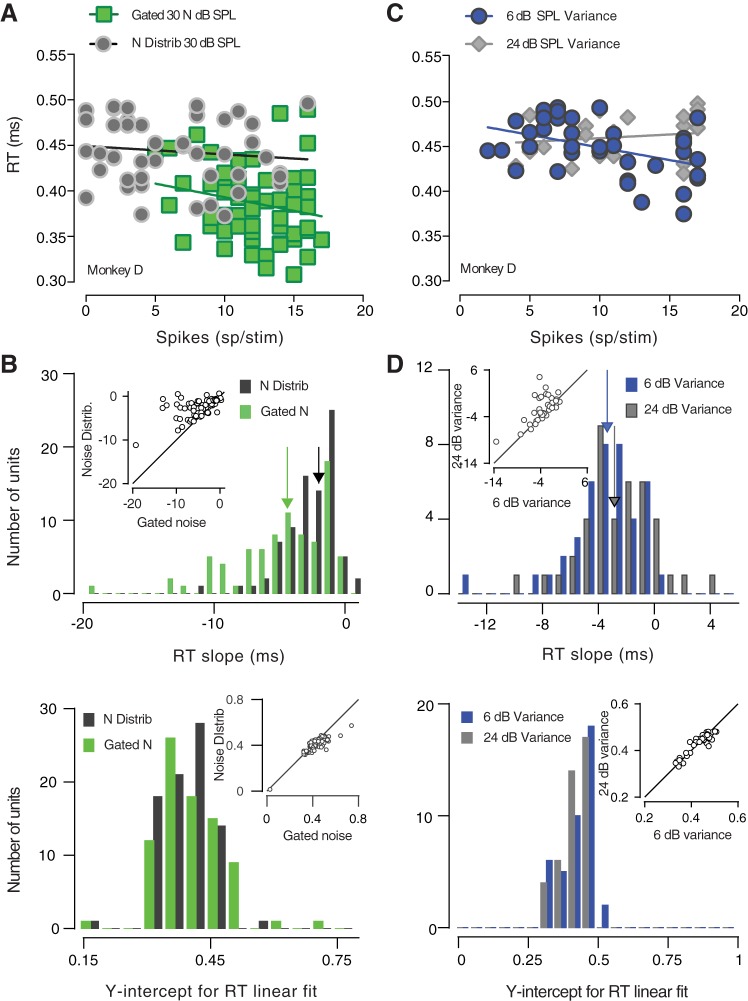
The detectability of target sounds embedded within noisy backgrounds is affected by the regularities that summarize acoustic sceneries. Previous studies suggested that the dynamic range of neurons in the inferior colliculus (IC) of anesthetized guinea pigs shifts toward the mean sound pressure level in irregular acoustic environments. Yet, it is unclear how this neuronal adaptation processes may influence the effectiveness of sounds as a masker, both behaviorally and in terms of neuronal encoding. To answer this question, we measured the neural response of IC neurons while macaque monkeys performed a Go/No-Go tone detection task. Macaques detected a 50-ms tone that was either simultaneously gated with a burst of noise or embedded within a continuous noise background, whose levels were randomly sampled (every 50 ms) from a probability distribution. The mean of the distribution matched the level of the gated burst of noise. Psychometric and IC neurometric thresholds to tones did not differ between the two masking conditions. However, the neuronal firing rate versus level function was significantly affected by the temporal characteristics of the noise masker. Simultaneously gated noise caused higher baseline responses and greater dynamic range compression compared with noise distribution. The slopes of psychometric and neurometric functions were significantly shallower for higher variance distributions, suggesting that neuronal sensitivity might change with the variability of the sound. Our results suggest that the adaptive response of IC neurons to sound regularities does not affect the effectiveness of the noise-masking signal, which remains invariant to surrounding noise amplitudes. NEW & NOTEWORTHY Auditory neurons adapt to the statistics of sound levels in the acoustic scene. However, it is still unclear to what extent such adaptation influences the effectiveness of the stimulus as a masker. Our study represents the first attempt to investigate how the adaptation to the statistics of masking stimuli may be related to the effectiveness of masking, and to the single-unit encoding of the midbrain auditory neurons in behaving animals.

Keywords: behaving macaques; dynamic range compression; inferior colliculus; neuronal adaptation; sound statistics.


Figures

Fig. 1.
Fig. 1.
Schematic representation of the main stimulus paradigm. A: tone signal masked by a distribution of noise amplitudes that changed every 50 ms. The noise-time amplitude waveform is represented in gray. Tones were always played at the same noise amplitude for both the noise distribution and the gated noise conditions. B: examples of two distributions used to randomly sample noise amplitudes. The centroid of the high-probability region (i.e., mean) was shifted from 0 dB sound pressure level (SPL) (gray distribution) to 30 dB SPL (red distribution). C: examples of two distributions where the width of the high-probability region (i.e., variance) was manipulated, and the mean remained constant. The variance increased from 6 dB (gray distribution) to 24 dB SPL (blue distribution). The overall range of noise levels played did not vary. Details of the distributions used for each experimental condition are specified in the main text. D: gated noise condition. A 50-ms burst of noise (single noise amplitude represented in green) masked the tone. E: schematic example of two single noise amplitudes employed as a masker. F: the variance of the noise was always constant and equal to zero in the gated noise condition. Further details of the parameters used in both the psychophysical and the electrophysiological tests are summarized in materials and methods.
Fig. 2.
Fig. 2.
Responses of inferior colliculus (IC) units to two distributions of noise amplitudes [0 and 30 dB sound pressure level (SPL)]. Monkeys passively listed to band-limited white noise presented in absence of tone. Rate versus level functions adapt to the mean sound level also in awake, behaving subjects. A: firing rate for a neuron tuned to 2300 Hz. The black line shows neuronal response to a distribution of noise amplitudes centered on 0 dB SPL spectrum level. The red line represents the adapted response of the same neuron to a noise distribution with a mean level of 30 dB SPL spectrum level. Open symbols indicate the response of the same neuron to bursts of noise. The dashed line shows the baseline activity when no noise was played. B: response of an IC neuron with a characteristic frequency (CF) of 1800 Hz.
Fig. 3.
Fig. 3.
Behavioral detection thresholds in the psychophysical tests. Effect of manipulating the mean of the distribution [either 0, 10, 20, or 30 dB sound pressure level (SPL)]. A: example of psychometric functions from monkey D. The symbols represent the data points, and the curve represents the Weibull function fit. The different colors indicate the type of noise used as masker, either gated noise (black symbols) or noise distribution (red symbols). B: averaged data for two monkeys (between 360 and 390 data points). Detection thresholds are plotted as a function of four noise levels. Data illustrates thresholds for different conditions. Three different noise types were presented: steady-state noise (gray symbols), gated noise (black symbols), and noise distribution (red symbols). Tone frequency was 4000 Hz. Error bars represent the 95% CI.
Fig. 4.
Fig. 4.
Behavioral detection thresholds in the psychophysical tests. Effect of changing the variance [the width of the high-probability region was either 6, 12, or 24 dB sound pressure level (SPL)]. A: example of two psychometric functions from monkey D. Closed symbols represent data when the variance of the noise distribution was 6 dB SPL; the open diamonds indicate a variance of 24 dB SPL. B: average psychometric function thresholds and slopes (between 360 and 390 data points) for two monkeys. Tone frequency was 4000 Hz. Error bars represent the 95% confidence interval.
Fig. 5.
Fig. 5.
Reaction times (RTs) to tones as a function of tone levels for the two noise conditions. A: averaged RTs for monkey D. In panel at left, RTs recorded when 0 dB sound pressure level (SPL) bursts of noise were presented (green symbols) versus RTs observed when the noise masker consisted of a distribution of noise amplitudes (gray symbols). In panel at right, RTs are shown for noise levels of 30 dB SPL. B: summary of y-intercepts and RT slopes for both monkeys. Error bars represent the 95% confidence interval.
Fig. 6.
Fig. 6.
Reaction times (RTs) as a function of tone levels for two different variances (widths of the high-probability region). A: averaged data for two monkeys. Blue symbols show RTs for 6-dB variance, and gray symbols show RTs for 24-dB variance. B: summary of y-intercepts and RT slopes for both monkeys. Error bars represent the 95% confidence interval.
Fig. 7.
Fig. 7.
The neuronal firing rate adapts to the statistical properties of the noise background. A: inferior colliculus (IC) responses of two neurons from two monkeys. For each unit, spikes per tone stimulus (over a temporal window of 50 ms) are shown when the mean noise level was 30 dB sound pressure level (SPL). The responses to tones in continuous noise with levels varying every 50 ms are illustrated as gray symbols along with the responses of the same unit to tones in simultaneously gated noise (green symbols). B: distributions of baseline activity for the gated noise (green histogram) and the noise distribution (gray histogram) conditions. C: histogram shows the rate of the masker-induced dynamic range compression that occurred when the background noise was gated with the tones versus when continuous amplitudes of noise were sampled form a distribution. Tone frequency coincided with the characteristic frequency (CF) of each neuron.
Fig. 8.
Fig. 8.
Inferior colliculus (IC) neurons adapt to the characteristic of noise background also in absence of tones. A: neuronal firing rate for catch trials. Response of two IC neurons to noise background when only trials with no tones were played. Neurons show a different pattern of response for the same noise amplitude of 30 dB sound pressure level (SPL) depending on whether the masker was a burst of noise (gated condition, green symbol) or a continuous sequence of noise amplitudes (noise distribution, gray symbols). B: neuronal adaptation to catch trials (only 30 dB SPL noise was presented) did not vary over time.
Fig. 9.
Fig. 9.
Example of inferior colliculus (IC) neuronal responses as function of time. A: spiking activity for both low tones and high tones (left) and peristimulus time histogram (right) when the masker was gated with the signal. The threshold for low-high tones corresponded to the tone level at which the rate level function started to increase from its baseline. B: neuronal response of the same neuron to tones (both low and high) within a distribution of noise amplitudes as function of time (left). The peristimulus time histogram is shown (right) in the same format as A. Neuronal adaptation was observed when low tones were played and was largely induced by the phasic component of the stimulus.
Fig. 10.
Fig. 10.
Relationship between behavioral and neurophysiological responses. A: psychometric thresholds versus neurometric thresholds for distribution noise with a mean of 30 dB sound pressure level (SPL) (gray symbols) and simultaneously gated noise at 30 dB SPL spectrum level (green symbols). B: neurometric thresholds (red squares) obtained in continuous distribution noise versus simultaneously gated noise as a function of noise level. C: neurometric slopes (red diamonds) in continuous distribution noise are plotted against those obtained in gated noise. D: histograms of choice probability (CP). CPs are shown for gated noise (green) and noise distribution (gray) backgrounds. The tone frequency used for behavioral testing always coincided with the characteristic frequency of each neuron.
Fig. 11.
Fig. 11.
Neuronal responses to changes within the variance of the distribution. A: neurometric thresholds were independent of the width of the distribution high-probability region (blue squares). The slope of the neurometric function (gray circles) was significantly higher when the variance of the distribution was relatively low [6 dB sound pressure level (SPL)]. B: histogram shows the ratio of the slope differences between the two conditions.
Fig. 12.
Fig. 12.
Relationship between reaction times (RTs) and inferior colliculus (IC) neuronal spike counts. A: example of RTs plotted as a function of one unit’s spikes. The RT slope was steeper when the noise masker was gated with the tone. Neuronal adaptation was correlated with RTs. B: summary of RT slopes and intercepts for the entire set of neurons. Both the slope and the intercept were significantly different across the two conditions. C: example of RTs regressed against the spike counts of one unit. The RT slope appeared to be steeper when the variance was low. D: summary of RT slopes and intercepts for the entire set of neurons. Although the effect was weak, RT slopes were significantly higher when the variance of the distribution was 6 dB sound pressure level (SPL). Changes in the variance did not significantly affect the y-intercept.

Similar articles

Cited by

References

    1. Barlow HB, Levick WR, Yoon M. Responses to single quanta of light in retinal ganglion cells of the cat. Vision Res 11, Suppl 3: 87–101, 1971. doi:10.1016/0042-6989(71)90033-2. - DOI - PubMed
    1. Bohlen P, Dylla M, Timms C, Ramachandran R. Detection of modulated tones in modulated noise by non-human primates. J Assoc Res Otolaryngol 15: 801–821, 2014. doi:10.1007/s10162-014-0467-7. - DOI - PMC - PubMed
    1. Bregman AS. Auditory Scene Analysis: The Perceptual Organization of Sound. Cambridge, MA: MIT Press, 1990.
    1. Britten KH, Newsome WT, Shadlen MN, Celebrini S, Movshon JA. A relationship between behavioral choice and the visual responses of neurons in macaque MT. Vis Neurosci 13: 87–100, 1996. doi:10.1017/S095252380000715X. - DOI - PubMed
    1. Britten KH, Shadlen MN, Newsome WT, Movshon JA. The analysis of visual motion: a comparison of neuronal and psychophysical performance. J Neurosci 12: 4745–4765, 1992. doi:10.1523/JNEUROSCI.12-12-04745.1992. - DOI - PMC - PubMed

Publication types

LinkOut - more resources