. 2018 Dec 1;120(6):2975-2987.
doi: 10.1152/jn.00500.2018. Epub 2018 Sep 26.

A novel device for real-time measurement and manipulation of licking behavior in head-fixed mice

Affiliations

A novel device for real-time measurement and manipulation of licking behavior in head-fixed mice

Brice Williams et al. J Neurophysiol. .

Abstract

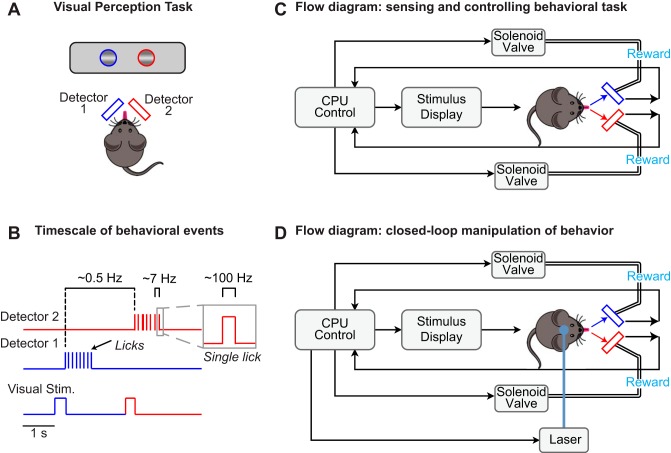
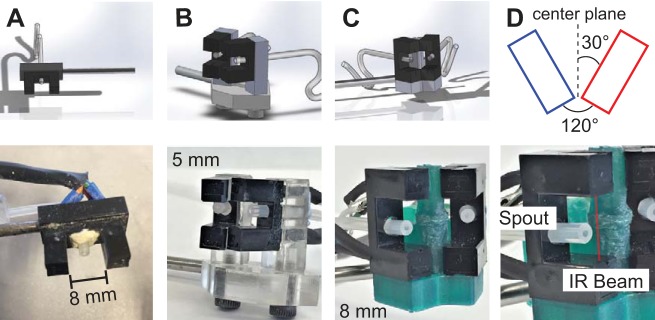
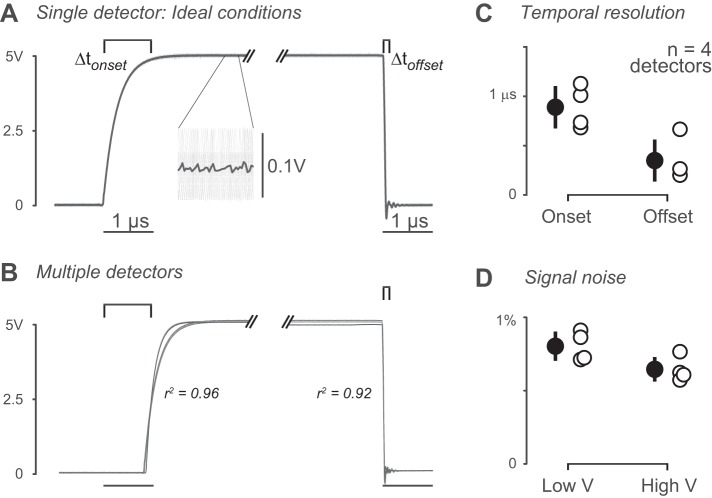
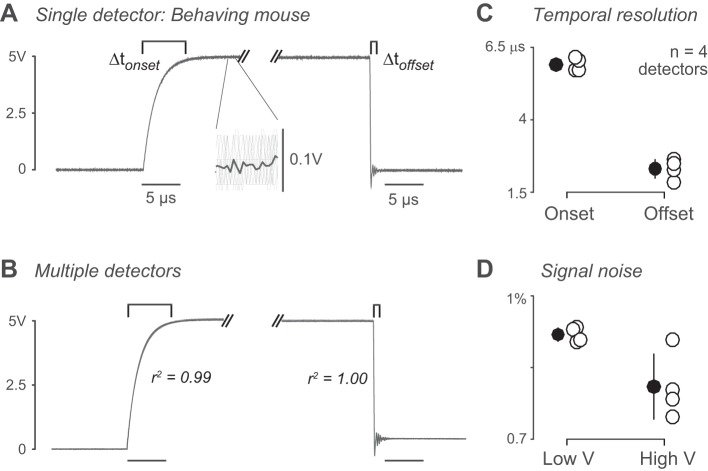
The mouse has become an influential model system for investigating the mammalian nervous system. Technologies in mice enable recording and manipulation of neural circuits during tasks where they respond to sensory stimuli by licking for liquid rewards. Precise monitoring of licking during these tasks provides an accessible metric of sensory-motor processing, particularly when combined with simultaneous neural recordings. There are several challenges in designing and implementing lick detectors during head-fixed neurophysiological experiments in mice. First, mice are small, and licking behaviors are easily perturbed or biased by large sensors. Second, neural recordings during licking are highly sensitive to electrical contact artifacts. Third, submillisecond lick detection latencies are required to generate control signals that manipulate neural activity at appropriate time scales. Here we designed, characterized, and implemented a contactless dual-port device that precisely measures directional licking in head-fixed mice performing visual behavior. We first determined the optimal characteristics of our detector through design iteration and then quantified device performance under ideal conditions. We then tested performance during head-fixed mouse behavior with simultaneous neural recordings in vivo. We finally demonstrate our device's ability to detect directional licks and generate appropriate control signals in real time to rapidly suppress licking behavior via closed-loop inhibition of neural activity. Our dual-port detector is cost effective and easily replicable, and it should enable a wide variety of applications probing the neural circuit basis of sensory perception, motor action, and learning in normal and transgenic mouse models. NEW & NOTEWORTHY Mice readily learn tasks in which they respond to sensory cues by licking for liquid rewards; tasks that involve multiple licking responses allow study of neural circuits underlying decision making and sensory-motor integration. Here we design, characterize, and implement a novel dual-port lick detector that precisely measures directional licking in head-fixed mice performing visual behavior, enabling simultaneous neural recording and closed-loop manipulation of licking.

Keywords: closed-loop optogenetics; head-fixed behavior; licking; mouse; silicon probe.


Figures

Fig. 1.
Fig. 1.
Conceptual diagrams for dual-port lick detection during behavior. A: behavioral task where head-fixed mice report perception of visual stimuli by licking. Gratings appear unpredictably in either the left or right visual fields. Mice report stimulus detection with directional licking (left or right) and receive rewards only at one of the lick ports. Two detectors independently measure licks to each port. B: relevant behavioral events span multiple time scales: directional lick bouts between trials of visual stimulus (Stim.) presentation (~0.5 Hz), detection of individual licks at each detector (~7 licks/s per bout), and rapid onset and offset detection of each individual lick (onset/offset <1-ms resolution; duration ~30 ms). C: conceptual flow diagram for sensing licks and controlling behavioral task parameters. A CPU controls the display of visual stimuli and triggers solenoid valve delivery of rewards upon sensing licks at the appropriate detector only during stimulus display. D: conceptual flow diagram as in C, with addition of closed-loop control of laser light that directly drives or inhibits neural activity upon detection of directional licking.
Fig. 2.
Fig. 2.
Design iterations for dual-port lick detectors. A: the single-port optical lick detector design (top), and implementation during behavioral experiments (bottom). Scale bar indicates 8-mm opening. Elastomer isolates circuitry from silicone tubing dispensing water. B: first iteration of dual-port design (top). Detectors had a 5-mm opening and were mounted on an acrylic base for variable angle and vertical positioning of sensors (bottom). C: final design (top) further optimized after testing with mice. Detectors were widened to 8-mm opening, and 3D-printed base was customized to have a smaller footprint and an optimal fixed angle (120°) between detectors. D: expanded view of detector in C, showing position of infrared (IR) beam and spout.
Fig. 3.
Fig. 3.
Characterization of detectors in ideal conditions. A: example onset and offset curves (Δtonset and Δtoffset, respectively). Low signal = 0 V, high signal = 5 V. Onset is time from 10 to 97% of high signal (0.5 to ~4.88 V). Offset is time from 97% to less than 2% of high signal (4.88 to 0.1 V). Inset shows mean (dark gray) across individual trials (light gray). B: overlaid onset and offset curves of detectors tested in ideal conditions (n = 4). For onset, mean r2 = 0.96 (SD 0.06) (n = 4 detectors, 404 trials). For offset, r2 = 0.92 (SD 0.12) (n = 4 detectors, 404 trials). C: onset and offset time for each detector. Mean onset time = 0.9 (SD 0.21) μs (n = 404 trials, 4 detectors). Mean offset time = 0.35 (SD 0.2) μs (n = 404 trials). D: signal noise for each detector. Mean low signal (0 V) noise = 0.80 (SD 0.10)% (% of high signal, n = 404 trials, 4 detectors). Mean high signal (5 V) noise = 0.65 (SD 0.08)% (n = 404 trials).
Fig. 4.
Fig. 4.
Characterization of detectors during mouse behavior. A: example onset and offset curves (Δtonset and Δtoffset, respectively) of licking recorded in head-fixed mice. Low signal = 0 V, high signal = 4.9 V. Onset is time from 10 to 97% of high signal (0.49 to ~4.75 V). Offset is time from 97% to less than 2% of high signal. Inset shows mean (dark gray) across individual trials (light gray). B: overlaid onset and offset curves of 4 tested detectors. For onset, mean r2 value = 0.99 (SD 0.0001) (n = 4 detectors, 80 trials). For offset, r2 = 1.0 (SD 0.00002 (n = 4 detectors, 80 trials). C: onset and offset time for each detector. Mean onset time = 6.0 (SD 0.23) μs (n = 4 detectors, 80 trials). Mean offset time = 2.3 (SD 0.34) μs (n = 4, 80 trials). See Fig. 5. D: signal noise for each detector. Mean low signal (0 V) noise = 0.92 (SD 0.02)% (% of high signal, n = 4 detectors, 80 trials). Mean high signal (5 V) noise = 0.81 (SD 0.07)% (n = 80 trials). V, Volts.
Fig. 5.
Fig. 5.
Cable length and the delay of signal onset. A: detected onset time increases with increase in cable length between detector and oscilloscope. Onset time was recorded 20 times each for 6 lengths of cable. Mean traces of 20 trials shown for each length. Adding cables elsewhere in the system produces this same effect. B: onset time as a function of cable length in system (shading as in A). Means are 0.76 (SD 0.03), 1.1 (SD 0.06), 1.5 (SD 0.09), 1.9 (SD 0.1), 2.4 (SD 0.18), 2.8 (SD 0.21) μs [mean (SD), n = 20]. Overall, mean onset time is 1.8 (SD 0.76) μs.
Fig. 6.
Fig. 6.
Characterization of lick frequency across detectors. A: example distribution of licking frequency for single lick detector during 75 behavioral sessions over 20 days for 1 mouse (n = 8,995 licks). Mean frequency is 6.4 (SD 1.0) Hz. B: comparison of mean licking frequency for left vs. right licking using the same dual detector across 20 days within the same mouse (n = 3 different mice). Means for left vs. right licking were 6.3 (SD 1.5) vs. 6.4 (SD 1.0) Hz, 7.2 (SD 1.1) vs. 5.8 (SD 1.4) Hz, and 6.4 (SD 1.3) vs. 6.4 (SD 1.0) Hz [left vs. right; mean (SD) within mouse]. Data for the three mice were sampled across 20 days each; 59 (SD 11) sessions; 1,179 (SD 734) left lick bouts; 1,204 (SD 732) right lick bouts; 6,609 (SD 4,425) left licks; 6,041 (SD 2,840) right licks. C: comparison of mean lick frequency for dual and single detectors. Single-detector data was sampled from 10 mice using a single-port detector each for 20 days. Single-detector mean is 7.1 (SD 0.83) Hz; n = 10 mice; 34,009 (SD 12,839 licks). Dual-detector data was sampled from 3 mice using the same dual-port detector for 20 days each. Dual-detector means are as in B, left vs. right. D: comparison of dual-lick latency and dual-lick number outside of visual task. No significant difference in either metric for left vs. right licks (n = 2 mice, 120 trials each).
Fig. 7.
Fig. 7.
Determination of lick bouts and lick frequency within bouts. A: interlick times for all behavioral sessions (n = 24,000 licks; 174 behavioral sessions in 3 mice over 20 days). Time scale is limited to 0–6 s. Behavioral task parameters define interstimulus intervals to fall between 0.5 and 6 s, randomly per trial. Histogram shows >75% of interlick intervals fall below 0.5 s, with no secondary peaks between 0.5 and 6 s. Therefore consecutive licks with intervals <0.5 s were grouped into the same lick bout. B: higher resolution binning of data in A. Local minimum of histogram (0.07 s) defined the upper frequency limit for interlick data within bouts (93% of licks < 15 Hz). C: number of licks per bout following reward delivery during visual task, at left and right detectors. D: cumulative distribution function (CDF) of data in C. Bouts containing 4 or more licks (~95% of data) are considered consummatory lick bouts.
Fig. 8.
Fig. 8.
Dual-port detection during behavior with simultaneous neural recording. A: fully assembled detector during behavioral sessions in a head-fixed mouse. White outline indicates left detector, colored outlines indicate silicone tubing for water delivery at left (blue) and right (red) detector ports. Right detector is invisible in this view. B: example behavioral session, from a different mouse. Top row shows onsets of visual stimuli in left (blue) or right (red) visual fields. Bottom 2 traces show licks detected at each sensor. Individual licks are not visible at this scale. The mouse reports perception of stimulus onset in each location by licking at the appropriate detector. Cyan arrows indicate reward delivery at each individual detector (one reward per correct trial). C: expanded view of session in B, with simultaneous neural recording from anterolateral motor cortex (ALM). Mouse performs 2 correct trials of rightward detection, and then switches to leftward detection on third trial after a few erroneous licks. Local field potential (LFP) recorded with a multisite linear silicon probe throughout the cortical depth of ALM (0.8 mm below surface, 50-μm spacing between contacts) shows no artifacts during licking (see Fig. 9).
Fig. 9.
Fig. 9.
Local field potential (LFP) triggered on detected lick onsets. A: LFP recorded from left anterolateral motor cortex (ALM), triggered on all licks during a single behavioral and recording session (n = 224 left, 156 right). LFP recorded across 32 channels spanning 800 μm was averaged and then aligned ±0.5 s at each lick. Segments were averaged across all lick events. Note absence of transients centered at lick onset (vertical dashed lines; inset shows expanded ±10-ms scale). During the same recording, ipsilateral left licks (blue) also showed no evidence of sharp transients. Contralateral right licks (red) produce rhythmic LFP activation at licking frequency (7.7 Hz), and LFP activation (negativity) precedes time zero, indicating ALM activity precedes detected lick onset. Modulation is absent for ipsilateral licks during the same recording. Single-unit spiking data (not shown here) supported these observations. B: same mouse and same detector during recording in primary visual cortex (V1). Same conventions as in A. Note absence of any sharp transients centered on lick onsets (n = 217 left, 111 right). In V1, there is no ~7 Hz LFP activation associated with motor commands. Same experimental conditions as A. C: LFP spectral power in left ALM during behavioral sessions (n = 4). Note peak ~7 Hz) during right (contralateral, red trace) licks (6.6 (SD 0.6) Hz licking, red arrow). D: same as C, for LFP power in V1 (n = 2 sessions). Note absence of LFP power at licking frequencies (arrows).
Fig. 10.
Fig. 10.
Closed-loop optogenetic stimulation triggered on lick detection. A: schematic for closed-loop sensing and optogenetic perturbation of licking during visual perception. Control signals from either the left or right detectors gate delivery of laser light to the left anterolateral motor cortex (ALM) area involved in generating licking. Light activates inhibitory neurons in a transgenic mouse (Pv-Cre × Ai32-ChR2; see methods). In this configuration, right licks are contralateral to the inhibited cortical region. B: lick-triggered optical inhibition of left motor cortex reduces ipsilateral (left) licks within >100 ms of sensing the first lick within a bout. Interleaved control trials (black) show no deficit. Mean lick times per condition indicated with circles [control: 0.16 (SD 0.16) s; stimulated: 0.13 (SD 0.13) s; n = 14 interleaved behavioral sessions each condition]. Inset shows 5 individual trials for each condition during a single session. C: same experiment, during contralateral right licks. Licking frequency is reduced almost immediately (< 0.01 s), and mean lick time is significantly shorter for lick-triggered laser trials vs. control trials [control: 0.25 (SD 0.2) s; stimulated: 0.09 (SD 0.13) s; n = 7 control sessions; n = 14 interleaved optogenetic sessions] in comparison to ipsilateral licks. Inset shows 5 individual trials (tick marks show individual licks) for each condition during a single session.
Fig. A1.
Fig. A1.
Sensor wiring diagram and circuit schematic.
Fig. A2.
Fig. A2.
Example circuit inputs and outputs.
Fig. A3.
Fig. A3.
Sensor base and suggested gluing locations.
Fig. A4.
Fig. A4.
Power and BNC leads from circuit.
Fig. A5.
Fig. A5.
Sensor connections with 8-wire Ethernet cable.

Similar articles

Cited by

References

    1. Bolus MF, Willats AA, Whitmire CJ, Rozell CJ, Stanley GB. Design strategies for dynamic closed-loop optogenetic neurocontrol in vivo. J Neural Eng 15: 026011, 2018. doi:10.1088/1741-2552/aaa506. - DOI - PMC - PubMed
    1. Boughter JD Jr, Baird JP, Bryant J, St John SJ, Heck D. C57BL/6J and DBA/2J mice vary in lick rate and ingestive microstructure. Genes Brain Behav 6: 619–627, 2007. doi:10.1111/j.1601-183X.2006.00293.x. - DOI - PubMed
    1. Burgess CP, Lak A, Steinmetz NA, Zatka-Haas P, Bai Reddy C, Jacobs EAK, Linden JF, Paton JJ, Ranson A, Schröder S, Soares S, Wells MJ, Wool LE, Harris KD, Carandini M. High-yield methods for accurate two-alternative visual psychophysics in head-fixed mice. Cell Reports 20: 2513–2524, 2017. doi:10.1016/j.celrep.2017.08.047. - DOI - PMC - PubMed
    1. Chen JL, Pfäffli OA, Voigt FF, Margolis DJ, Helmchen F. Online correction of licking-induced brain motion during two-photon imaging with a tunable lens. J Physiol 591: 4689–4698, 2013. doi:10.1113/jphysiol.2013.259804. - DOI - PMC - PubMed
    1. Guo ZV, Hires SA, Li N, O’Connor DH, Komiyama T, Ophir E, Huber D, Bonardi C, Morandell K, Gutnisky D, Peron S, Xu NL, Cox J, Svoboda K. Procedures for behavioral experiments in head-fixed mice. PLoS One 9: e88678, 2014b. [Erratum in PLOS One 9: e101397; 10.1371/journal.pone.0101397] 10.1371/journal.pone.0088678. - DOI - PMC - PubMed

Publication types

LinkOut - more resources