Clinical Trial
. 2018 Sep 26;13(9):e0202398.
doi: 10.1371/journal.pone.0202398. eCollection 2018.

Positive and negative hysteresis effects for the perception of geometric and emotional ambiguities

Affiliations
Clinical Trial

Positive and negative hysteresis effects for the perception of geometric and emotional ambiguities

Emanuela Liaci et al. PLoS One. .

Abstract

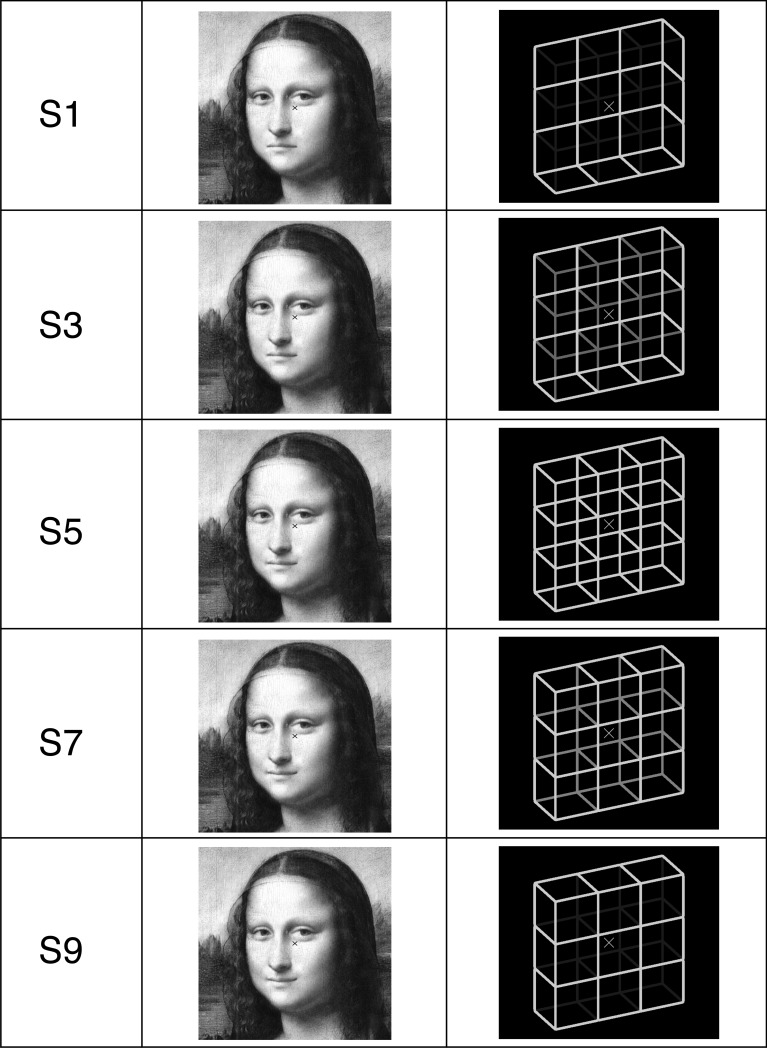
Aim: The present study utilizes perceptual hysteresis effects to compare the ambiguity of Mona Lisa's emotional face expression (high-level ambiguity) and of geometric cube stimuli (low-level ambiguity).

Methods: In two experiments we presented series of nine Mona Lisa variants and nine cube variants. Stimulus ambiguity was manipulated by changing Mona Lisa's mouth curvature (Exp. 1) and the cubes' back-layer luminance (Exp. 2). Each experiment consisted of three conditions, two with opposite stimulus presentation sequences with increasing and decreasing degrees of ambiguity, respectively, and a third condition with a random presentation sequence. Participants indicated happy or sad face percepts (Exp. 1) and alternative 3D cube percepts (Exp. 2) by key presses. We studied the influences of a priori perceptual biases (long-term memory) and presentation order (short-term memory) on perception.

Results: Perception followed sigmoidal functions of the stimulus ambiguity morphing parameters. The morphing parameter for the functions' inflection points depended strongly on stimulus presentation order with similar effect sizes but different signs for the two stimulus types (positive hysteresis / priming for the cubes; negative hysteresis / adaptation for Mona Lisa). In the random conditions, the inflection points were located in the middle between those from the two directional conditions for the Mona Lisa stimuli. For the cube stimuli, they were superimposed on one sigmoidal function for the ordered condition.

Discussion: The hysteresis effects reflect the influence of short-term memory during the perceptual disambiguation of ambiguous sensory information. The effects for the two stimulus types are of similar size, explaining up to 34% of the perceptual variance introduced by the paradigm. We explain the qualitative difference between positive and negative hysteresis with adaptation for Mona Lisa and with priming for the cubes. In addition, the hysteresis paradigm allows a quantitative determination of the impact of adaptation and priming during the resolution of perceptual ambiguities. The asymmetric shifts of inflection points in the case of the cube stimuli is likely due to an a priori perceptual bias, reflecting an influence of long-term memory. Whether corresponding influences also exist for the Mona Lisa variants is so far unclear.


Conflict of interest statement

The authors have declared that no competing interests exist.

Figures

Fig 1
Fig 1. Five of the Mona Lisa and Necker lattice variants (left column, S1, S3, S5, S7 and S9) used in Experiments 1 and 2.
Fig 2
Fig 2. Perceptual hysteresis effect.
Perception (ordinate) changes as a sigmoidal function of changing luminance S of the cube’s back-layer as stimulus morphing parameter. The hysteresis paradigm consists of two conditions (red and blue traces) with sequential stimulus presentation, with a stepwise increase (from S1 to S5) and thereafter a decrease (S5 to S9) of stimulus ambiguity. The resulting sigmoid functions change as a function of stimulus presentation order (blue trace: starting with S1; red trace: starting with S9 as indicated by the blue and red arrows). The horizontal distance between the inflection points of the two (blue and red) curves is the hysteresis distance and reflects the influence of immediately past perceptual history, stored in STM. Presenting the stimuli S1 to S9 in random sequence and averaging across repetitions eliminates the influence of STM. The resulting inflection point should thus be located at Sa related to the physically most ambiguous reference cube (Necker cube, Sa = S5). (a) Short-term memory with adaptation impact. The ordered stimulus presentation shifts the sigmoid function toward the direction opposite to stimulus presentation order, with respect to the random condition (black trace). In this case perception already alternates even though the observed stimulus still contains cues favoring the initial percept (S4 for the blue trace and S6 for the red trace). According to a predefined calculation rule (inflection point value from the blue minus inflection point value from the red trace), the hysteresis distance has a negative sign; therefore the effect is called negative hysteresis. (b) Short-term memory with priming impact. The ordered stimulus presentation shifts the sigmoid function toward the direction of the stimulus presentation order, with respect to the random condition (black trace). In this case the percept only alternates when the observed stimulus already contains cues favoring the alternative percept (S6 for the blue trace and S4 for the red trace). The hysteresis distance between the locations of the inflection points for blue minus red traces is positive; therefore the effect is called positive hysteresis.
Fig 3
Fig 3. With a randomized stimulus presentation sequence (black trace) the influence of perceptual STM should disappear after averaging across repetitions.
Accordingly the inflection point from the random sigmoid function should be located at the physically most ambiguous cube (the Necker cube, Sa = S5), serving as a reference stimulus. However, perception of the Necker cube is known to be biased towards the front-side down perspective (FDP), reflecting the contribution of LTM during perceptual disambiguation. This perceptual bias will be indicated by larger probabilities for cube percepts favoring the FDP interpretation. As a consequence, the inflection point of the related sigmoid function, indicating the perceptually most ambiguous cube variant (between S3 and S4) will already contain 3D cues favoring the non-preferred FUP interpretation. This results in a horizontal shift of the sigmoid function from the random condition (S4 in a and S3 in b, black trace). (a) Assuming an additive impact of FSTM and FLTM during the perceptual process, the sigmoid functions from the two ordered conditions should be shifted by the same amount and in the same direction as the sigmoid function from the random condition. (b) However, there must be a threshold for memory contribution to the perceptual process: If this threshold Sthres is approached by FLTM (i.e. if the bias is strong enough), the effective influence of STM (FSTM pointing in the same direction as FLTM) on the sigmoid function will attenuate, and FLTM and FSTM influences become subadditive. The related sigmoid function will then be closer to the one from random presentation order, as indicated by the red shaded traces. In the extreme case of very strong bias, the two sigmoid functions may coincide.
Fig 4
Fig 4
Gray-scale version (S9) of Da Vinci’s original Mona Lisa painting (left) and a magnified excerpt of the mouth region (right). Left: The five orange circles indicate the locations at which luminance was measured. Right: The blue arrows indicate the trajectories of the mouth corner locations of the sadder stimulus variants used in the present experiment. The blue filled circles indicate the left and right mouth corners of the central Mona Lisa S5 variant in the middle of the stimulus range.
Fig 5
Fig 5
Procedures of Experiments 1 (top) and 2 (bottom). Each stimulus variant was presented for 1200 ms, followed by a screen showing either a gray background similar to the background of the Mona Lisa stimulus (Experiment 1) or a dark gray background identical to the background darkness of the lattice stimuli. S = stimulus, G = gap.
Fig 6
Fig 6. Top graph: Grand mean probability of happy face percepts (filled dots) ± SEM (ordinate) and sigmoidal fits from the sad→happy (blue trace), sad←happy (red trace) and random (black trace) conditions.
A clear negative hysteresis effect is visible: the sigmoids from the differently-ordered stimulus presentation conditions (indicated in blue and red) are horizontally shifted with respect to one another. The sigmoid from the random condition (black trace) shows a mid position in between the two sigmoids from the ordered conditions. This mid position indicates that memory contribution to the perceptual resolution of ambiguity has not yet reached a threshold. The green difference trace results from a subtraction of the blue trace minus the red trace, indicating the percentage of perceptual variances for individual stimulus variants. Bottom graph: The reaction times (ordinate on the left) related to the perception responses. Reaction times increase with perceptual instability. Furthermore a temporal preparation effect was observed: Less temporal preparation is possible for the first stimulus within an ordered presentation sequence, resulting in longer reaction times compared to the subsequent reaction times.
Fig 7
Fig 7. Scatter plot of the sigmoidal fit function parameters of the sad←happy and sad→happy conditions for each individual participants (filled icons).
Orange squares: gradients; cornflower circles: inflection points. Open icons indicate grand means ± SEMs. All cornflower icons are above the bisection line, indicating consistently larger inflection points for the sad←happy condition than for the sad→happy condition.
Fig 8
Fig 8. Top graph: Grand mean probability of front-side-down percepts (FDP, filled dots) ± SEM (ordinate) and sigmoidal fits from the FUS←FDS (red trace), FUS→FDS (blue trace) and random (black trace) conditions.
A clear positive hysteresis effect is visible: The sigmoids from the different ordered stimulus presentation conditions (blue and red traces) are horizontally shifted against each other. There are two remarkable observations: (1) The sigmoid’s inflection point from the random condition is not located at the physically most ambiguous reference stimulus (the Necker lattice, S5) but instead at a stimulus already containing strong FU-cues (close to S3), reflecting the a priori bias from LTM. (2) The sigmoid from the FUS←FDS condition (red trace) is superimposed on the sigmoid from the random condition (black trace), indicating that the LTM contribution to the perceptual resolution of ambiguity has already reached a threshold and STM can no longer contribute. The green difference trace results from subtracting the blue trace from the red trace, indicating the percentage of perceptual variance for individual stimulus variants. Bottom graph: Reaction times (ordinate on the left) to the perception responses. Reaction times increased with perceptual instability. Further, a temporal preparation effect was apparent: Less temporal preparation is possible for the first stimulus within an ordered presentation sequence, resulting in longer reaction times.
Fig 9
Fig 9. Scatter plot of the sigmoidal fit function parameters of the FUS←FDS and FUS→FDS conditions for the individual participants.
Orange squares: Gradient values; cornflower circles: Inflection Point values. Open icons indicate grand means ± SEMs. Most cornflower icons are below the bisection line, indicating that the inflection points from the FUS←FDS condition show smaller values than from the FUS→FDS condition.

Similar articles

Cited by

References

    1. Kornmeier J, Mayer G. The alien in the forest OR when temporal context dominates perception. Perception. 2014;43: 1270–1274. 10.1068/p7844 - DOI - PubMed
    1. Deutsch D. An auditory illusion. Nature. 1974;251: 307–309. 10.1038/251307a0 - DOI - PubMed
    1. Liaci E, Bach M, Tebartz van Elst L, Heinrich SP, Kornmeier J. Ambiguity in Tactile Apparent Motion Perception. Herzog MH, editor. PLOS ONE. 2016;11: e0152736 10.1371/journal.pone.0152736 - DOI - PMC - PubMed
    1. Pressnitzer D, Hupé J-M. Temporal Dynamics of Auditory and Visual Bistability Reveal Common Principles of Perceptual Organization. Curr Biol. 2006;16: 1351–1357. 10.1016/j.cub.2006.05.054 - DOI - PubMed
    1. Rubin E. Visuell wahrgenommene Figuren Copenhagen: Gyldendals; 1921.

Publication types

LinkOut - more resources