. 2018 Sep 26;14(9):e1007686.
doi: 10.1371/journal.pgen.1007686. eCollection 2018 Sep.

Genetic basis of thermal plasticity variation in Drosophila melanogaster body size

Affiliations

Genetic basis of thermal plasticity variation in Drosophila melanogaster body size

Elvira Lafuente et al. PLoS Genet. .

Abstract

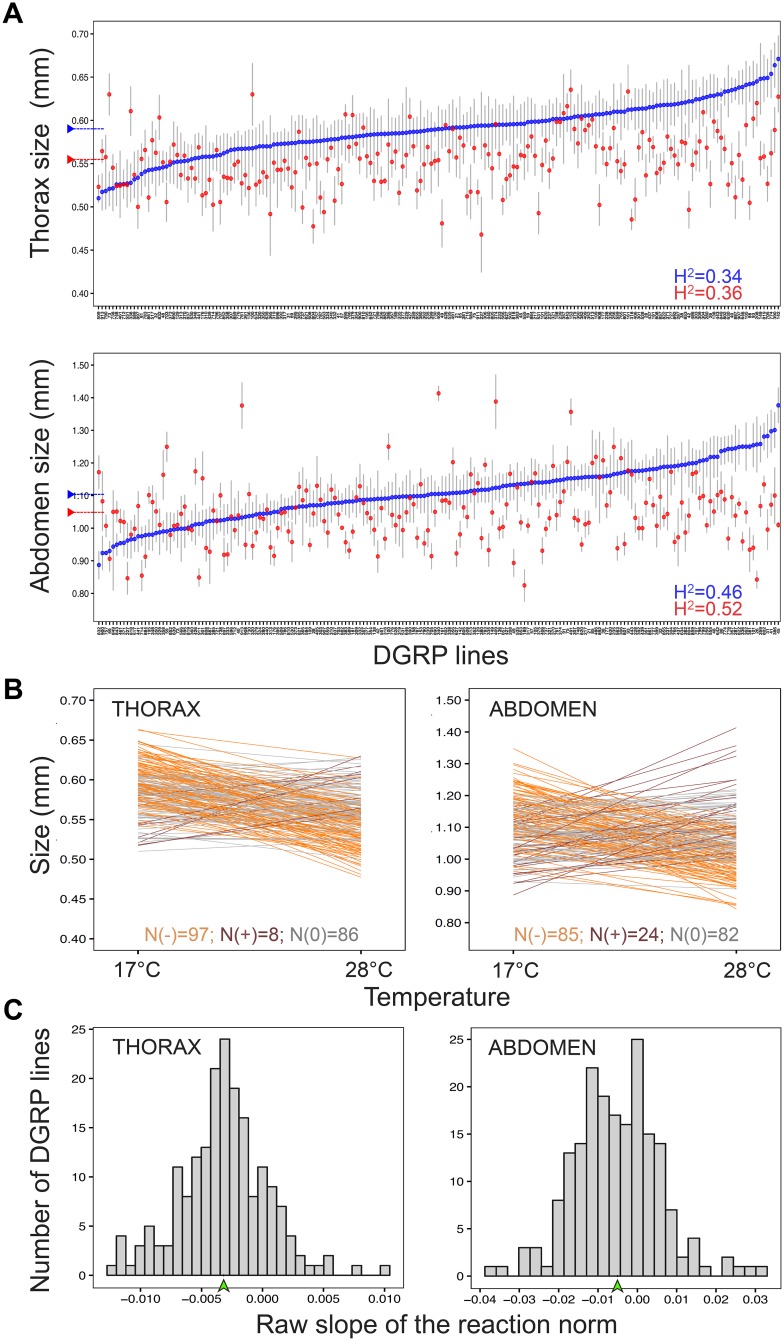
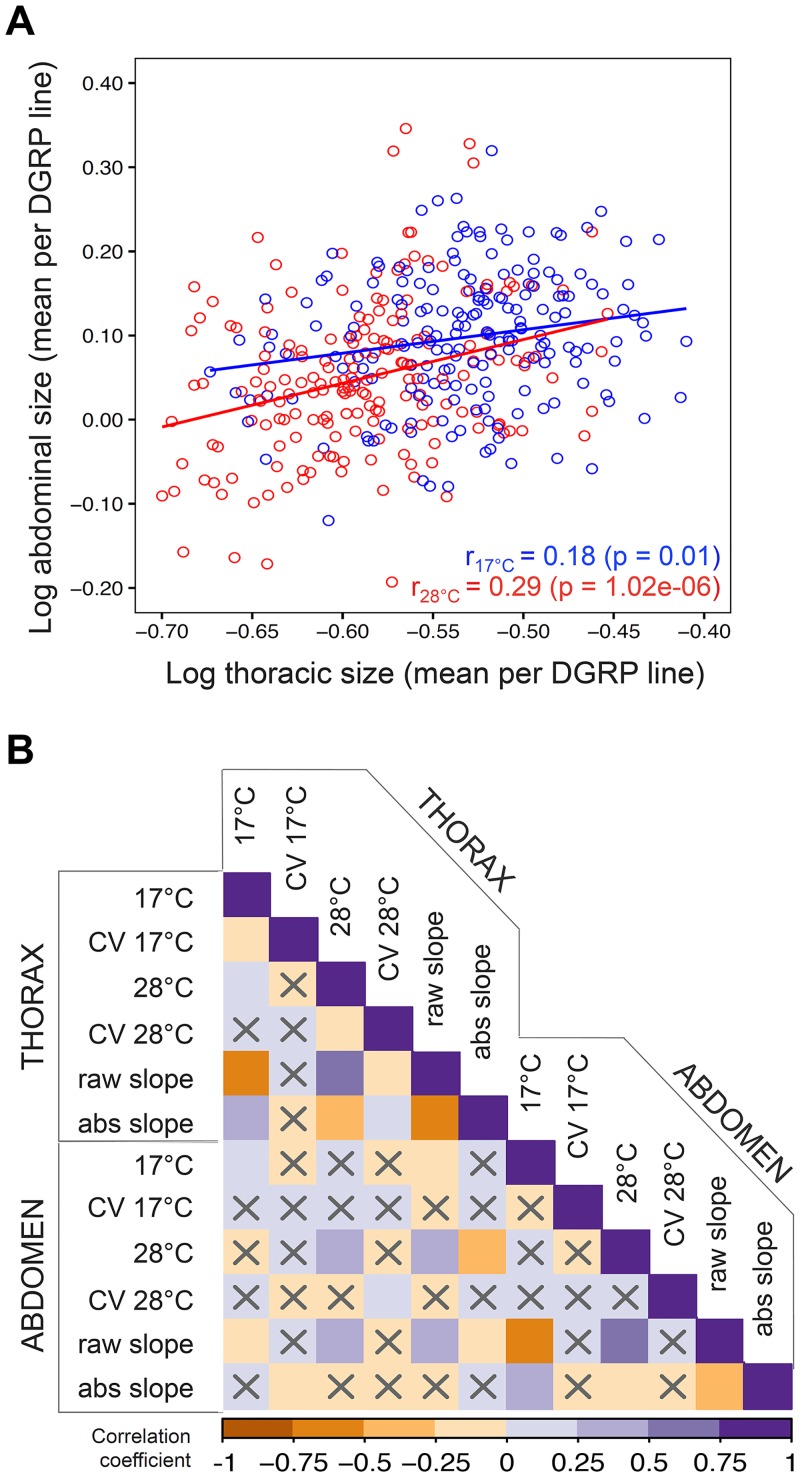
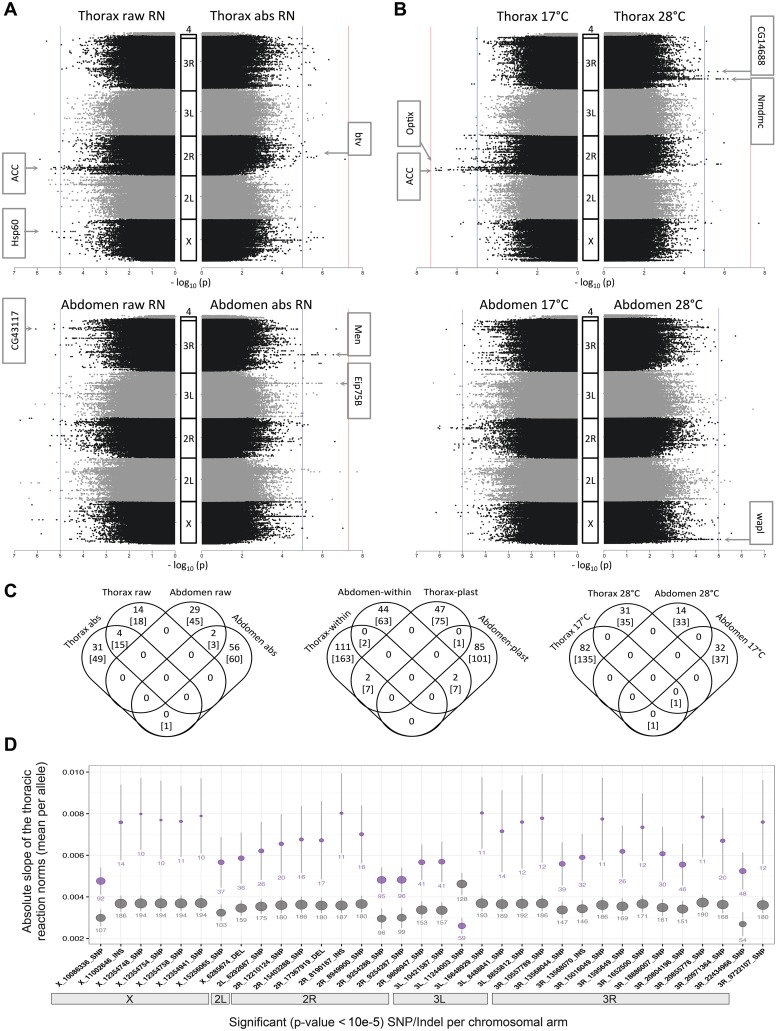
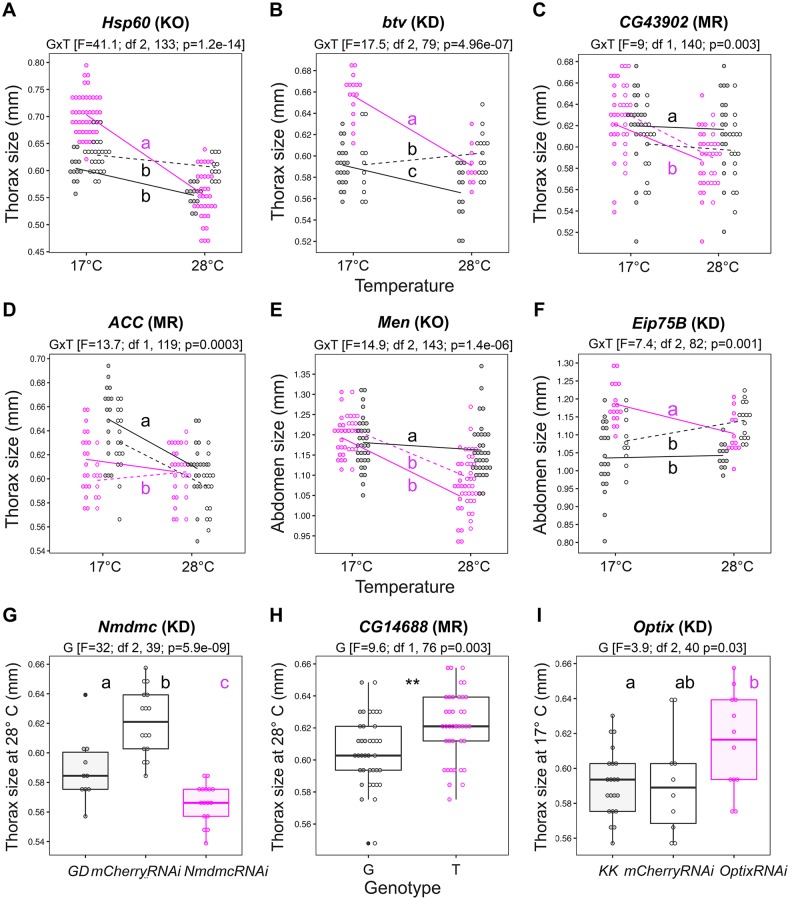
Body size is a quantitative trait that is closely associated to fitness and under the control of both genetic and environmental factors. While developmental plasticity for this and other traits is heritable and under selection, little is known about the genetic basis for variation in plasticity that can provide the raw material for its evolution. We quantified genetic variation for body size plasticity in Drosophila melanogaster by measuring thorax and abdomen length of females reared at two temperatures from a panel representing naturally segregating alleles, the Drosophila Genetic Reference Panel (DGRP). We found variation between genotypes for the levels and direction of thermal plasticity in size of both body parts. We then used a Genome-Wide Association Study (GWAS) approach to unravel the genetic basis of inter-genotype variation in body size plasticity, and used different approaches to validate selected QTLs and to explore potential pleiotropic effects. We found mostly "private QTLs", with little overlap between the candidate loci underlying variation in plasticity for thorax versus abdomen size, for different properties of the plastic response, and for size versus size plasticity. We also found that the putative functions of plasticity QTLs were diverse and that alleles for higher plasticity were found at lower frequencies in the target population. Importantly, a number of our plasticity QTLs have been targets of selection in other populations. Our data sheds light onto the genetic basis of inter-genotype variation in size plasticity that is necessary for its evolution.


Conflict of interest statement

The authors have declared that no competing interests exist.

Figures

Fig 1
Fig 1. Natural genetic variation in size and size plasticity.
A. Means and 95% confidence intervals (Y axis) for thorax (upper panel) and abdomen (lower panel) size in the DGRP lines (X axis) reared either at 17°C (blue) or at 28°C (red). DGRP lines are ranked by their mean size at 17°C. Dashed horizontal bar represents the mean value for all DGRP lines at a given temperature. Mean values (μ) and broad sense heritability (H2) estimates per body part and temperature can be found in Table 1. B. Reaction norms for thorax and abdomen sizes (Y axis) across temperatures (X axis) plotted as the regression fit for the model lm (Size ~ Temperature) for each DGRP line. Reaction norms are colored by in relation to slope: slopes significantly different from zero are orange when positive and brown when negative, while slopes that were not significantly different from zero are gray (alpha = 0.05). Counts of each are shown on the bottom of each graph. Broad sense heritability estimates were: H2 = 0.33 (thorax plasticity) and H2 = 0.48 (abdomen plasticity). C. Frequency distribution for the raw value of the slope of the reaction norm in the DGRP lines. The mean value for the raw slope of all DGRP reaction norms is indicated with a green arrowhead.
Fig 2
Fig 2. Phenotypic co-variation in size and size plasticity.
A. Thoracic (X axis) and abdominal (Y axis) mean size per DGRP line at 17°C (blue) and at 28°C (red). Pearson correlation, r = 0.18 (p-value = 0.01) and partial Pearson correlation, r = 0.34 (p-value = 1.02e-06) for 17°C, Pearson correlation r = 0.29 (p-value < 2e-16) and partial Pearson correlation r = 0.34 (p-value < 2e-16) for 28°C. B. Heat map of Pearson’s correlation coefficients between our measurements in thoraxes and abdomens: mean sizes and coefficients of variation (CV) at each temperature and raw and absolute slopes of the reactions norms. Non-significant correlations (p-value < 0.01) are indicated with an ‘X’.
Fig 3
Fig 3. Genetic variants influencing size and size plasticity.
A-B. Manhattan plots corresponding to the eight GWAS analyses performed. Horizontal lines are p-value < 10e-5 (blue) and p-value < 10e-8 (red). Gene names are shown for a subsample of significant SNPs/Indels, which were selected based on p-value, putative variant effect and associated genes (S3 and S4 Tables). A. GWAS for variation in size plasticity in thoraxes (upper panels) and abdomens (lower panels) and for either the raw (left) or the absolute (right) slopes of the reaction norms. B. GWAS for variation in size in thoraxes (upper panels) and abdomens (lower panels) at 17°C (left panels) or 28°C (right panels). C. Venn diagrams showing the number of candidate SNPs/Indels (number outside the brackets) and candidate genes (number within brackets) harboring those polymorphisms identified in the different GWAS. D. Mean and 95% confidence interval of the absolute slope of the reaction norms for thorax size (Y axis) per allele (major allele in gray, minor allele in magenta) for each candidate plasticity QTL along the chromosomal arms (X axis). The position and identity of the polymorphisms in this figure is given by their annotation with Genome Release v.5.
Fig 4
Fig 4. Functional validation of selected QTLs from GWAS analyses.
The name of the candidate gene and the method—mutant (KO), RNAi (KD), or Mendelian Randomization (MR)—to test the different candidate QTLs is shown above each plot. For validations via mutant or RNAi, genotypes with impaired gene function are shown in magenta and control genotypes are shown in black. Similarly, for validations via Mendelian Randomization, the two populations fixed for the minor allele are shown in magenta and the two populations for the major allele are shown in black. A. Reaction norms in mutant Hsp60A/+ and controls Canton-S (filled circles, solid line) and Fm7a/Canton-S (empty circles, dashed line). B. Reaction norms in btv-RNAi/bab-Gal4 and control lines KK (filled circles, solid line) and mCherry-RNAi/bab-Gal4 (empty circles, dashed line). C. Reaction norms in the four MR populations for SNP X:10192303 within gene CG43902. D. Reaction norms in the four MR populations for SNP 2R:7983239 within gene ACC. E. Reaction norms in Men mutants MenEx3/+ (filled circles, solid line) and MenEx55/+ (empty circles, dashed line) and control line w1118. F. Reaction norms in Eip75B-RNAi/bab-Gal4 and control lines KK (filled circles, solid line) and mCherry-RNAi/bab-Gal4 (empty circles, dashed line). G. Size at 28°C in Nmdmc-RNAi/tub-Gal4 and control lines GD (filled circles) and mCherry-RNAi/tub-Gal4 (empty circles). H. Size at 28°C in the four MR populations for SNP 3R:10678848 within gene CG14688. I. Size at 17°C in Optix-RNAi/bab-Gal4 and control lines KK (filled circles) and mCherry-RNAi/bab-Gal4 (filled circles). For the validations of plasticity QTLs, we tested the model lm (Size ~ Genotype*Temperature) and for the validations of within-environment QTLs we tested the model lm (Trait ~ Genotype). Results from the statistical models are shown above each plot and, when significant, indicated by asterisks in the plot (where p-values < 0.001 and < 0.01 are denoted by '***' and '**', respectively). Differences for more than two groups were estimated by post hoc comparisons (Tukey’s honest significant differences) and are indicated by different letters in each plot (p-value < 0.01). For all tested SNPs/genes, the phenotype of the DGRP lines carrying the minor versus the major allele at the target QTL can be found in S7 Fig.

Similar articles

Cited by

References

    1. Kingsolver JG, Huey RB. Size, temperature, and fitness: three rules. Evol Ecol Res. 2008;10:251–268.
    1. Peters RH. The ecological implications of body size. Cambridge: Cambridge University Press; 1986. 329 p.
    1. Ripple WJ, Wolf C, Newsome TM, Hoffmann M, Wirsing AJ, McCauley DJ. Extinction risk is most acute for the world’s largest and smallest vertebrates. Proc Natl Acad Sci U S A. 2017. September 18;114(40):10678–83. 10.1073/pnas.1702078114 - DOI - PMC - PubMed
    1. Smith FA, Lyons SK. Animal body size: linking pattern and process across space, time, and taxonomic group. University of Chicago Press; 2013. 267 p.
    1. Woodward G, Ebenman B, Emmerson M, Montoya J, Olesen J, Valido A, et al. Body size in ecological networks. Trends Ecol Evol. 2005. July;20(7):402–9. 10.1016/j.tree.2005.04.005 - DOI - PubMed

Publication types

LinkOut - more resources