. 2018 Sep 26;16(9):e2004874.
doi: 10.1371/journal.pbio.2004874. eCollection 2018 Sep.

mDia1/3 generate cortical F-actin meshwork in Sertoli cells that is continuous with contractile F-actin bundles and indispensable for spermatogenesis and male fertility

Affiliations

mDia1/3 generate cortical F-actin meshwork in Sertoli cells that is continuous with contractile F-actin bundles and indispensable for spermatogenesis and male fertility

Satoko Sakamoto et al. PLoS Biol. .

Abstract

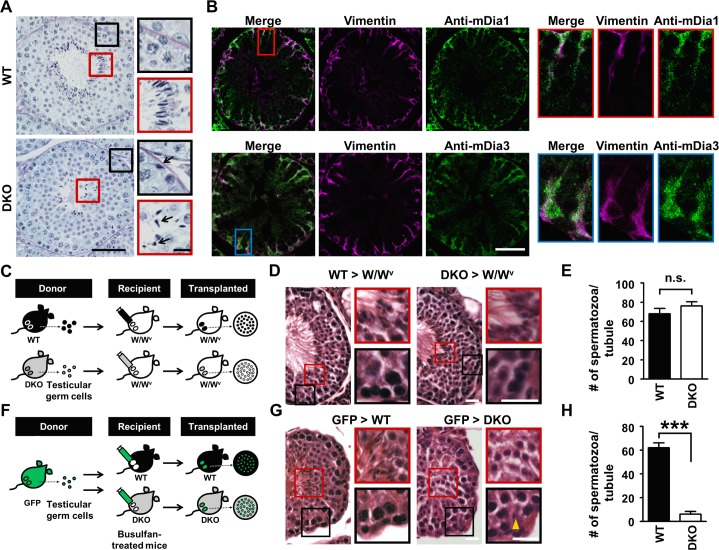
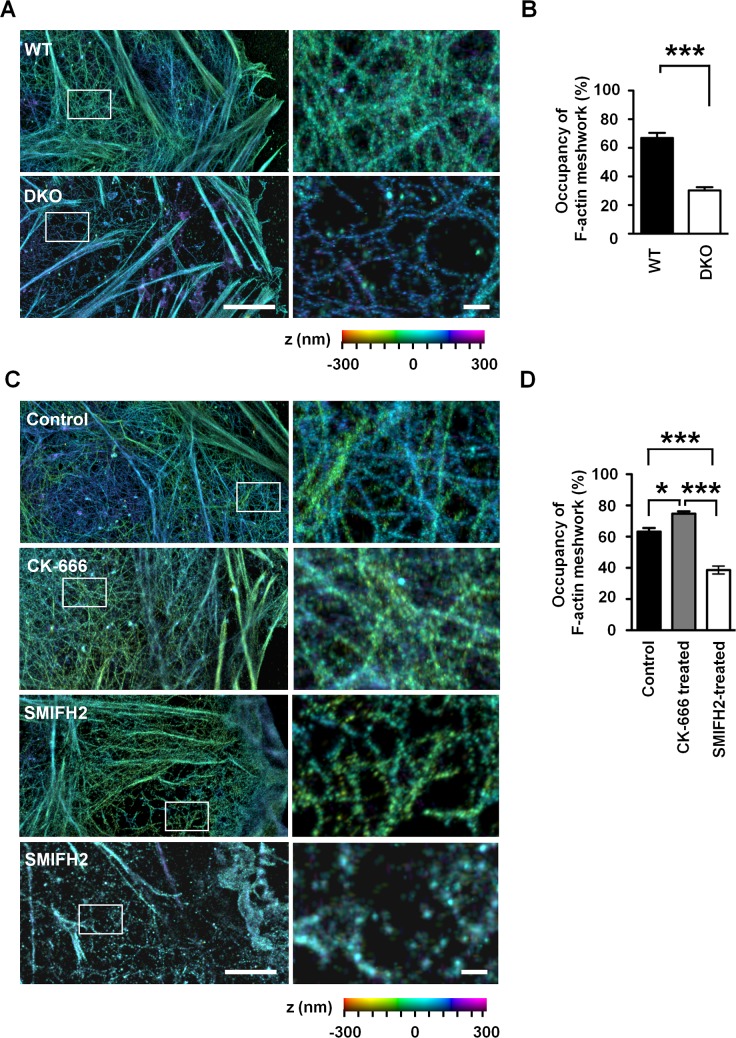
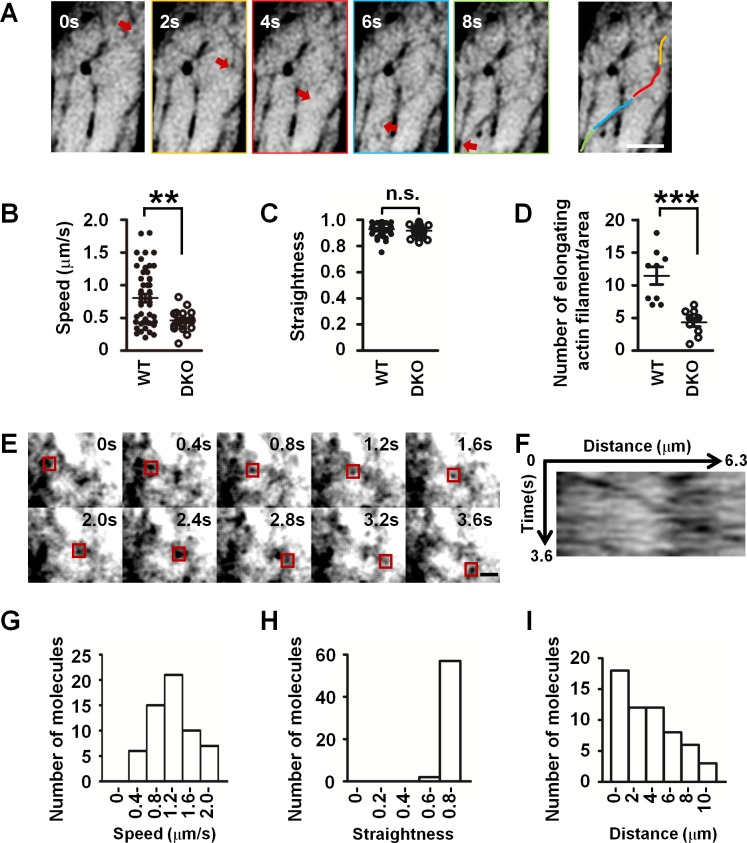
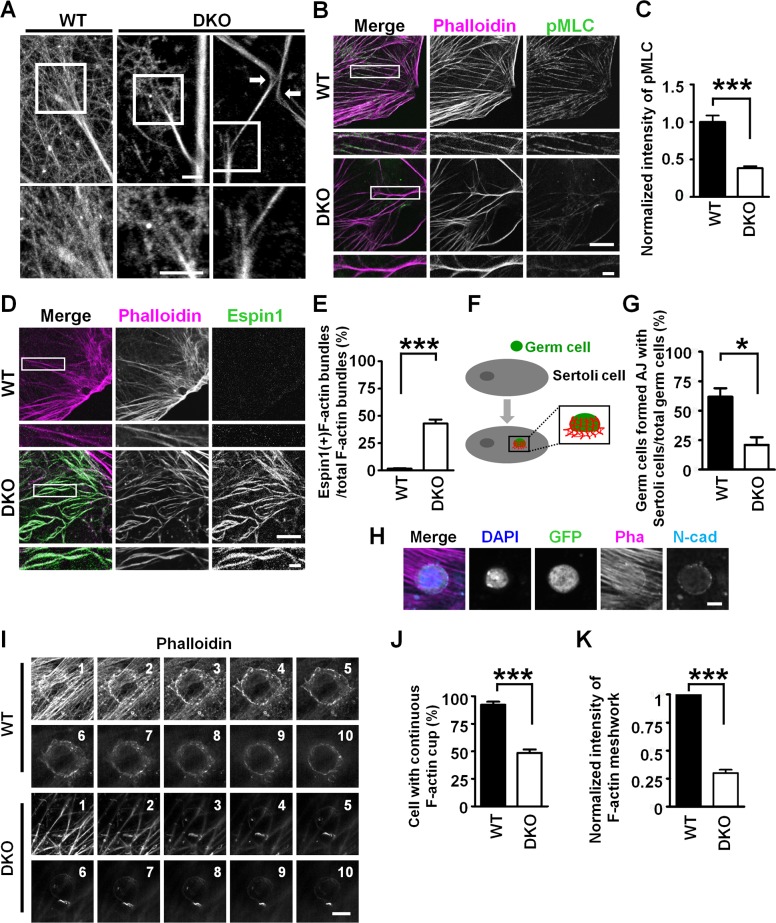
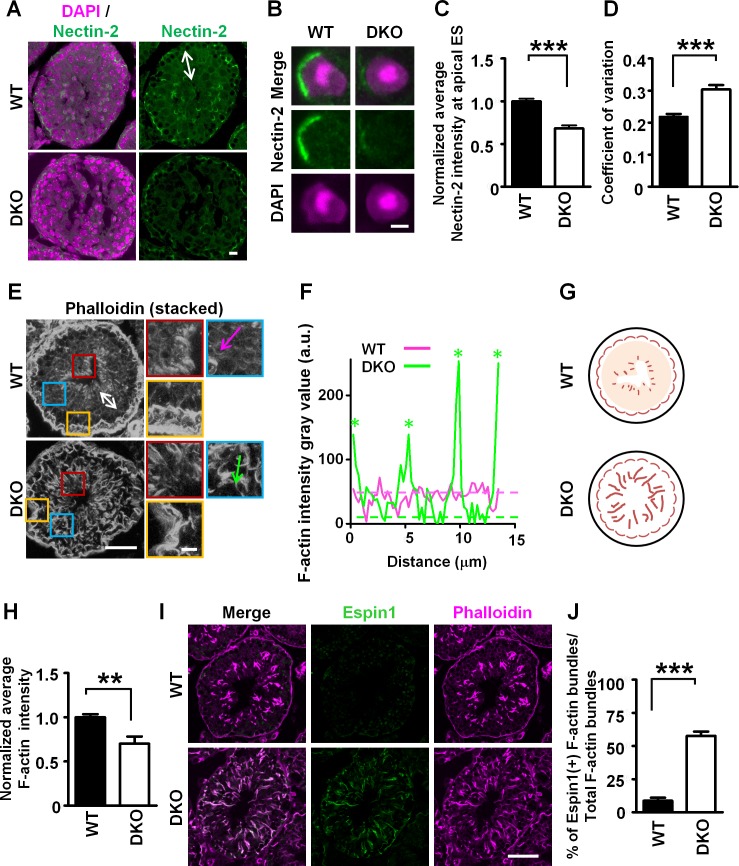
Formin is one of the two major classes of actin binding proteins (ABPs) with nucleation and polymerization activity. However, despite advances in our understanding of its biochemical activity, whether and how formins generate specific architecture of the actin cytoskeleton and function in a physiological context in vivo remain largely obscure. It is also unknown how actin filaments generated by formins interact with other ABPs in the cell. Here, we combine genetic manipulation of formins mammalian diaphanous homolog1 (mDia1) and 3 (mDia3) with superresolution microscopy and single-molecule imaging, and show that the formins mDia1 and mDia3 are dominantly expressed in Sertoli cells of mouse seminiferous tubule and together generate a highly dynamic cortical filamentous actin (F-actin) meshwork that is continuous with the contractile actomyosin bundles. Loss of mDia1/3 impaired these F-actin architectures, induced ectopic noncontractile espin1-containing F-actin bundles, and disrupted Sertoli cell-germ cell interaction, resulting in impaired spermatogenesis. These results together demonstrate the previously unsuspected mDia-dependent regulatory mechanism of cortical F-actin that is indispensable for mammalian sperm development and male fertility.


Conflict of interest statement

DT and SN were supported by the Coordination Fund from MEXT and Astellas Pharma. SN is a scientific advisor to Astellas Pharma. Other authors declare that they have no conflicts of interest.

Figures

Fig 1
Fig 1. mDia1 and mDia3 are dominantly expressed in Sertoli cells and indispensable for spermatogenesis.
(A) PAS-stained stage VIII seminiferous tubule sections from adult WT and mDia1/3 DKO mice. The red (apical region) and black (basal region) boxes are magnified images of the corresponding boxed areas of the lower magnification. Note that in mDia1/3 DKO mice, differentiated sperms are decreased in number and not properly orientated at the lumen of the seminiferous tubule (black arrows, red box), and elongated spermatids are ectopically localized proximal to the basal lamina (black arrow, black box). Scale bars, 50 μm (left) and 10 μm (right). (B) Immunofluorescence staining for mDia1 or mDia3 (green) and vimentin (magenta), a marker for Sertoli cells, in testis sections from WT adult mice. Note the strong mDia1 and mDia3 immunostaining signals in the cytoplasm of Sertoli cells. Scale bar, 100 μm. The red and blue boxes are magnified images of the corresponding boxed areas of the lower magnification. (C) Schematic representation of testicular germ cell suspensions from WT or mDia1/3 DKO mice transplanted into the Sertoli cell-only testes of sterile W/WV mutant mice. (D) HE-stained testis sections from W/Wv mice transplanted with WT or mDia1/3 DKO testicular germ cell suspensions. Note that the histology of W/Wv mouse testes transplanted with mDia1/3 DKO testicular cell suspensions exhibits apparently normal spermatogenesis. Scale bars, 25 μm. The red and black boxes are magnified images of the corresponding boxed areas of the lower magnification. (E) Quantification of the number of spermatozoa per seminiferous tubule in W/Wv mice transplanted with WT testicular germ cell suspensions (13 tubules of two mice) or mDia1/3 DKO testicular germ cell suspensions (17 tubules of two mice). Data are represented as mean ± SEM. (F) Schematic representation of the transplantation of testicular germ cell suspensions from acro/act-EGFP mice into the busulfan-treated Sertoli cell-only testes of WT or mDia1/3 DKO mice. (G) HE-stained testis sections from WT or mDia1/3 DKO mice transplanted with acro/act-EGFP mice-derived testicular germ cell suspensions. Note that mDia1/3 DKO mouse testis transplanted with acro/act-EGFP mice-derived testicular germ cell suspensions exhibits histologically abnormal spermatogenesis, similar to mDia1/3 DKO mouse testis. Scale bars, 25 μm. The red and black boxes are magnified images of the corresponding boxed areas of the lower magnification. Yellow arrowhead indicates ectopic localization of sperm near the basal lamina of mDia1/3 DKO seminiferous tubule. (H) Quantification of the number of spermatozoa per seminiferous tubule in busulfan-treated testes of WT mice (20 tubules of three mice) or mDia1/3 DKO mice (15 tubules of two mice) transplanted with acro/act-EGFP mice-derived testicular germ cell suspensions. Data are represented as mean ± SEM. ***P < 0.001 (Student t test). acro/act-EGFP, acrosin/actin-enhanced green fluorescent protein; DKO, double knockout; GFP, green fluorescent protein; HE, hematoxylin–eosin; mDia1, mammalian diaphanous homolog1; mDia3, mammalian diaphanous homolog3; n.s., not significant (P = 0.2675, Student t test); PAS, Periodic acid-Schiff; WT, wild-type.
Fig 2
Fig 2. mDia1/3-dependent cortical F-actin meshwork in primary cultured Sertoli cells.
(A) TIRF 3D-N-STORM imaging of the actin filaments in WT primary cultured Sertoli cells. The images on the right side are magnified images of the corresponding white boxed areas of the lower magnification. Color bar indicates the z dimension (−300 nm to 300 nm). Scale bars, 5 μm (left) and 500 nm (right). (B) Quantification of the ratio of F-actin meshwork occupancy per cell area in WT or mDia1/3 DKO primary cultured Sertoli cells. Results of eight cells for each genotype from two independent experiments. Data are represented as mean ± SEM. ***P < 0.001 (Student t test). (C) Representative images of TIRF 3D-N-STORM imaging of the actin filaments in control WT primary cultured Sertoli cells or Sertoli cells treated with 30 μM SMIFH2 or 50 μM CK-666 for 1 h. Two SMIFH2-treated Sertoli cells with different extents of impaired cortical F-actin meshwork phenotype are shown. The images on the right side are magnified images of the corresponding white boxed areas of the lower magnification. Scale bars, 5 μm (left) and 500 nm (right). (D) Quantification of the ratio of F-actin meshwork occupancy per cell area in control, 50 μM CK-666–treated, or 30 μM SMIFH2-treated primary cultured Sertoli cells. Results of nine cells for control, eight cells for CK-666–treated, and 15 cells for SMIFH2-treated primary cultured Sertoli cells from two independent experiments. *P < 0.05, ***P < 0.001 (P = 0.017 for control versus CK-666–treated cells, P < 0.001 for control versus SMIFH2-treated cells, and P < 0.001 for CK-666–treated versus SMIFH2-treated cells; one-way ANOVA with post hoc test). DKO, double knockout; F-actin, filamentous actin; mDia1/3, mammalian diaphanous homolog1/3; SMIFH2, small molecule inhibitor of formin homology 2 domain; TIRF, total internal reflection; WT, wild-type; 3D-N-STORM, three dimensional-N-stochastic optical reconstruction microscopy.
Fig 3
Fig 3. mDia1/3-dependent rapid dynamics of cortical F-actin meshwork in primary cultured Sertoli cells.
(A) Time-lapse images of WT primary cultured Sertoli cell expressing LifeAct-EGFP. Red arrows indicate the tip of the elongating F-actin in the cortical meshwork. Time is shown in seconds. The colors in the right panel indicate the elongated actin filament at each time point in the left panel. Scale bar, 2 μm. (B) Quantification of the elongation speed of LifeAct-EGFP in WT and mDia1/3 DKO Sertoli cells. Results from two independent experiments. Data are represented as mean ± SEM (n = 49 and 20 filaments from four WT and four mDia1/3 DKO Sertoli cells, respectively). **P < 0.01 (P = 0.0013, Student t test). (C) Quantification of the straightness of the elongated F-actin in WT and mDia1/3 DKO Sertoli cells. Results from two independent experiments. Data are represented as mean ± SEM (n = 49 and 20 filaments from four WT and four mDia1/3 DKO Sertoli cells, respectively). (D) Quantification of the elongation frequency of cortical F-actin meshwork. Results from two independent experiments. Data are represented as mean ± SEM (n = 9 regions from three WT and three mDia1/3 DKO Sertoli cells, respectively). ***P < 0.001 (P = 0.0002, Student t test). (E) Time-lapse images of WT primary Sertoli cell expressing EGFP-mDia3. Red boxes indicate a single molecule of EGFP-mDia3. Time is shown in seconds. Scale bar, 2 μm. (F) Kymograph of EGFP-mDia3 single molecule in Fig 3E. (G) Quantification of the processive moving speed of EGFP-mDia3 single molecules (n = 59 molecules from three cells). The result is representative of two independent experiments. (H) Quantification of the straightness of EGFP-mDia3 single molecules’ processive movement (n = 59 molecules from three cells). The result is representative of two independent experiments. (I) Quantification of the travel distance of EGFP-mDia3 single molecules (n = 59 molecules from three cells). The result is representative of two independent experiments. DKO, double knockout; EGFP, enhanced green fluorescent protein; F-actin, filamentous actin; mDia1/3, mammalian diaphanous homolog1/3; n.s., not significant (P = 0.3194, Student t test); WT, wild-type.
Fig 4
Fig 4. Loss of mDia1/3 in the Sertoli cell results in impaired actomyosin bundles and adherens junction.
(A) TIRF N-STORM imaging of F-actin bundles of primary cultured Sertoli cells. Magnified images of the corresponding white box areas are shown below. Note that the F-actin bundle is a structure continuous with cortical actin filaments meshwork. Arrows indicate the bending F-actin bundles observed in mDia1/3 DKO primary cultured Sertoli cells. Scale bars, 500 nm. (B) Primary cultured WT and mDia1/3 DKO Sertoli cells stained with phalloidin (magenta) and pMLC (green). Note the reduced and discontinuity of pMLC staining on the F-actin bundles in the mDia1/3 DKO Sertoli cell. Scale bars, 20 μm and 5 μm. White boxes are magnified and shown below the low magnification images. (C) Quantification of pMLC staining intensity. Staining intensity was normalized to the average intensity of control WT cells. Result is a sum of three independent experiments. Data are represented as mean ± SEM (n = 33 and 30 for WT cells and mDia1/3 DKO cells, respectively). ***P < 0.001 (Student t test). (D) Primary cultured WT and mDia1/3 DKO Sertoli cells stained with phalloidin (magenta) and espin1 (green). Note increased espin1 staining overlapped with F-actin staining in mDia1/3 DKO Sertoli cell. Scale bars, 20 μm and 5 μm. White boxes are magnified and shown below the low magnification images. (E) Quantification of espin1-positive actin bundles per cell. Result is a sum of three independent experiments. Data are represented as mean ± SEM (n = 25 for WT Sertoli cells and n = 2 for mDia1/3 DKO Sertoli cells). ***P < 0.001 (Student t test). (F) Schematic representation of Sertoli cell–germ cell coculture experiment. Green circle indicates germ cell isolated from 3-wk-old EGFP transgenic mouse testes, and gray ellipse indicates WT or mDia1/3 DKO Sertoli cells. Red lines indicate actin filaments of the Sertoli cell, which surround the germ cell. (G) Percentage of germ cells formed adherens junction with Sertoli cells, as judged by N-cadherin staining on WT or mDia1/3 DKO Sertoli cells in Sertoli cell–germ cell coculture experiments. Germ cells that had N-cadherin signals surrounding the germ cells were counted as adhesive cells. Result is the average of three independent experiments. Data are represented as mean ± SEM (n = 124 and 89 cells for WT and mDia1/3 DKO, respectively). *P < 0.05 (P = 0.0306, Student t test). (H) Representative images of a germ cell judged as an adhesive cell with a WT Sertoli cell. (I) SDSRM images of Sertoli cell–germ cell in cocultured experiment stained with phalloidin. Images consist of 10 pairs of serial planes (z-step = 0.5 μm from bottom to top). Note that, while the germ cell attached to WT Sertoli cell is surrounded by actin filaments, such actin filaments are impaired in the germ cell attached to mDia1/3 DKO Sertoli cell. (J) Quantification of the percentage of germ cells with actin filaments surrounding them in Sertoli cell–germ cell cocultured experiment. Result is from three independent experiments. Data are represented as mean ± SEM (n = 157 and 147 cells for WT and mDia1/3 DKO, respectively). ***P < 0.001 (P = 0.0005, Student t test). (K) Quantification of the cortical F-actin intensity underneath the germ cell of the WT or mDia1/3 DKO Sertoli cell in cocultured experiment. Staining intensity was normalized to the average intensity of control WT cells. Result is from two independent experiments. Data are represented as mean ± SEM (n = 23 and 17 cells for WT and m1/3 DKO, respectively). ***P < 0.001 (P = 0.0001, Student t test). DKO, double knockout; EGFP, enhanced green fluorescent protein; F-actin, filamentous actin; mDia1/3, mammalian diaphanous homolog1/3; N-cad, neural cadherin; N-cadherin, neural cadherin; Pha, phalloidin; pMLC, phosphorylated myosin light chain; SDSRM, spinning disk superresolution microscopy; TIRF N-STORM, total internal reflection N-stochastic optical reconstruction microscopy; WT, wild-type.
Fig 5
Fig 5. Loss of mDia1/3 results in impaired Sertoli cell–germ cell adhesion and aberrant and ectopic actin bundling in seminiferous tubule.
(A) Immunofluorescence staining for nectin-2 (green) and nuclear counterstaining with DAPI (magenta). White two-way arrow indicates the area where round spermatids are located in seminiferous tubule. (B) High magnification of concentrated nectin-2 staining at apical ES junction between Sertoli cell and elongated spermatids. Note that while signals for apical ES junction nectin-2 concentrated around the head of the elongated spermatids were relatively continuous in WT seminiferous tubule, nectin-2 signal around the head of elongated spermatids is often lower than that of the WT and its continuity around the spermatids head is impaired in mDia1/3 DKO apical ES junction. Scale bars, 100 μm (A) and 2.5 μm (B). (C) Quantification of the normalized nectin-2 staining intensity at the apical ES junction. Result is a sum of three independent experiments. Data are represented as mean ± SEM (n = 35 and 39 cells for WT and mDia 1/3 DKO, respectively). ***P < 0.001 (Student t test). (D) Quantification of the coefficient of variation of nectin-2 staining intensity along the apical ES junction. Result is from three independent experiments. Data are represented as mean ± SEM (n = 35 and 39 cells for WT and mDia 1/3 DKO, respectively). ***P < 0.001 (Student t test). (E) WT (upper) and mDia1/3 DKO (lower) adult seminiferous tubule stained with phalloidin. The white two-way arrow indicates the round and elongated spermatids zone of the WT seminiferous tubule, with F-actin faintly stained. Red, yellow, and blue boxes are magnified images of the corresponding boxed areas of the lower magnification. Scale bars, 100 μm (left) and 10 μm (right). The lines (magenta and green arrows) in the blue boxes were used to calculate the fluorescence intensity. (F) Line scans of the fluorescence intensity for phalloidin staining. Fluorescence-intensity profiles along the magenta and green arrows shown in E are shown. Green asterisks indicate ectopic thick F-actin bundles observed in mDia1/3 DKO seminiferous tubule. (G) Simplified scheme summarized results of the observation in Fig 5E–5F. (H) Quantification of total F-actin staining intensity. Result is a sum of three independent experiments. Data are represented as mean ± SEM (n = 21 and 18 for WT and mDia 1/3 DKO, respectively). **P < 0.01 (P = 0.001, Student t test). (I) WT (upper) and mDia1/3 DKO (lower) adult testis immunostained for espin1 (green) and F-actin (magenta). Note that the espin1 staining in the mDia1/3 DKO seminiferous tubule was abnormally strong and colocalized to phalloidin staining of aberrant and ectopic thick F-actin bundles observed in the mDia1/3 DKO seminiferous tubule. Scale bar, 100 μm. (J) Quantification of espin1-positive actin bundles. Result is a sum of three independent experiments. Data are represented as mean ± SEM (n = 12 seminiferous tubules for WT mice and n = 17 seminiferous tubules for mDia1/3 DKO mice). ***P < 0.001 (Student t test). a.u., arbitrary unit; DKO, double knockout; ES, ectoplasmic specialization; F-actin, filamentous actin; mDia1/3, mammalian diaphanous homolog1/3; WT, wild-type.

Similar articles

Cited by

References

    1. Campellone KG, Welch MD. A nucleator arms race: cellular control of actin assembly. Nat Rev Mol Cell Biol. 2010;11: 237–251. 10.1038/nrm2867 - DOI - PMC - PubMed
    1. Thumkeo D, Watanabe S, Narumiya S. Physiological roles of Rho and Rho effectors in mammals. Eur J Cell Biol. 2013;92: 303–315. 10.1016/j.ejcb.2013.09.002 - DOI - PubMed
    1. Sakata D, Taniguchi H, Yasuda S, Adachi-Morishima A, Hamazaki Y, Nakayama R, et al. Impaired T lymphocyte trafficking in mice deficient in an actin-nucleating protein, mDia1. J Exp Med. 2007;204: 2031–2038. 10.1084/jem.20062647 - DOI - PMC - PubMed
    1. Watanabe S, De Zan T, Ishizaki T, Yasuda S, Kamijo H, Yamada D, et al. Loss of a Rho-regulated actin nucleator, mDia2, impairs cytokinesis during mouse fetal erythropoiesis. Cell Rep. 2013;5: 926–932. 10.1016/j.celrep.2013.10.021 - DOI - PubMed
    1. Shinohara R, Thumkeo D, Kamijo H, Kaneko N, Sawamoto K, Watanabe K, et al. A role for mDia, a Rho-regulated actin nucleator, in tangential migration of interneuron precursors. Nat Neurosci. 2012;15: 373–380. 10.1038/nn.3020 - DOI - PubMed

Publication types