. 2018 Sep 26;13(9):e0202802.
doi: 10.1371/journal.pone.0202802. eCollection 2018.

Regenerative glutamate release in the hippocampus of Rett syndrome model mice

Affiliations

Regenerative glutamate release in the hippocampus of Rett syndrome model mice

Saju Balakrishnan et al. PLoS One. .

Abstract

Excess glutamate during intense neuronal activity is not instantly cleared and may accumulate in the extracellular space. This has various long-term consequences such as ectopic signaling, modulation of synaptic efficacy and excitotoxicity; the latter implicated in various neurodevelopmental and neurodegenerative diseases. In this study, the quantitative imaging of glutamate homeostasis of hippocampal slices from methyl-CpG binding protein 2 knock-out (Mecp2-/y) mice, a model of Rett syndrome (RTT), revealed unusual repetitive glutamate transients. They appeared in phase with bursts of action potentials in the CA1 neurons. Both glutamate transients and bursting activity were suppressed by the blockade of sodium, AMPA and voltage-gated calcium channels (T- and R-type), and enhanced after the inhibition of HCN channels. HCN and calcium channels in RTT and wild-type (WT) CA1 neurons displayed different voltage-dependencies and kinetics. Both channels modulated postsynaptic integration and modified the pattern of glutamate spikes in the RTT hippocampus. Spontaneous glutamate transients were much less abundant in the WT preparations, and, when observed, had smaller amplitude and frequency. The basal ambient glutamate levels in RTT were higher and transient glutamate increases (spontaneous and evoked by stimulation of Schaffer collaterals) decayed slower. Both features indicate less efficient glutamate uptake in RTT. To explain the generation of repetitive glutamate spikes, we designed a novel model of glutamate-induced glutamate release. The simulations correctly predicted the patterns of spontaneous glutamate spikes observed under different experimental conditions. We propose that pervasive spontaneous glutamate release is a hallmark of Mecp2-/y hippocampus, stemming from and modulating the hyperexcitability of neurons.


Conflict of interest statement

The authors have declared that no competing interests exist.

Figures

Fig 1
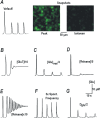
Fig 1. Glutamate imaging reveals spontaneous glutamate spikes in CA1 hippocampus.
A–Representative fluorescence images of hippocampal slices transduced with iGluSnFR sensor (encapsulated into AAV5 vectors) targeted to neurons and astrocytes as indicated. B–The dose-response curves for sensor responses in neurons and astrocytes were fitted well by the Michaelis-Menten-like equation(ΔF/Fmax) = [Glu]/(Kd + [Glu]). The concentration dependencies coincided in both cell types and corresponded to the same Kd = 10 μM. Mean data for each concentration is derived from four individual experiments. C–Sample traces of repetitive glutamate releases recorded with neuronal (top) and glial sensors (bottom) in CA1 area in slices from RTT animals (see also Fig 2). Thin traces represent mean changes averaged over 12 cells and thick grey backgrounds show ± SEM. D–Correlation between local glutamate spikes (top trace) and excitatory postsynaptic synaptic currents (EPSC, lower trace) measured in CA1 neurons at the holding potential of -70 mV. Negative deflections in whole-cell recording indicate EPSCs that eventually produced a ‘synaptic drive’; a correlate of the burst of action potentials in the current-clamp mode. Note the good temporal correspondence between EPSCs and glutamate transients. The inset shows DIC-image with patched CA1 cell. E–Spontaneous activity in CA1 and CA3 areas. The traces present spontaneous glutamate transients in naïve slices from RTT animals before and after mechanical separation of CA1 and CA3 areas.
Fig 2
Fig 2. Glutamate transients and excitability of CA1 neurons.
A–(a) Glutamate transients in the slices from wild-type (WT) and Mecp2 null (RTT) mice, presented as average traces (obtained from 12 neurons in the image field of a single representative experiment) and overlaid upon grey background (± SEM). The traces and mean data obtained from WT and RTT slices here and below are presented in different colors. The histograms on the right present basal glutamate levels (b), mean intervals between the spikes (c), and their amplitudes (d). The data was obtained from 24 ‘rhythmic’ WT slices (blue bars) out of the 158 examined and from 108 RTT slices out of the 142 examined (black bars). B–(a) Representative spontaneous glutamate transients in expanded scale. Note the bigger and slower glutamate transients in RTT. (b) Cumulative comparison of rise times measured as 10 to 90% increase. (c) Decay times of spontaneous glutamate transients. C—(a) Glutamate changes evoked by stimulation of Schaffer collaterals at the times indicated by the arrows under the traces. The transients in WT and RTT showed similar rise-times (b) but significantly different decay times (c). Statistical data are means ± SEM of six independent experiments. All the above data is evaluated using Mann-Whitney-U-test. Corresponding P values are given in histograms. All differences were significant, except the rise-times. DEnhanced excitability in RTT. (a) Shown are the responses of CA1 neurons of WT and RTT to the two current injections (100 and 400 pA,). The input-output relationships are shown on the right (b). Mean data was obtained from 12 cells examined in six different preparations from WT and RTT animals.
Fig 3
Fig 3. Spontaneous glutamate transients and neuronal activity after blockade of specific pathways of glutamate transport and release.
Left panels present glutamate changes, and the corresponding voltage trajectories in whole-cell patch-clamp recordings are shown on the right. A–TBOA (DL-threo-beta-benzyloxyaspartate, 10 μM, a general blocker of glutamate transporters) potentiated spontaneous glutamate spikes and enhanced bursting activity. B—Treatment of the slices for 30 min with 2 μM folimycin (an inhibitor of V-ATPase that prevents refilling of glutamate vesicles) reduced the amplitude of glutamate spikes and decreased their frequency (left), in parallel with changes in neuronal activity (right). CCalcium removal from the bath reversibly inhibited glutamate spikes (left), but the neuronal activity increased due to surface potential change (right, see also Results section). DBrief application of glutamate caused massive long-lasting glutamate increase and neuronal depolarization that eventually subsided. A depression lasted 2–3 min after which the activities fully restored. EApplication of ACSF containing 5% dextran decreased the amplitude and frequency of glutamate spikes. The statistical significance of differences was evaluated using a Student’s t test and corresponding P values are listed in group summary.
Fig 4
Fig 4. Persistent glutamate spikes require intact neuronal and synaptic activities and calcium influx.
Glutamate imaging (left) and whole-cell patch-clamp recordings (right) show typical responses of CA1 neurons in hippocampal slices from Mecp2 null (RTT) mice. Black thin curves on the left show ambient glutamate changes (averages for 12 cells in the image field) and the thick grey background indicates ± SEM. All blocking effects were reversible and the activities fully recovered after several minutes of wash out. Glutamate spikes were inhibited in parallel with the suppression of synaptic drives, a correlate of AP bursts. The latter are indicated by asterisks in the beginning of each patch-clamp recording (see also Fig 1D). A–TTX (tetrodotoxin, 100 nM, a blocker of the voltage gated sodium channels) suppressed rhythmic glutamate transients, synaptic drives and spontaneous synaptic currents. B—CNQX (Cyano-7-nitroquinoxaline-2, 3-dione, 10 μM, a blocker of AMPA receptors) had similar effects. Elevation of extracellular Mg2+ from 1 to 8 mM (C) and application of 100 μM Ni2+ (D) inhibited glutamate transients and synaptic activities. Note small decreases in basal glutamate levels during all treatments.
Fig 5
Fig 5. Modeling glutamate-induced glutamate release (GIGR).
The traces present mean concentration of ambient glutamate averaged over the 2D-network model. The basic assumptions of GIGR model and the parameters are presented in Methods. A–Fast establishment of rhythmic synchronous glutamate transients within the network. This run was made with ‘default’ model parameter values (see Methods). The two snapshots on the right present spatial distributions of ambient glutamate at the peak of network activity and in between. The following panels show sample simulations made after modification of single model parameter while keeping others at default values. B—Concentration of glutamate transporters (GluT) was decreased 10-fold to mimic a decrease in glutamate uptake rate after TBOA application. This gave rise to an increase in ambient glutamate and interrupted oscillation because all glutamate release sites entered inactivation (refractory) state. C–To simulate the effects of folimycin, which reduces accumulation of glutamate in synaptic vesicles, the glutamate content in vesicles was made 4-fold smaller. This markedly reduced the amplitude and frequency of repetitive glutamate transients (Fig 3B). D–To model calcium-free experiments (Fig 3C), the release rate was decreased 5-fold and glutamate transients rapidly diminished. E–To imitate extracellular glutamate applications. (Fig 4D), the release rate was increased 10-fold. This ambient glutamate slowly elevated and glutamate spikes accelerated but lost their amplitude. F—The frequency of spontaneous release (Eq (3) in Methods) was increased 5-fold. This produced a robust increase in the amplitude and frequency of glutamate transients. G—To mimic the viscosity increase in ACSF with 5% dextran (Fig 3E), the diffusion coefficient of glutamate was made twice smaller. Glutamate transients were decelerated and appeared at lower amplitude.
Fig 6
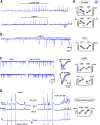
Fig 6. T- and R-type calcium channels modulate glutamate spikes, synaptic and bursting activities.
The data presented was obtained in CA1 neurons from RTT animals. In WT cells the effects were similar but weaker due to smaller amplitudes of calcium currents (S3 Fig and S3 File in Supporting information). ACurrent-clamp recordings. The voltage trajectories on the left show the burst before and after addition of Ni2+, which blocks both T- and R-type channels, Cav3.2 and Cav2.3, respectively. Note a significant afterdepolarization (ADP) in the control, on the peak of which a series of the actions potentials (a burst) is generated, and its significant (reversible) shortening after Ni2+. The two following continuous traces show ADP inhibition by specific blockers of T- and R-type channels, NNC and SNX, respectively. Note that ADP blockade was slowly replaced by afterhyperpolarization, in parallel with decreases in the synaptic and bursting activities. BNNC and SNX decrease the amplitude and increase the interval between repetitive glutamate spikes. CThe blockers diminished the amplitude and frequency of spontaneous excitatory synaptic currents (sEPSC) and suppress the synaptic drives (the former ones are indicated in continuous traces by asterisks). DBack-propagating potentials (bAPs) evoked by three brief trains (2 to 8 pulses delivered at 100 Hz as indicated by arrows). Calcium changes were measured with fluo-4 whose relative changes in fluorescence are nearly proportional to intracellular calcium levels. The data is presented for cell soma (black traces) and for apical dendrite 100 μm away from the soma (grey traces). Lower traces show voltage trajectories. In the control, several discharges and calcium increases persisted long after the stimulus. SNX and NNC diminished the amplitude of bAPs-evoked calcium transients and abolished spontaneous voltage and calcium spikes after the stimulations. EMiniature EPSCs before and 15 min after addition of calcium channel blockers to the bath (the recordings were made at -70 mV in the presence of 100 nM TTX). FGroup summary of blocker effects. The data was evaluated before and after application of blockers with Student’s t test and corresponding p values are listed in graphs. For bAPs-evoked calcium changes, peak amplitudes and the integral of fluorescence changes (a measure of spontaneous afterdischarges) are compared.
Fig 7
Fig 7. Membrane currents and evoked calcium transients.
ASample HCN and calcium currents evoked by voltage steps to -50 and -110 mV, respectively, from the holding potential -70 mV, close to the measured resting potential. CA1 neurons were intracellularly dialyzed with intracellular solution containing Cs+ + TEA (see Methods). Under these conditions depolarization-evoked calcium currents (upper panel, the voltage steps to >-60 mV) and hyperpolarization-activated HCN currents (lower panel, the voltage steps to<-80 mV) are clearly isolated. The right graph presents I-V curves for steady state currents in CA1 neurons from WT and RTT animals as indicated. B–HCN currents in WT (blue) and RTT (violet). Note smaller amplitude and slower time-course in RTT cells. C–Potential dependence of activation. The curves were obtained from the tail currents and normalized to maximum (left). The half-rise times (t1/2) are shown in the right panel. The differences can be attributed to decreased cAMP levels in RTT [25, 28]. D–Calcium transients during membrane depolarization. The traces indicate calcium changes measured with fluo-4 (100 μM in the pipette) evoked by the voltage step protocols schematically shown under the traces. E–Differences in the voltage-evoked calcium transients. Depolarization to 0 mV for 1 s evoked calcium increases in WT CA1 neurons (blue) that were smaller and faster than those in RTT cells (violet). Subsequent decay to the resting level was described by a single exponential in WT and in RTT an additional slower exponential appeared (the values are listed near the respective curves).
Fig 8
Fig 8. HCN channel activity shapes glutamate spikes and synaptic currents.
Presented data was obtained in WT CA1 neurons, where HCN conductance was bigger than in RTT and the effects of blockers were more expressed (for typical experiments in RTT and mean data, see S4 Fig and S4 File in Supporting information). AGlutamate spikes had bigger amplitudes and appeared more frequently after application of HCN blockers. ZD 7288 acted irreversibly and enhanced activity, whereas the potentiating effect of Cs+ reversed after 5 min of wash out. BPotentiation of synaptic drives by Cs+. Shown are the changes in the holding current at -70 mV after addition of 2 mM Cs+ to the bath. CMiniature EPSCs before and after addition of 2 mM Cs+ to the bath. The pairs of traces were obtained from the two representative cells dialyzed with K+ containing intracellular solution with and without 50 μM ZD 7288, respectively. The recordings were made at -70 mV in the presence of 100 nM TTX. The increase in the frequency and amplitude by extracellular Cs+ in the control (without ZDin) indicates the effects of pre- and postsynaptic HCN blockade, respectively. To distinguish between them, the neuron was dialyzed with 50 μM ZD 7288 for 15 min. Extracellular Cs+ then significantly changed mEPSC frequency but not the amplitude, which demonstrates pure presynaptic effects in this case. The traces in insets are the means of 20 to 30 single mEPSCs before and 2 min after Cs+ wash in and grey background indicates ±SEM. In the control Cs+ prolonged the decay of mean mEPSC. With ZD 7288 inside the decay time-constant was the same and the amplitude slightly increased, in accordance with pure presynaptic actions only. DBack-propagating potentials. The pulse protocol was the same as described in Fig 6D. Note the calcium changes in the soma and apical dendrites mimicked the membrane discharges after the stimuli. Extracellular ZD 7288 potentiated both activities. E—Group summary. The data was evaluated before and after drug applications with a Student’s t test with corresponding P values and are listed at the top of the panels.

Similar articles

Cited by

References

    1. Gundersen V, Storm-Mathisen J, Bergersen LH. Neuroglial Transmission. Physiol Rev. 2015; 95: 695–726. 10.1152/physrev.00024.2014 - DOI - PubMed
    1. Marx MC, Billups D, Billups B. Maintaining the presynaptic glutamate supply for excitatory neurotransmission. J Neurosci Res. 2015; 93: 1031–1044. 10.1002/jnr.23561 - DOI - PubMed
    1. Bazargani N, Attwell D. Astrocyte calcium signaling: the third wave. Nat Neurosci. 2016; 2: 182–189. - PubMed
    1. Blasco H, Mavel S, Corcia P, Gordon PH. The glutamate hypothesis in ALS: pathophysiology and drug development. Curr Med Chem. 2014; 21: 3551–75. - PubMed
    1. Ribeiro FM, Pires RG, Ferguson SS. Huntington's disease and Group I metabotropic glutamate receptors. Mol Neurobiol. 2011; 43: 1–11. 10.1007/s12035-010-8153-1 - DOI - PubMed

Publication types

Substances