. 2018 Sep 26;13(9):e0204119.
doi: 10.1371/journal.pone.0204119. eCollection 2018.

Ethanol and unsaturated dietary fat induce unique patterns of hepatic ω-6 and ω-3 PUFA oxylipins in a mouse model of alcoholic liver disease

Affiliations

Ethanol and unsaturated dietary fat induce unique patterns of hepatic ω-6 and ω-3 PUFA oxylipins in a mouse model of alcoholic liver disease

Dennis R Warner et al. PLoS One. .

Abstract

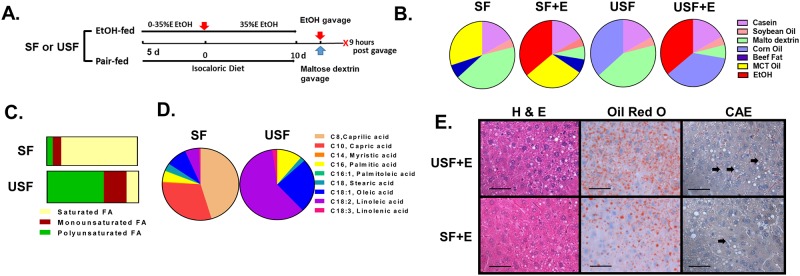
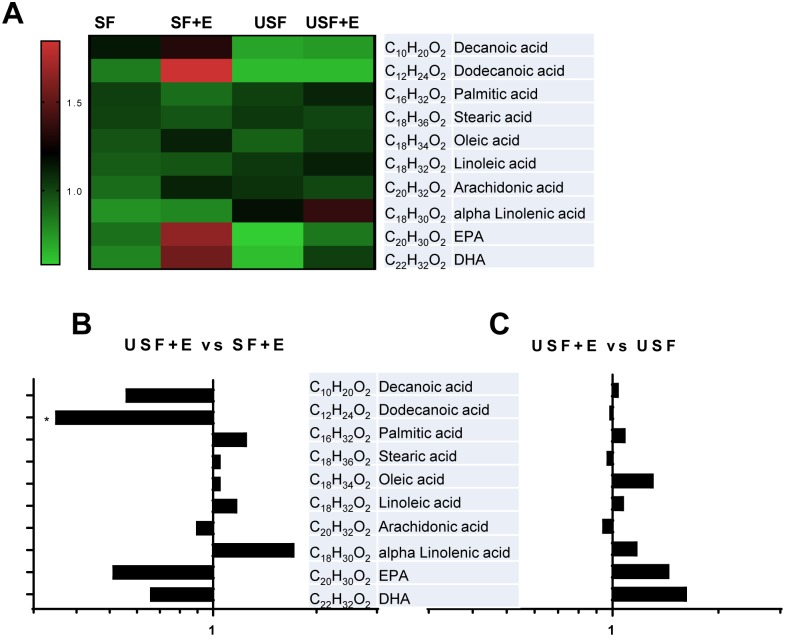
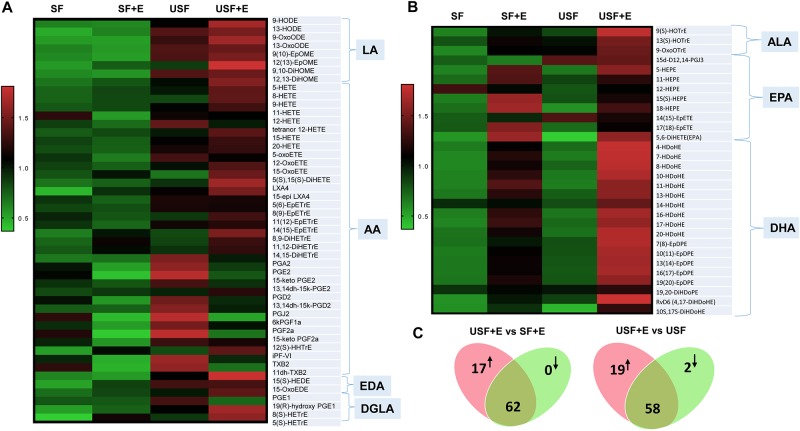
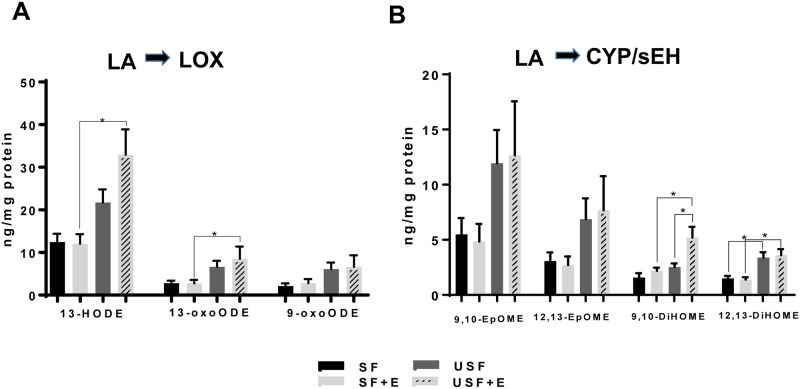
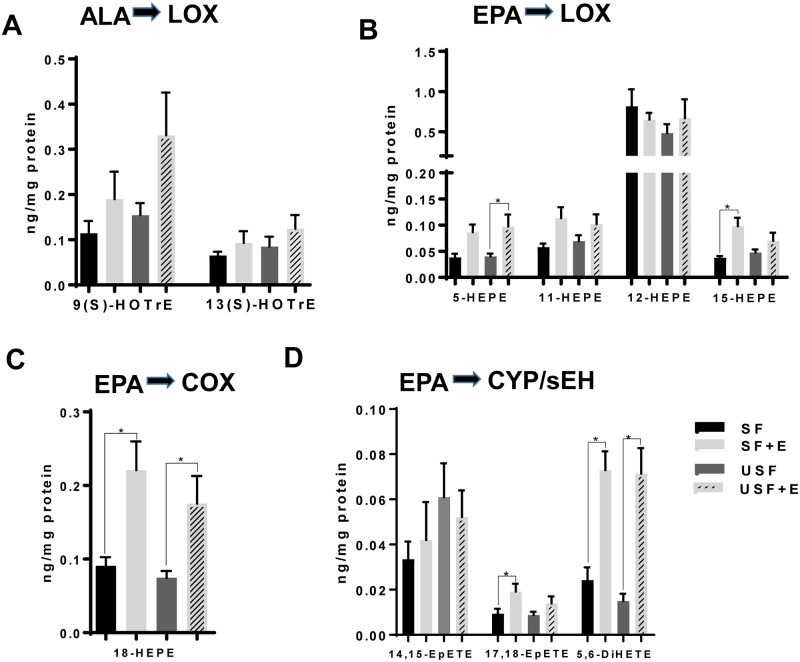
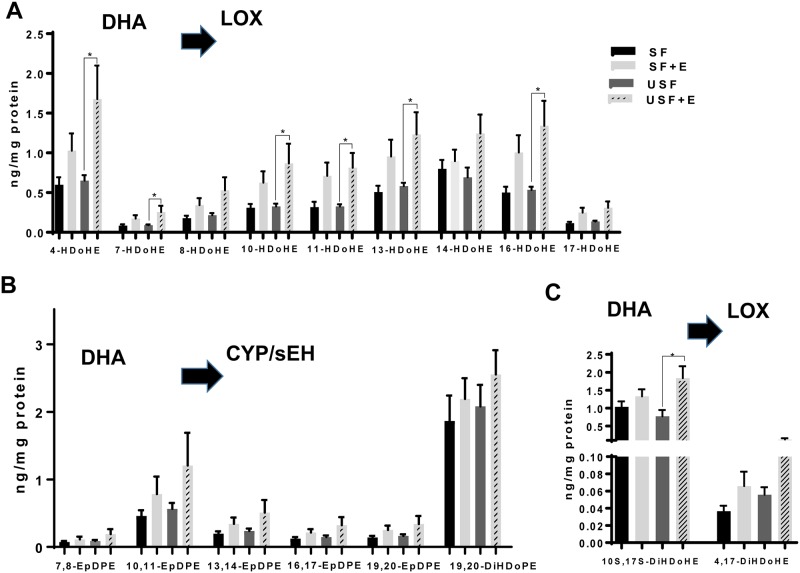
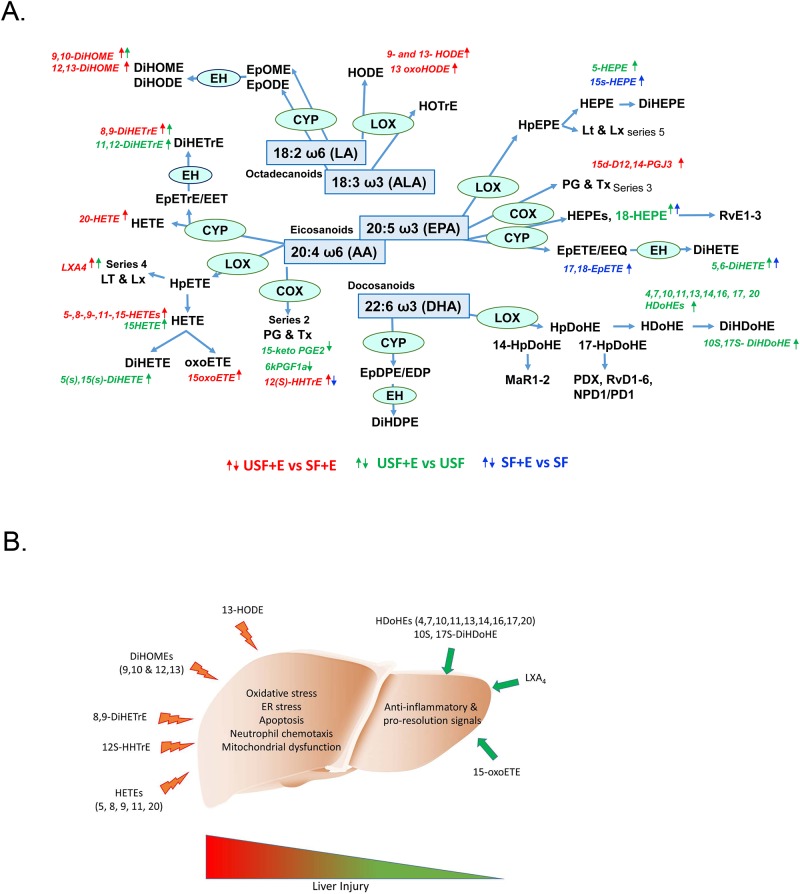
Alcoholic liver disease (ALD), a significant health problem, progresses through the course of several pathologies including steatosis, steatohepatitis, fibrosis, and cirrhosis. There are no effective FDA-approved medications to prevent or treat any stages of ALD, and the mechanisms involved in ALD pathogenesis are not well understood. Bioactive lipid metabolites play a crucial role in numerous pathological conditions, as well as in the induction and resolution of inflammation. Herein, a hepatic lipidomic analysis was performed on a mouse model of ALD with the objective of identifying novel metabolic pathways and lipid mediators associated with alcoholic steatohepatitis, which might be potential novel biomarkers and therapeutic targets for the disease. We found that ethanol and dietary unsaturated, but not saturated, fat caused elevated plasma ALT levels, hepatic steatosis and inflammation. These pathologies were associated with increased levels of bioactive lipid metabolites generally involved in pro-inflammatory responses, including 13-hydroxy-octadecadienoic acid, 9,10- and 12,13-dihydroxy-octadecenoic acids, 5-, 8-, 9-, 11-, 15-hydroxy-eicosatetraenoic acids, and 8,9- and 11,12-dihydroxy-eicosatrienoic acids, in parallel with an increase in pro-resolving mediators, such as lipoxin A4, 18-hydroxy-eicosapentaenoic acid, and 10S,17S-dihydroxy-docosahexaenoic acid. Elucidation of alterations in these lipid metabolites may shed new light into the molecular mechanisms underlying ALD development/progression, and be potential novel therapeutic targets.


Conflict of interest statement

The authors have declared that no competing interests exist.

Figures

Fig 1
Fig 1. Characterization of liver injury caused by chronic-binge ethanol exposure.
A: Schematic presentation of the chronic-binge ethanol exposure protocol. C57BL/J mice were fed control (pair-fed) or ethanol diets for 10 days, followed by single gavage of maltose dextrose or ethanol on day 11, respectively. Animals were euthanized 9 hours after gavage. B: The composition of the experimental liquid diets. The SF diet was enriched in beef tallow fat and MCTs (18:82 ratio). The USF diet was enriched with corn oil. Soybean oil was used in both diets to provide essential free fatty acids. The control (SF and USF) diets contained 43% of calories from carbohydrate, 17% from protein, and 40% from fat. The SF and ethanol and USF and ethanol diets contained 35% of calories from ethanol to replace the calories from carbohydrate. C: The percent of saturated, monounsaturated and polyunsaturated fatty acids was 84.1%, 9.9%, and 6.6% in SF diet and, 13.1%, 25.0%, and 61.9% in USF diet, respectively. D: Fatty acid composition of experimental diets. E: Representative images of hepatic hematoxylin and eosin (H&E), Oil Red O and chloroacetate esterase (CAE) staining. Original magnification, x400, scale bars are 50 μm. Arrows indicate CAE-positive neutrophils.
Fig 2
Fig 2. Alterations in the regulation of lipid metabolism in mice fed SF or USF following EtOH administration.
Gene (panel A) and protein (panel B) expression of key enzymes and transcription factors involved in the regulation of lipid homeostasis. qPCR data are expressed as the fold-change relative to the SF pair-fed group (mean ± SEM, n = 8–10). Western blots were quantified using Image J and normalized to the respective loading controls and presented below each group (mean ± SEM, n = 3–4). * P < 0.05, two-way ANOVA; # P<0.05 vs. control; ## P<0.05 vs. SF+EtOH; E, ethanol; SF, saturated fat; USF, unsaturated fat.
Fig 3
Fig 3. Hepatic fatty acid composition in mice exposed to chronic-binge ethanol administration.
A: Changes in the abundance of individual hepatic fatty acids between experimental groups. Results are expressed as a matrix view (heat map) where rows represent individual fatty acid and columns represent group distribution. The intensity of each color denotes the standardized ratio between each sample value and the average levels of each individual fatty acid across all samples. B: Comparison of hepatic fatty acids between USF+E and SF+E. C: Comparison of hepatic fatty acids between USF+E and USF groups. Data are expressed as a fold changes. * P < 0.05. DHA, docosahexaenoic acid; E, ethanol; EPA, eicosapentaenoic acid; SF, saturated fat; USF, unsaturated fat.
Fig 4
Fig 4. Alterations in hepatic oxylipins caused by chronic-binge ethanol exposure.
A, B: Heat maps representing the overall changes in hepatic metabolites derived from ω-6 and ω-3 PUFAs occurred between experimental groups. Results are expressed as a matrix view where rows represent individual metabolites and columns represent group distribution. The intensity of each color denotes the standardized ratio between each value and the average levels of each metabolite across all samples in all groups. C: The diagram summarizing differential levels of all PUFA-derived metabolites between the indicated treatment groups. n = 6 mice per group. AA, arachidonic acid; ALA, α-linolenic acid; DHA, docosahexaenoic acid; DGLA, dihomo-γ-linolenic acid; E, ethanol; EDA, eicosadienoic acid; EPA, eicosapentaenoic acid; SF, saturated fat; USF, unsaturated fat; Individual oxylipin abbreviations see in S2 and S4 Tables.
Fig 5
Fig 5. Ethanol-mediated changes in hepatic oxylipins derived from linoleic acid.
A: LOX-derived hydroxy-metabolites of LA. B: Changes in epoxy- and dihydroxy-metabolites of LA derived via CYP/sEH pathway. Data are presented as means +SEM, Two way ANOVA, * P < 0.05, n = 6 animals per group. CYP, cytochrome-P450 epoxygenase; E, ethanol; LA, linoleic acid; LOX, lipoxygenase; SF, saturated fat; sEH, soluble epoxide hydrolase; USF, unsaturated fat. Individual oxylipin abbreviations in S2 Table.
Fig 6
Fig 6. Changes in hepatic oxylipins derived from arachidonic acid.
A: Changes in the profile of LOX-dependent hydroxy-metabolites of AA. B: Levels of 11-HETE. C: Levels of 20-HETE (COX pathway). D: Levels of lipoxins (LOX pathway). E: Levels of AA-derived prostaglandins (COX pathway). F: Changes in epoxy- and dihydroxy-metabolites of AA derived via CYP/sEH pathway. G: Pearson correlation analysis between AA metabolites and markers of hepatic inflammation and injury: 8,9-DiHETrE and Mcp1 mRNA, and 11,12-DiHETrE and Hmgb1 mRNA. Data are presented as the mean ± SEM, Two way ANOVA, * P < 0.05, n = 6 animals per group. AA, arachidonic acid; CYP, cytochrome-P450 epoxygenase; E, ethanol; LOX, lipoxygenase; SF, saturated fat; sEH, soluble epoxide hydrolase; USF, unsaturated fat. See oxylipin abbreviations in S2 Table.
Fig 7
Fig 7. Changes in hepatic oxylipins derived from ω-3 PUFAs, linolenic and EPA.
A: Levels of ALA hydroxy-metabolites of LOX pathway. B. Changes in the profile of LOX-dependent hydroxy-metabolites of EPA. C: 18-HEPE levels, COX pathway. D: Changes in epoxy- and dihydroxy-metabolites of EPA derived via CYP/sEH pathway. Data are presented as the mean ± SEM, Two way ANOVA, * P < 0.05, n = 6 animals per group. ALA, alpha linolenic acid; CYP, cytochrome-P450 epoxygenase; E, ethanol; EPA, eicosapentaenoic acid; LOX, lipoxygenase; SF, saturated fat; sEH, soluble epoxide hydrolase; USF, unsaturated fat. See oxylipin abbreviations in S6 Table.
Fig 8
Fig 8. Changes in hepatic oxylipins derived from DHA.
A: Levels of DHA-derived hydroxyl-metabolites of LOX pathway. D: Changes in epoxy- and dihydroxy-metabolites of DHA produced via CYP/sEH pathway. C: Pro-resolving DHA metabolites of LOX pathway. Data are presented as the mean ± SEM, Two way ANOVA, * P < 0.05, n = 6 animals per group. CYP, cytochrome-P450 epoxygenase; DHA, docosahexaenoic acid; E, ethanol; LOX, lipoxygenase; SF, saturated fat; sEH, soluble epoxide hydrolase; USF, unsaturated fat. See oxylipin abbreviations in S6 Table.
Fig 9
Fig 9. Analysis of the expression of genes involved in hepatic oxylipin production.
Data are presented as the mean ± SEM vs. the SF group, two-way ANOVA, * P < 0.05, n = 6 animals per group.
Fig 10
Fig 10. EtOH-mediated alterations in liver oxylipins.
A: Summary of changes in hepatic ω-6 and ω-3 PUFA-derived oxylipins in response to EtOH exposure. B: A working model wherein multiple ω-6-derived oxylipins (to the left) facilitate liver injury via distinct mechanisms. The deleterious effects of these oxylipins outweigh the benefits of anti-inflammatory and pro-resolving bioactive lipid mediators (to the right), and tips the balance towards liver damage. Abbreviations are listed in S4 and S6 Tables.

Similar articles

Cited by

References

    1. Frazier TH, Stocker AM, Kershner NA, Marsano LS, McClain CJ. Treatment of alcoholic liver disease. Therap Adv Gastroenterol. 2011;4(1):63–81. 10.1177/1756283X10378925 . - DOI - PMC - PubMed
    1. Loomba R, Quehenberger O, Armando A, Dennis EA. Polyunsaturated fatty acid metabolites as novel lipidomic biomarkers for noninvasive diagnosis of nonalcoholic steatohepatitis. J Lipid Res. 2015;56(1):185–92. Epub 2014/11/19. 10.1194/jlr.P055640 . - DOI - PMC - PubMed
    1. Raszeja-Wyszomirska J, Safranow K, Milkiewicz M, Milkiewicz P, Szynkowska A, Stachowska E. Lipidic last breath of life in patients with alcoholic liver disease. Prostaglandins Other Lipid Mediat. 2012;99(1–2):51–6. Epub 2012/06/19. 10.1016/j.prostaglandins.2012.06.001 . - DOI - PubMed
    1. Feldstein AE, Lopez R, Tamimi TA, Yerian L, Chung YM, Berk M, et al. Mass spectrometric profiling of oxidized lipid products in human nonalcoholic fatty liver disease and nonalcoholic steatohepatitis. J Lipid Res. 2010;51(10):3046–54. Epub 2010/07/16. 10.1194/jlr.M007096 . - DOI - PMC - PubMed
    1. Puri P, Wiest MM, Cheung O, Mirshahi F, Sargeant C, Min HK, et al. The plasma lipidomic signature of nonalcoholic steatohepatitis. Hepatology. 2009;50(6):1827–38. Epub 2009/11/26. 10.1002/hep.23229 . - DOI - PMC - PubMed

Publication types

MeSH terms