. 2018 Sep 25;24(13):3433-3440.e4.
doi: 10.1016/j.celrep.2018.08.072.

Cross-Modal Reinstatement of Thalamocortical Plasticity Accelerates Ocular Dominance Plasticity in Adult Mice

Affiliations

Cross-Modal Reinstatement of Thalamocortical Plasticity Accelerates Ocular Dominance Plasticity in Adult Mice

Gabriela Rodríguez et al. Cell Rep. .

Abstract

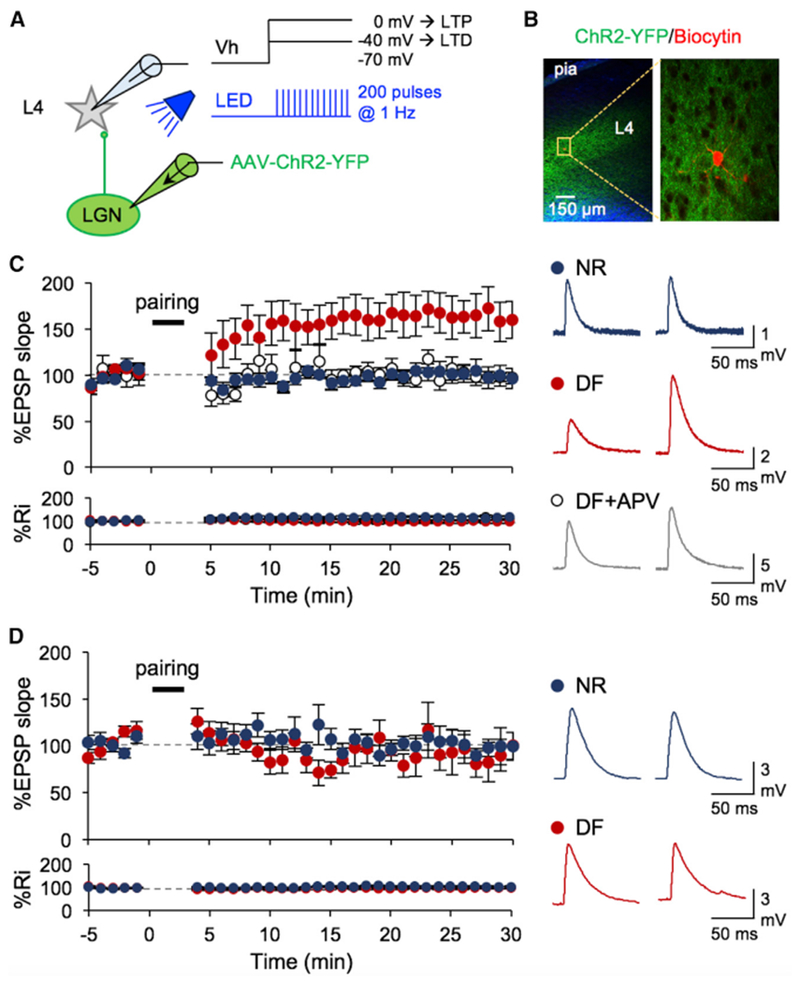
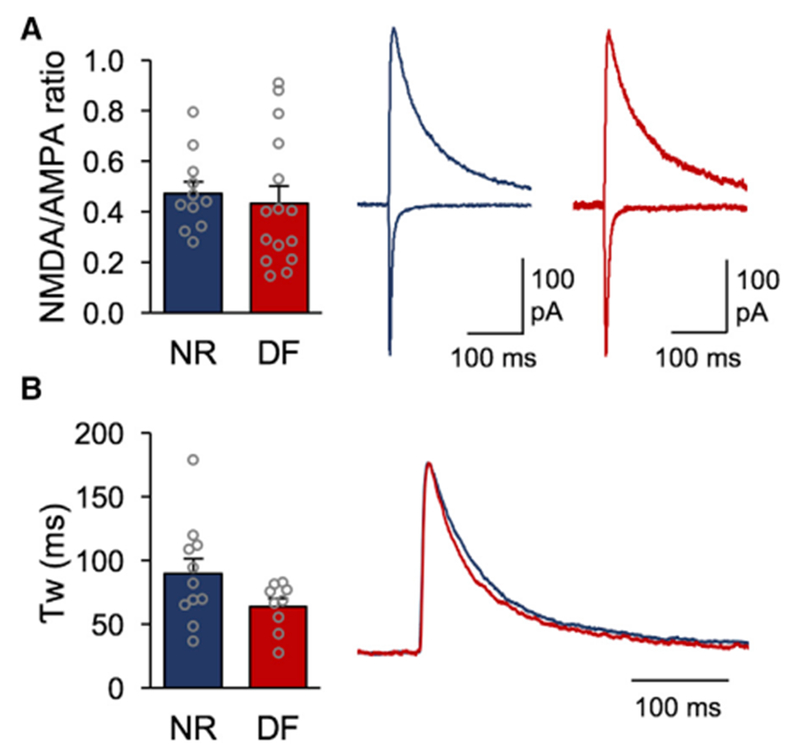
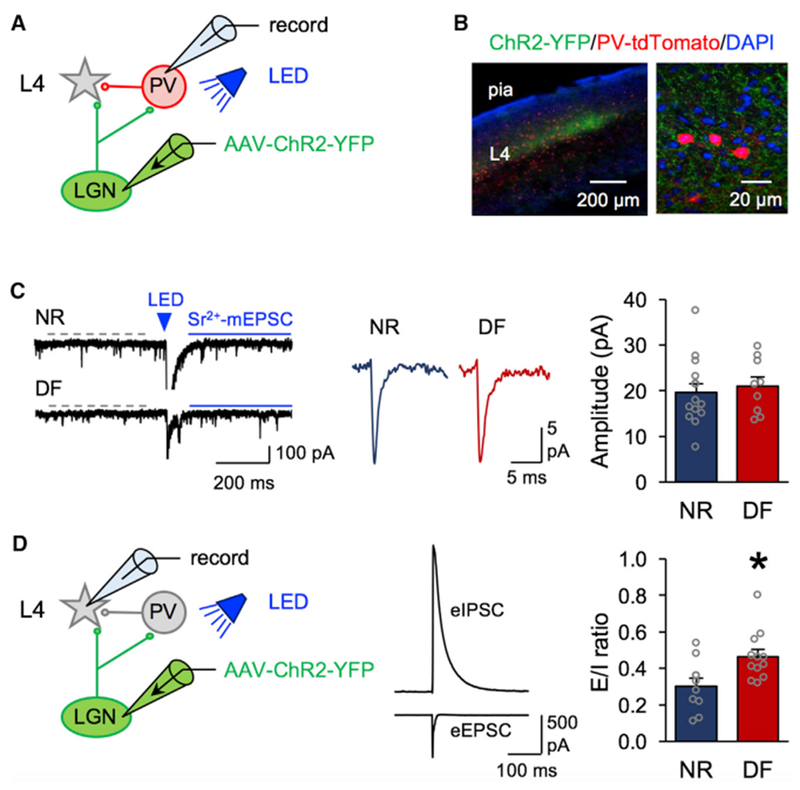
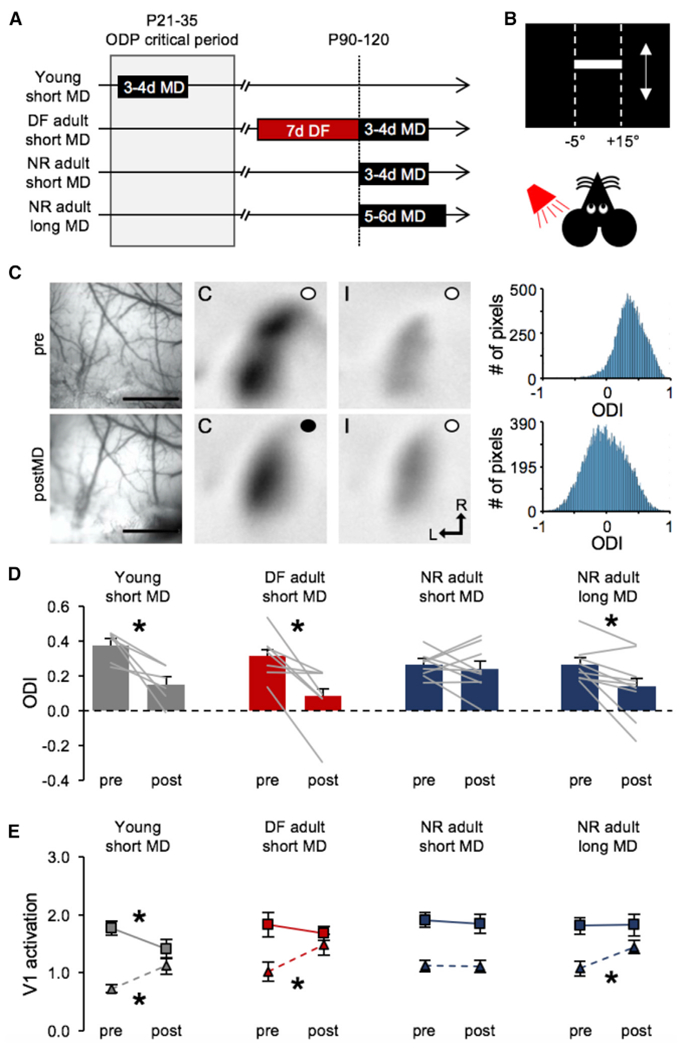
Plasticity of thalamocortical (TC) synapses is robust during early development and becomes limited in the adult brain. We previously reported that a short duration of deafening strengthens TC synapses in the primary visual cortex (V1) of adult mice. Here, we demonstrate that deafening restores NMDA receptor (NMDAR)-dependent long-term potentiation (LTP) of TC synapses onto principal neurons in V1 layer 4 (L4), which is accompanied by an increase in NMDAR function. In contrast, deafening did not recover long-term depression (LTD) at TC synapses. Potentiation of TC synapses by deafening is absent in parvalbumin-positive (PV+) interneurons, resulting in an increase in feedforward excitation to inhibition (E/I) ratio. Furthermore, we found that a brief duration of deafening adult mice recovers rapid ocular dominance plasticity (ODP) mainly by accelerating potentiation of the open-eye responses. Our results suggest that cross-modal sensory deprivation promotes adult cortical plasticity by specifically recovering TC-LTP and increasing the E/I ratio.

Keywords: E/I ratio; NMDA receptor function; adult cortical plasticity; cross-modal plasticity; thalamocortical LTP; visual cortex.


Conflict of interest statement

DECLARATION OF INTERESTS

The authors declare no competing interests.

Figures

Figure 1.
Figure 1.. Deafening Specifically Recovers TC-LTP in Adult V1 L4
(A) Schematic of V1 recordings where LGN terminals expressed ChR2. LTP and LTD were induced using a pairing protocol, where postsynaptic depolarization to 0 mV and −40 mV, respectively, was paired with presynaptic stimulation with light pulses (455 nm LED; 5 ms pulse duration, 200 pulses at 1 Hz). (B) Left: low-magnification image of a V1 slice showing ChR2-YFP (green) expression in LGN axons especially in L4. Blue, DAPI. Right: high-magnification image of a recorded L4 neuron filled with biocytin (red) surrounded by ChR2-YFP-expressing LGN axons. (C) Left: TC-LTP in adult DF mice (red, n = 9 cells/5 mice, *p < 0.02 between baseline and 30 min post-pairing), but not in NR (blue, n = 9 cells/6 mice, not significant [N.S.]p = 0.9934). APV blocked LTP in the DF group (open circles, n = 6 cells/3 mice, N.S. p = 0.7564). Bottom: no significant change in input resistance (Ri). Right: example average EPSPs taken before (left) and 30 min after pairing (right). (D) Left: lack of TC-LTD in adult control (NR: blue, n = 9 cells/5 mice, N.S. p = 0.7152) and DF (red, n = 9 cells/5 mice, p = 0.3824). Bottom: no significant change in Ri. Right: example average EPSPs taken before (left) and 30 min after pairing (right). Data plotted are mean ± SEM.
Figure 2.
Figure 2.. Regulation of NMDAR Function at TC Synapses onto Adult V1 L4 Neurons following Deafening
(A). Left: NMDA/AMPA ratio measurements for the NR and DF groups (open circles represent individual cells; NR = 0.49 ± 0.045, 4 mice; DF = 0.43 ± 0.067, 5 mice; t test, N.S. p = 0.5173). Right: averaged example traces for an NR cell (blue) and DF cell (red) normalized to the AMPAR component in NR. The AMPAR component was measured at the peak recorded at −80 mV, while the NMDAR component was measured 70 ms after the onset of the compound EPSC recorded at +40 mV. (B). Left: weighted decay time constant (Tw) for a pharmacologically isolated NMDAR current measured at +40 mV for the NR and DF groups (open circles represent individual cells; NR = 89.31 ± 11.97 ms, 4 mice; DF = 63.93 ± 6.3 ms, 3 mice; t test, N.S. p = 0.0961). Right: averaged NMDAR responses for the NR (blue) and DF (red) groups normalized to the maximum amplitudes. Bar graphs: mean ± SEM.
Figure 3.
Figure 3.. Deafening Adults Did Not Change the Strength of TC Inputs to PV+ Interneurons and Enhanced E/I Ratio of TC Inputs to V1 L4 Neurons
(A). Schematic of a td-Tomato-expressing PV+ neuron (red) targeted in V1 L4 for LEv-Sr+2 mEPSCs recordings to assess the strength of TC synapses. (B). Confocal image of a V1 slice showing LGN axons expressing ChR2-YFP (green) and PV+ neurons expressing Td-Tomato (red) and counterstained for DAPI (blue). (C). Left: example traces of LEv-Sr2+ mEPSCs from the NR (top) and DF (bottom) groups. Dashed gray line represents the time window used to measure spontaneous mEPSC events before LED stimulation (blue triangle, 455 nm, 5 ms duration). Solid blue line represents the time window used to measurethe post-LED events. From the measured post-LED events, pre-LED spontaneous events were mathematically subtracted (see STAR Methods) to obtain the events evoked by ChR2 activation of TC axons. Middle: average traces of calculated LEv-Sr2+-mEPSCs (NR, blue; DF, red). Right: comparison of average amplitude of TC LEv-Sr2+-mEPSCs between NR and DF (open circles represent individual cells; NR = 18.9 ± 1.7 pA, 7 mice; DF = 19.6 ± 1.65 pA, 7 mice; t test, N.S. p = 0.7893). (D). Left: schematic showing targeted V1 L4 principal neurons for E/I ratio recording where thalamic terminals (green) were stimulated with light (455 nm) to evoke a monosynaptic EPSC and a disynaptic inhibitory postsynaptic current (IPSC) responses in L4. Middle: average trace of LED evoked monosynaptic eEPSC (inward current recorded at EGABA = —52 mV) and disynaptic eIPSC (outward current recorded at Eglu = 0 mV) from a L4 cell after light stimulation of ChR2-expressing LGN axons. Right: significant increase in average E/I ratio values after DF (open circles represent each cell; NR, 4 mice; DF, 4 mice; t test, *p = 0.0127). Bar graphs: mean ± SEM.
Figure 4.
Figure 4.. Deafening Accelerated Ocular Dominance Plasticity in Adult V1 by Promoting Open-Eye Potentiation
(A). Outline of experimental groups. (B). Schematic of visual stimulus presented while recording V1 intrinsic signals. (C). A representative images and data from a young mouse (young short MD). Left: surface vasculature used to guide imaging in the same animal before (top) and after (bottom) MD. Scale bars, 1 mm. Middle two panels: V1 intrinsic signals recorded before (top) and after (bottom) MD for contralateral (C) and ipsilateral (I) eyes (an open circle indicates an open eye, and a closed circle indicates a closed eye; L, lateral, R, rostral). Right: histogram showing the distribution of pixels corresponding to ODI values. Note a left shift in the distribution after MD indicating that more pixels having a lower ODI (ODI = 0 indicates neurons responding equally to both eyes). (D). Deafening accelerates ODP in the adult V1. Comparison of ocular dominance index [ODI = (C − I)/(C + I)] pre- and post-MD (bars show mean + SEM, gray lines connect ODI values measured pre- and post-MD for each mouse). Short (3–4 days) MD in young mice during the critical period (gray bars) shows a significant shift in ODI toward the open eye (pre = 0.378 ± 0.036, post = 0.1534 ± 0.044; paired t test, *p = 0.0132). A week of deafening adult mice prior to a short (3- to 4-day) MD (red bars) also allows a significant shift in ODI toward the open eye (pre = 0.3164 ± 0.048, post = 0.083 ± 0.068; paired t test *p = 0.0121). The same short-duration MD (3–4 days) in normal adult mice failed to shift ODI (pre = 0.264 ± 0.023, post = 0.2389 ± 0.044; paired t test, N.S. p = 0.5892). However, a longer-duration MD (5–6 days) significantly shifted ODI in normal adults (pre = 0.2682 ± 0.035, post = 0.1411 ± 0.060; paired t test *p = 0.170). Bar graphs: mean ± SEM. (E). Comparison of average eye-specific V1 activation signal intensity through contralateral eye (square symbols with solid line) and ipsilateral eye (triangles with dashed line) pre- and post-MD. In young mice, short MD (3–4 days) significantly decreased the intensity of signal from the closed contralateral eye while it increased that from the open ipsilateral eye (contralateral: pre = 1.76 ± 0.12, post =1.41 ± 0.16, paired t test *p = 0.0204; ipsilateral: pre = 0.72 ± 0.16, post = 1.21 ± 0.35, paired t test *p = 0.0213). In adults deafened for 1 week prior to short MD (3–4 days), there was only a significant increase in the intensity of signal from the open ipsilateral eye (contralateral: pre = 1.83 ± 0.21, post = 1.68 ± 0.12, paired t test N.S. p = 0.52; ipsilateral: pre =1.02 ± 0.16, post = 1.48 ± 0.18, paired t test *p = 0.0207). In normal adults, short MD (3–4 days) did not alter the intensity of signal from either eye (contralateral: MD = 1.9 ± 0.13, MD = 1.84 ± 0.16, paired t test N.S. p = 0.6782; ipsilateral: pre = 1.12 ± 0.09, post =1.12 ± 0.10, paired t test N.S. p = 0.9168), but a longer-duration MD (5–6 days) significantly increased the intensity of signal from the open ipsilateral eye (contralateral: pre = 1.81 ± 0.14, post =1.82 ± 0.18, paired t test p = 0.9629; ipsilateral: pre =1.08 ± 0.13, post = 1.45 ± 0.11, paired t test *p = 0.0328). Data plotted are mean ± SEM.

References

    1. Barkat TR, Polley DB, and Hensch TK (2011). A critical period for auditory thalamocortical connectivity. Nat. Neurosci 14, 1189–1194. - PMC - PubMed
    1. Barth AL, and Malenka RC (2001). NMDAR EPSC kinetics do not regulate the critical period for LTP at thalamocortical synapses. Nat. Neurosci 4, 235–236. - PubMed
    1. Cang J, Kalatsky VA, Lowel S, and Stryker MP (2005). Optical imaging of the intrinsic signal as a measure of cortical plasticity in the mouse. Vis. Neurosci 22, 685–691. - PMC - PubMed
    1. Chittajallu R, and Isaac JT (2010). Emergence of cortical inhibition by coordinated sensory-driven plasticity at distinct synaptic loci. Nat. Neurosci 13, 1240–1248. - PMC - PubMed
    1. Chung S, Jeong JH, Ko S, Yu X, Kim YH, Isaac JTR, and Koretsky AP (2017). Peripheral sensory deprivation restores critical-period-like plasticity to adult somatosensory thalamocortical inputs. Cell Rep 19, 2707–2717. - PMC - PubMed

Publication types

Substances

LinkOut - more resources