. 2018 Sep 25;24(13):3607-3618.
doi: 10.1016/j.celrep.2018.08.085.

Synthesizing Signaling Pathways from Temporal Phosphoproteomic Data

Affiliations

Synthesizing Signaling Pathways from Temporal Phosphoproteomic Data

Ali Sinan Köksal et al. Cell Rep. .

Abstract

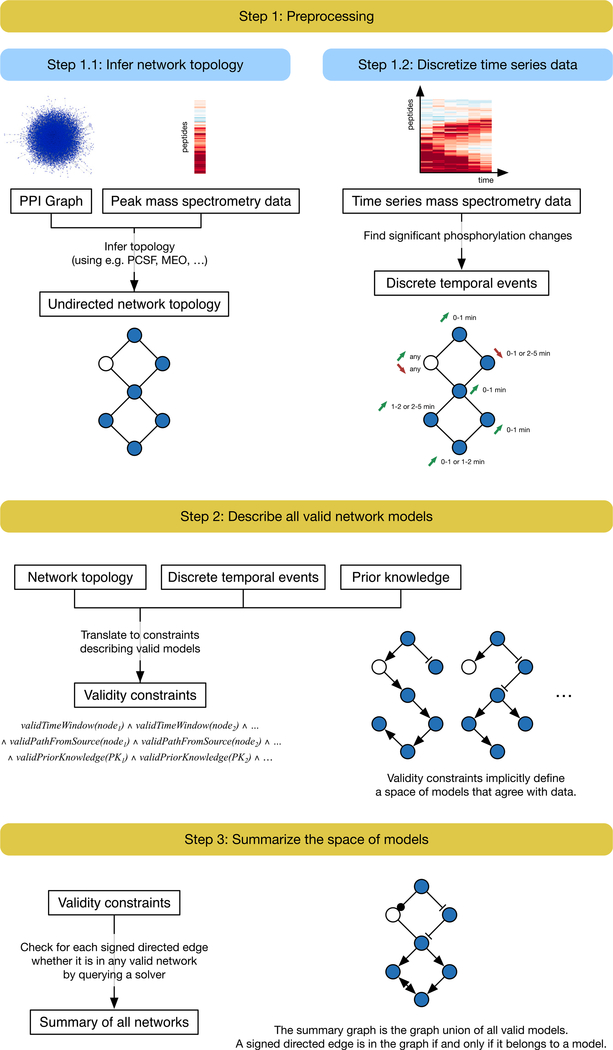
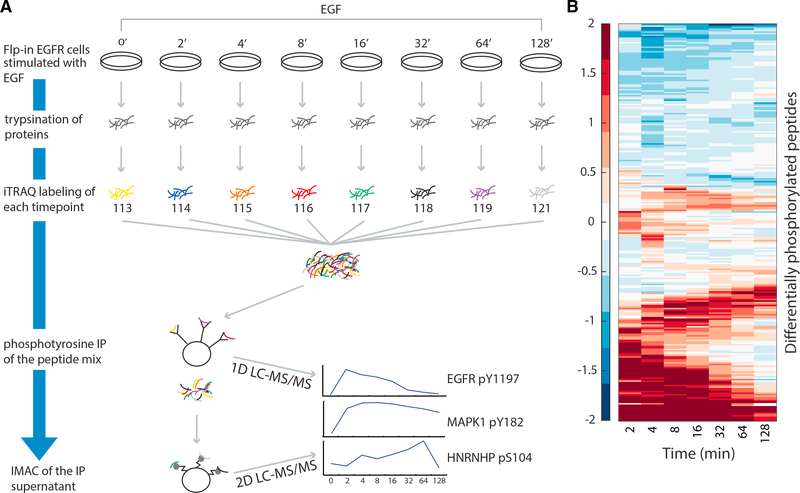
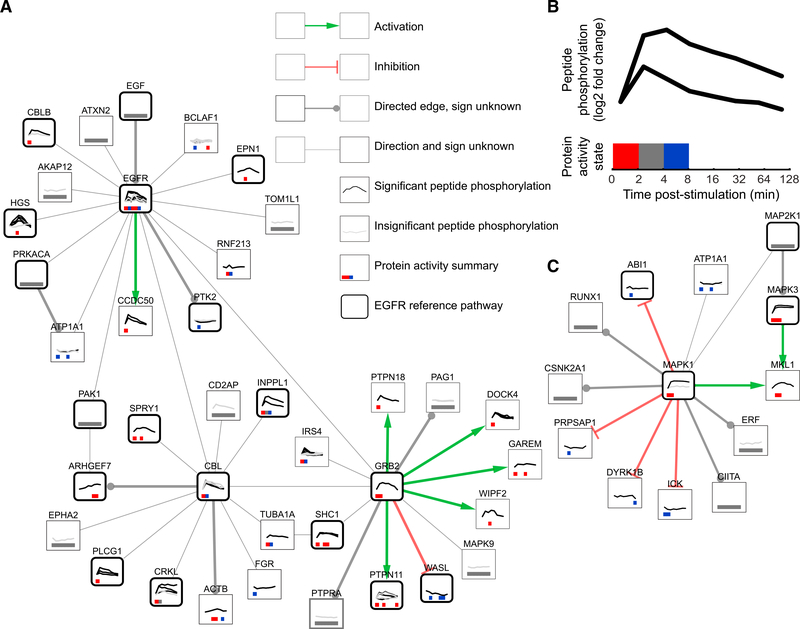
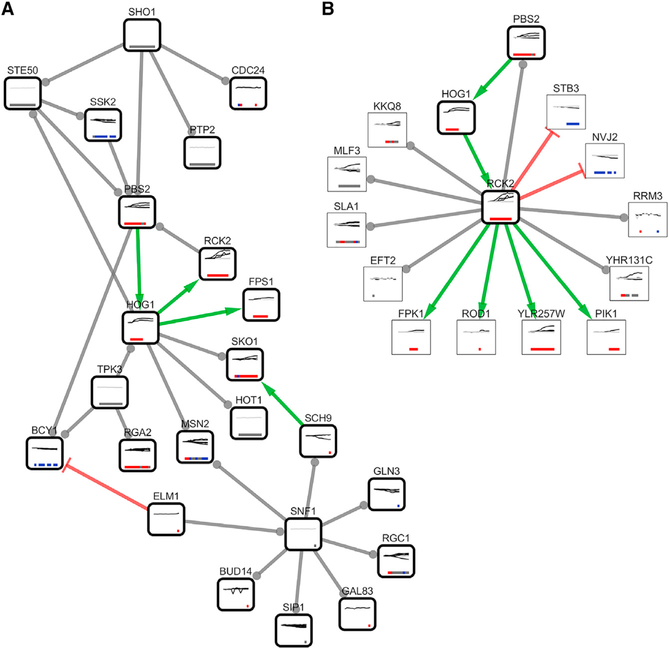
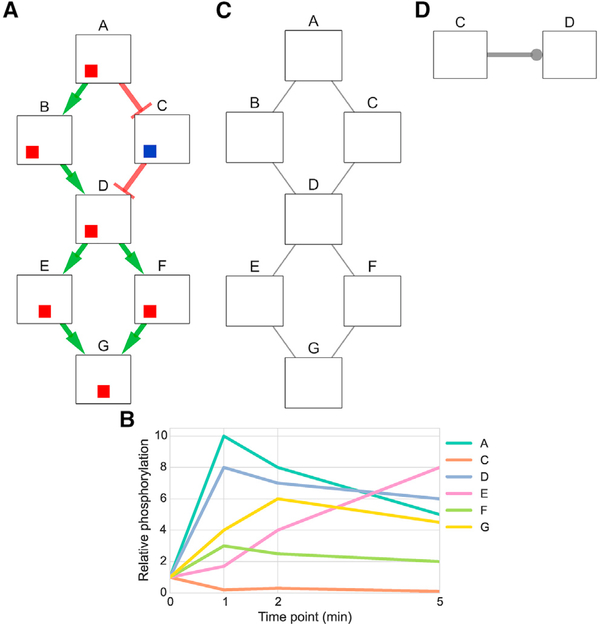
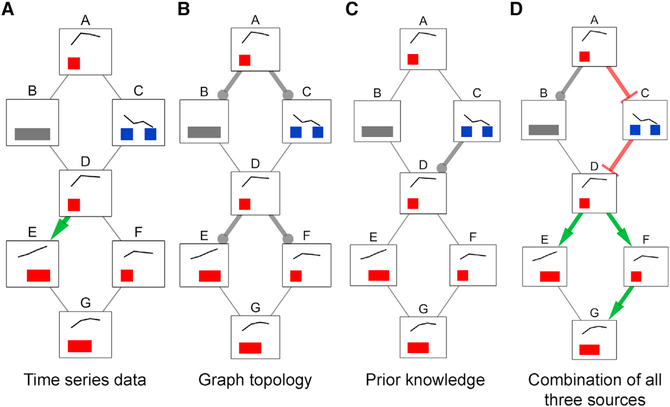
We present a method for automatically discovering signaling pathways from time-resolved phosphoproteomic data. The Temporal Pathway Synthesizer (TPS) algorithm uses constraint-solving techniques first developed in the context of formal verification to explore paths in an interaction network. It systematically eliminates all candidate structures for a signaling pathway where a protein is activated or inactivated before its upstream regulators. The algorithm can model more than one hundred thousand dynamic phosphosites and can discover pathway members that are not differentially phosphorylated. By analyzing temporal data, TPS defines signaling cascades without needing to experimentally perturb individual proteins. It recovers known pathways and proposes pathway connections when applied to the human epidermal growth factor and yeast osmotic stress responses. Independent kinase mutant studies validate predicted substrates in the TPS osmotic stress pathway.

Keywords: mass spectrometry; network algorithm; program synthesis; protein-protein interactions; time series phosphorylation.


Conflict of interest statement

DECLARATION OF INTERESTS

R.B. consults with NVIDIA.

Figures

Figure 1.
Figure 1.. TPS Workflow
First, the PPI graph is combined with the phosphorylation data to obtain a condition-specific network (step 1.1). This step does not model the temporal information and instead uses the phosphorylation peak, the highest magnitude fold change. Separately, the time series data are converted into discrete timed signaling events (step 1.2). TPS then defines a space of models that agree with the data by transforming the timed events, undirected network topology, and prior knowledge (kinase-substrate interaction directions in this study) into a set of constraints (step 2). It summarizes the solution space by computing the union of all signed, directed graph models that satisfy the given constraints (step 3). The final pathway model predicts how a subset of generic physical protein interactions coordinates to respond to a specific stimulus in a particular cellular context.
Figure 2.
Figure 2.. Overview of the EGF Response Proteomics Analysis
(A) Cells are stimulated with EGF for 0, 2, 4, 8, 16, 32, 64, or 128 min and then lysed. Cellular protein content is denatured and digested. Peptides are labeled with iTRAQ and mixed. Tyrosine phosphorylated peptides are enriched by immunoprecipitation, and the flowthrough is passed over immobilized metal affinity chromatography to enrich for phosphorylation events on serine and threonine. The phosphotyrosine-rich fraction is analyzed by 1D-LC-MS/MS. The more complex phospho-serine/threonine-rich fraction is analyzed by 2D-LC-MS/MS. Resulting spectra are identified and quantified using Comet. (B) The 263 peptides with significant temporal changes in phosphorylation exhibit distinct types of temporal behaviors (log2 fold change with respect to prestimulation intensity). One group of peptides is activated immediately upon stimulation, whereas others display delayed waves of phosphorylation as signals propagate. See also Figures S1 and S2 and Data S1 and S2.
Figure 3.
Figure 3.. TPS EGF Response Pathway Model
Zoomed regions of the full TPS pathway model visualized with Cytoscape (Shannon et al., 2003).(A) The EGFR subnetwork (EGFR, GRB2, CBL, and all their direct neighbors) depicts the proteins that first react to EGF stimulation. A substantial portion (18 of 38 proteins) is known to be associated with EGFR signaling. Green and red edges depict activation and inhibition, respectively. Gray edges that terminate in a circle indicate that the interaction is used in the same direction in all possible pathway models, but the sign is ambiguous. Thin, undirected edges are used in different directions in different valid pathway models. Thick, rounded borders show which proteins are present in one or more reference EGFR pathways. Node annotations are detailed in (B). (B) Line graphs on each protein node show the temporal peptide phosphorylation changes relative to the pre-stimulation level on a log2 scale. Multiple lines indicate multiple observed phosphopeptides for that protein, where black lines denote statistically significant phosphorylation changes and gray lines indicate insignificant changes. Proteins without line graphs are connective Steiner nodes inferred by PCSF. Colored boxes summarize the TPS inferred activity state across peptides at each time point. Red indicates activation, blue inhibition, gray ambiguity, and white inactivity. (C) The subnetwork surrounding MAPK1 and MAPK3. TPS correctly determines that MAP2K1 is the kinase that controls both MAPK1 and MAPK3, even though it is not observed in the mass spectrometry data. See also Figures S3 and S4, Table S1, and Data S3 and S4.
Figure 4.
Figure 4.. TPS Osmotic Stress Response Pathway Model
(A) The portion of the TPS yeast osmotic stress response pathway model for which both proteins are in the osmotic stress reference pathway. TPS correctly recovers the core pathway structure from the Sho1 osmosensor to the primary kinases and transcription factors by ordering proteins based on the phosphorylation timing. Twelve of these pathway interactions are supported by the KEGG high-osmolarity pathway or other literature (Data S4). Node and edge visualizations are as in Figure 3. Note that three interactions (Ste50 → Pbs2, Ste50 → Ssk2, and Rck2 → Pbs2), derived from references (Chasman et al., 2014; Sharifpoor et al., 2011), are not found in other curated versions of the yeast interaction network. (B) A zoomed view of the TPS pathway depicting Rck2 and the proteins it is predicted to interact with. All four proteins predicted to be activated by Rck2—Fpk1, Pik1, Rod1, and YLR257W—displayed decreased phosphorylation in the RCK2 mutant strain (Romanov et al., 2017), as did predicted targets Mlf3, Sla1, and YHR131C. See also Figure S5 and Data S3 and S4.
Figure 5.
Figure 5.. Artificial Example Illustrating the Inputs to TPS
(A) The hypothetical signaling pathway that responds to stimulation of node A. The colored boxes on each node show the time at which the protein is activated or inhibited and begins influencing its downstream neighbors, with the leftmost position indicating the earliest time point. Red boxes are increases in activity, blue boxes are decreases, and white boxes are inactive time points, as in Figure 3B. The left position indicates the activity at 0 to 1 min, the center position at 1 to 2 min, and the right position at 2 to 5 min. (B) The first input to TPS is time series phosphorylation data of the response to stimulating node A. (C) The second input is an undirected graph of high-confidence interactions that can recover hidden components that do not appear in the temporal data, such as node B. (D) The last input, which is optional, is prior knowledge of the pathway interactions expressed as (unsigned) directed edges. We represent unsigned edges with a circular arrowhead.
Figure 6.
Figure 6.. TPS Models for Individual versus Combined Data Sources
Summary graphs obtained by aggregating (via graph union) all possible signed, directed tree models for different constraints obtained from time series data (A), graph topology (B), prior knowledge (in this example, kinase-substrate interaction directions) (C), and all three types of input at the same time (D). If an edge has a unique sign and direction in a summary graph (colored green and red for activations and inhibitions, respectively), this means there are no valid models that assign a different orientation or sign to that edge. Edges that can have any combination of sign and direction in different models are gray without an arrowhead. See also Figure S7.

References

    1. Bailly-Bechet M, Borgs C, Braunstein A, Chayes J, Dagkessamanskaia A, Franҫois J-M, and Zecchina R (2011). Finding undetected protein associations in cell signaling by belief propagation. Proc. Natl. Acad. Sci. USA 108, 882–887. - PMC - PubMed
    1. Bar-Joseph Z, Gitter A, and Simon I (2012). Studying and modelling dynamic biological processes using time-series gene expression data. Nat. Rev. Genet 13, 552–564. - PubMed
    1. Bauer-Mehren A, Furlong LI, and Sanz F (2009). Pathway databases and tools for their exploitation: benefits, current limitations and challenges. Mol. Syst. Biol 5, 290. - PMC - PubMed
    1. Benner SA, and Sismour AM (2005). Synthetic biology. Nat. Rev. Genet 6, 533–543. - PMC - PubMed
    1. Budak G, Eren Ozsoy O, Aydin Son Y, Can T, and Tuncbag N (2015). Reconstruction of the temporal signaling network in Salmonella-infected human cells. Front. Microbiol 6, 730. - PMC - PubMed

Publication types

LinkOut - more resources