. 2018 Sep 25;24(13):3619-3629.e4.
doi: 10.1016/j.celrep.2018.08.080.

Single-Cell RNA-Seq Uncovers a Robust Transcriptional Response to Morphine by Glia

Affiliations

Single-Cell RNA-Seq Uncovers a Robust Transcriptional Response to Morphine by Glia

Denis Avey et al. Cell Rep. .

Abstract

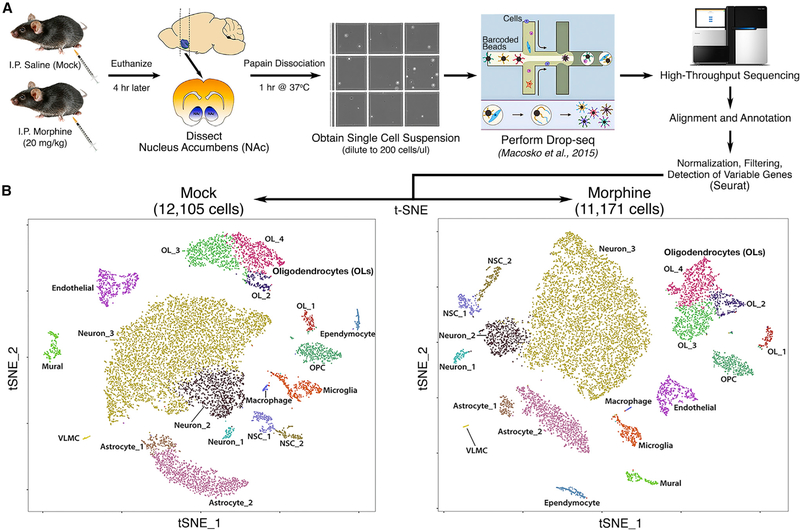
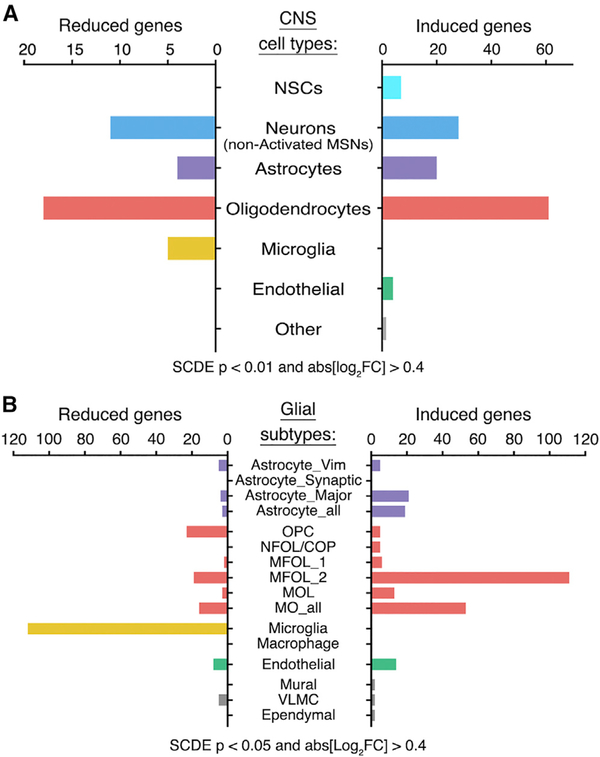
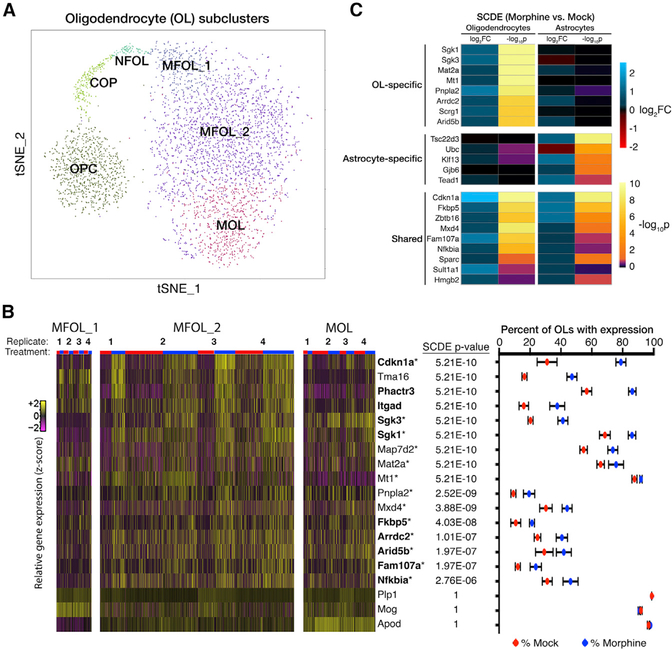
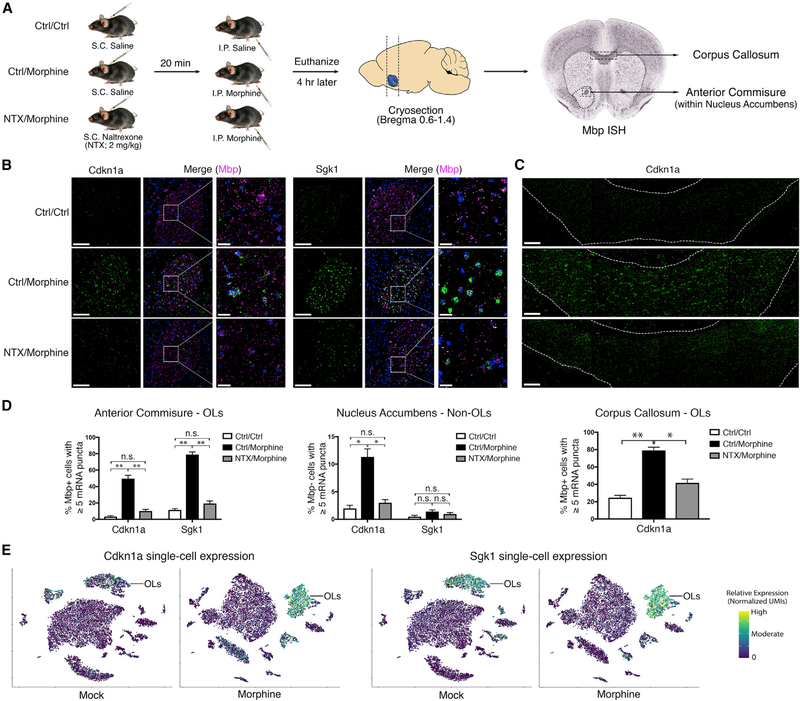
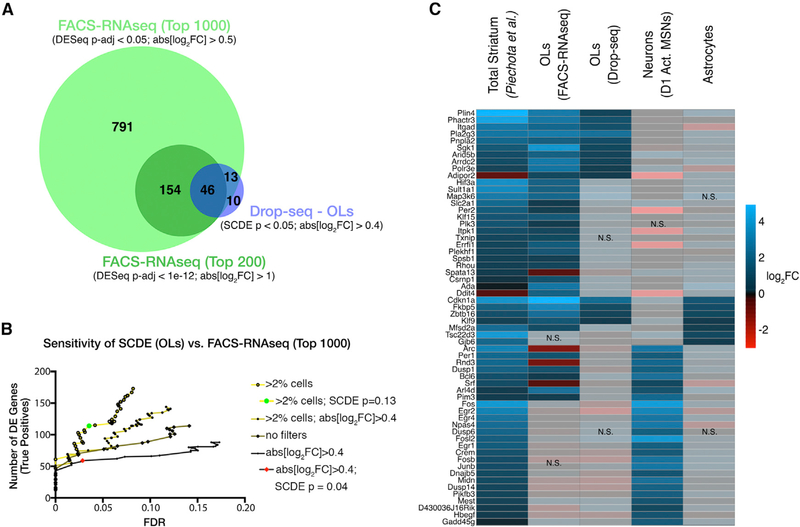
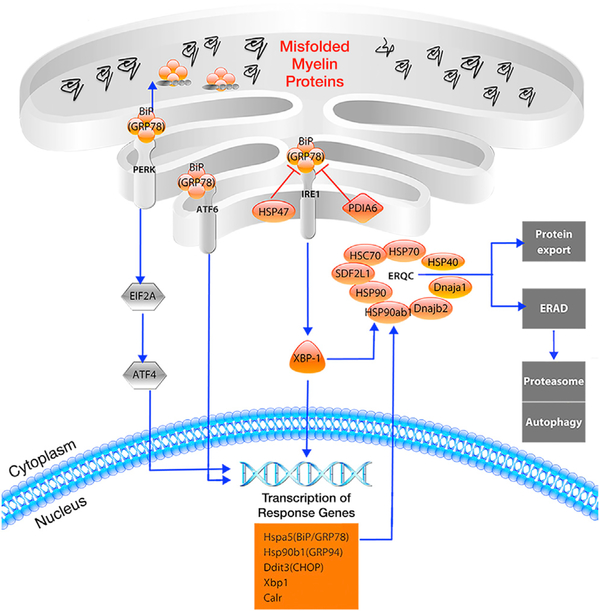
Molecular and behavioral responses to opioids are thought to be primarily mediated by neurons, although there is accumulating evidence that other cell types play a prominent role in drug addiction. To investigate cell-type-specific opioid responses, we performed single-cell RNA sequencing (scRNA-seq) of the nucleus accumbens of mice following acute morphine treatment. Differential expression analysis uncovered unique morphine-dependent transcriptional responses by oligodendrocytes and astrocytes. We examined the expression of selected genes, including Cdkn1a and Sgk1, by FISH, confirming their induction by morphine in oligodendrocytes. Further analysis using RNA-seq of FACS-purified oligodendrocytes revealed a large cohort of morphine-regulated genes. The affected genes are enriched for roles in cellular pathways intimately linked to oligodendrocyte maturation and myelination, including the unfolded protein response. Altogether, our data illuminate the morphine-dependent transcriptional response by oligodendrocytes and offer mechanistic insights into myelination defects associated with opioid abuse.

Keywords: RNA-seq; UPR; addiction; glucocorticoid; morphine; myelin; nucleus accumbens; oligodendrocyte; opioid; single-cell.


Conflict of interest statement

DECLARATION OF INTERESTS

The authors declare no competing interests.

Figures

Figure 1.
Figure 1.. Unbiased Single-Cell RNA-Seq Analysis Identified 18 Distinct Cell Types in the Nucleus Accumbens of Mice
(A) Flowchart showing an overview of the single-cell RNA-seq experimental design. (B) Spectral t-SNE plots of all cells analyzed from mock-treated mice (12,105) or morphine-treated mice (11,171), colored by density clustering and annotated by cell-type identity. OPC, oligodendrocyte progenitor cell; NSC, neural stem cell; VLMC, vascular and leptomeningeal cell
Figure 2.
Figure 2.. Iterative Clustering of Neurons Enables the Identification of a Subpopulation of Morphine-Activated MSNs
(A) Spectral t-SNE plot of 13,033 neurons, annotated by cell-type identity. MSN, medium spiny neuron. (B) Zoomed view of all-neuron t-SNE with cells colored by treatment. Bar graph displays the percentage of total neurons in the activated MSN cluster, stratified bytreatment and expression of the dopamine receptor (D1 versus D2). Error bars show SD among four biological replicates (*p = 0.028, paired t test, two-sided).
Figure 3.
Figure 3.. SCDE Analysis Uncovered Cell-Type-Specific Responses to Morphine
(A and B) We performed single-cell differential expression (SCDE) (morphine versus mock) on each t-SNE cluster. The total number of unique genes significantly induced or reduced by morphine is shown, grouped by (A) major CNS cell type or (B) glial subpopulation. Astrocyte_Vim, Astrocyte_Synaptic, and Astrocyte_Major refer to three subclusters of astrocytes, and Astrocyte_all is the combined analysis of all astrocytes. MO_all denotes the combined analysis of all MFOLs and/or mature oligodendrocytes (e.g., MFOL_1, MFOL_2, and MOL). See STAR Methods and Table S2 for additional details. Full terms for abbreviations of oligodendrocyte clusters (red) are given in the legend of Figure 4
Figure 4.
Figure 4.. Iterative Clustering and SCDE Revealed a Robust Morphine-Dependent Transcriptional Response by Oligodendro-cytes
(A) Iterative clustering of all 3,817 oligodendrocytes (OLs) reveals subpopulations corresponding to OL maturation state. OPC, oligodendrocyte progenitor cell; COP, differentiation-committed OL progenitor; NFOL, newly formed OL; MFOL, myelin-forming OL; MOL, mature OL. (B) Morphine robustly modulates the expression of several genes in OLs. (Left) Heatmap of relative gene expression for a subset of genes in three clusters of MFOLs and/or mature OLs. Columns representing individual cells are ordered horizontally by biological replicate and treatment (red, mock; blue, morphine). Bolded genes have been previously reported to be induced by morphine in the mouse striatum, and those marked with an asterisk are reported targets of the glucocorticoid receptor (GR). (Right) SCDE p value and expression percentages for combined analysis of all MFOLs and/or mature OLs (MFOL_1, MFOL_2, and MOL). Expression is defined as detection of ≥1 transcript. Dots and error bars are, respectively, the mean and SD among four biological replicates. (C) Morphine regulates the expression of distinct subsets of GR target genes in OLs and astrocytes
Figure 5.
Figure 5.. In Vivo Validation of Oligodendrocyte-Specific Morphine-Dependent Gene Expression by FISH
(A) Schematic of experimental design. Pre-treatment with naltrexone (NTX) should block morphine responses mediated by opioid receptor activation. Mbp in situ hybridization (ISH) (from the Allen Brain Atlas database) is shown to illustrate regions with high densities of OLs. (B and C) Expression of Cdkn1a and Sgk1 is induced by morphine in OLs in an opioid receptor-dependent manner. Representative images of the anterior commissure (B) and corpus callosum (C) are shown. Signals are pseudocolored by expression of Cdkn1a (green), Sgk1 (green), Mbp (magenta), and/or DAPI (blue). Scale bars, 100 μm (left panels) and 20 mm (right panels and zoomed view). (D) Quantification of the percentage of OLs (left panel: n = 781 cells; right panel: n = 1,374 cells) or of non-OLs (middle panel: n = 1,000 cells) with ≥5 puncta of Cdkn1a or Sgk1 (3 mice per condition; paired t test, two-sided; NS, not significant; **p < 1e4, *p < 0.05). t-SNE plots of all cells from mock- or morphine-treated mice overlaid with expression of Cdkn1a or Sgk1 indicates that the morphine-dependent induction of these genes occurs predominantly in OLs. In the case of Cdkn1a, a modest induction was also detected in astrocytes and endothelial cells.
Figure 6.
Figure 6.. Bulk RNA-Seq of FACS-Isolated OLs Revealed a Remarkable Extent of Transcriptional Regulation by Morphine
(A) Venn diagram illustrating significant overlap between DE genes identified from Drop-seq (OLs) or FACS-RNA-seq. (B) We improved the sensitivity of single-cell DE analysis with minimal loss in specificity. The number of DE genes (true positives: present in the FACS-RNA-seq top 1,000 list) detected by SCDE of OLs was plotted versus the empirical false discovery rate (FDR; STAR Methods). We optimized SCDE by filtering out genes expressed in less than 2% of cells, removing a fold-change cutoff, and relaxing the p value cutoff to 0.13 (green circle). (C) Left column of the heatmap shows the relative morphine-dependent induction (log2FC morphine versus saline: 4 hr) of a subset of genes previously reported to be induced by morphine, as assessed by microarray of total striatum (Piechota et al., 2010). We filtered the top 100 morphine-regulated genes from that dataset for those significantly affected in OLs (FACS-RNA-seq and/or Drop-seq), Drd1a-expressing activated MSNs (D1 Act. MSNs), or astrocytes to obtain the 60 genes shown here. Opaque blocks (labeled NS) indicate changes that were not statistically significant (p < 0.05)
Figure 7.
Figure 7.. Several Components of the UPR Are Downregulated by Morphine in OLs
Genes downregulated by morphine in OLs (p-adj < 1e-8, log2FC < −0.5) are shown in orange, and unaffected factors are shown in gray. The expression of Xbp1 (XBP-1), as well as numerous XBP-1-induced genes (shown in the orange box), are reduced by morphine, as are several endoplasmic reticulum (ER) chaperone proteins involved in ER quality control (ERQC). These chaperones assist in the proper folding and export of proteins or target misfolded proteins to the proteasome by a process known as ER-associated degradation (ERAD). The downregulation of these factors might lead to the increased accumulation and/or export of misfolded proteins, including myelin constituents

References

    1. Albertson DN, Schmidt CJ, Kapatos G, and Bannon MJ (2006). Distinctive profiles of gene expression in the human nucleus accumbens associated with cocaine and heroin abuse. Neuropsychopharmacology 31, 2304–2312. - PMC - PubMed
    1. Ammon-Treiber S, Grecksch G, Stumm R, Riechert U, Tischmeyer H, Reichenauer A, and Höllt V (2004). Rapid, transient, and dose-dependent expression of hsp70 messenger RNA in the rat brain after morphine treatment.Cell Stress Chaperones 9, 182–197. - PMC - PubMed
    1. Bach AG, Jordan B, Wegener NA, Rusner C, Kornhuber M, Abbas J, and Surov A (2012). Heroin spongiform leukoencephalopathy (HSLE). Clin. Neuroradiol. 22, 345–349. - PubMed
    1. Bauer IE, Soares JC, and Nielsen DA (2015). The role of opioidergic genes in the treatment outcome of drug addiction pharmacotherapy: a systematic review. Am. J. Addict 24, 15–23. - PubMed
    1. Bora E, Yücel M, Fornito A, Pantelis C, Harrison BJ, Cocchi L, Pell G, and Lubman DI (2012). White matter microstructure in opiate addiction. Addict. Biol 17, 141–148. - PubMed

Publication types

MeSH terms