

Determinants of Self-Rated Health Perception in a Sample of a Physically Active Population: PLENUFAR VI Study
- PMID: 30257464
- PMCID: PMC6210315
- DOI: 10.3390/ijerph15102104
Determinants of Self-Rated Health Perception in a Sample of a Physically Active Population: PLENUFAR VI Study
Abstract
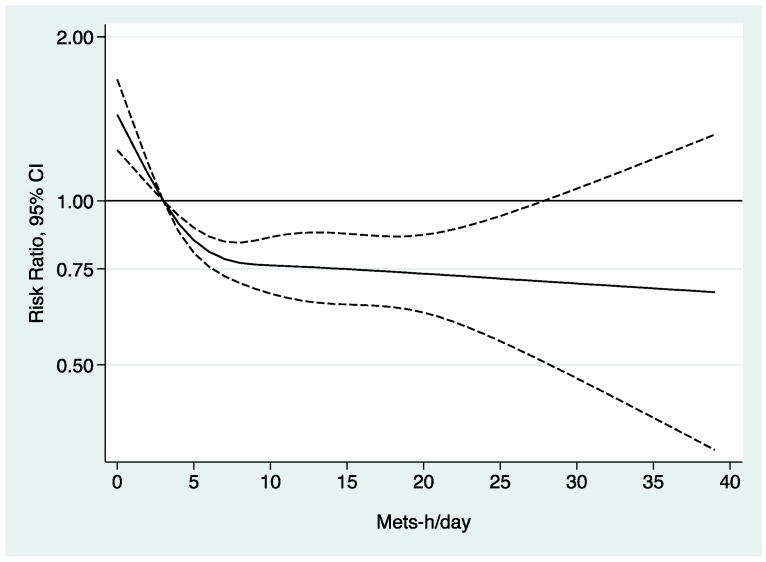
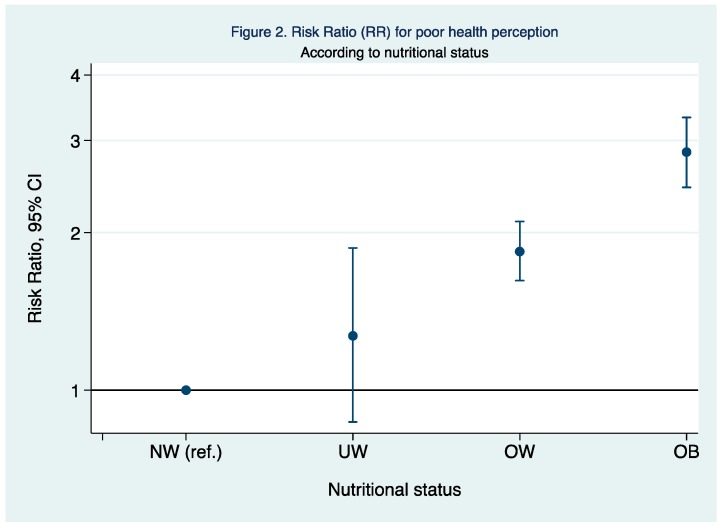
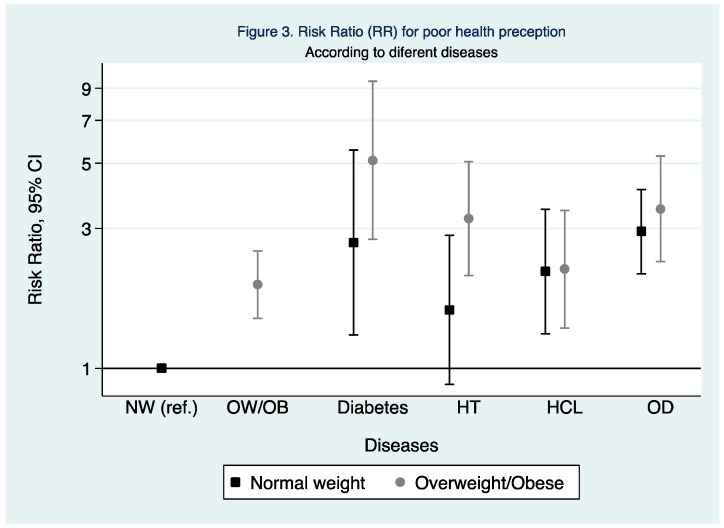
The aim of this study was to investigate determinants of self-rated health (SRH) perception in Spanish adults. This cross-sectional study including data from 11,342 participants from the Spanish PLENUFAR VI study. SRH status was grouped in two categories ('good'/'poor') and the associations of socio-demographic characteristics, lifestyles, diet adequacy and chronic disease with SRH were assessed. After adjusting for relevant confounders, the risk ratios (RR) and (95% confidence intervals) for poor SRH were 1.05 (1.03⁻1.07) for each hour of increment of sitting, 1.56 (1.30⁻1.88) for short (≥5 h vs. 7⁻8 h) sleep duration, 0.63 (0.55⁻0.72) for vigorous (vs. light) physical activity, 0.61 (0.50⁻0.74) for adequate (vs. non-adequate) diet. Activities like jogging [RR for each unit of increment in the METs-h/day = 0.87 (0.82⁻0.92)], gymnastics [0.87 (0.81⁻0.93)], biking [0.91 (0.85⁻0.98)], and track and field [0.94 (0.89⁻0.98)], were associated with better health perception. Normally weight participants with any chronic disease had lower probability to report poor SRH than overweight/obese participants with any chronic disease. Frequent consumption of bread (>2 servings/day) was associated with a lower adjusted mean of health perception scale, while higher consumption of vegetables and fruit or fish were associated with higher values, concerning good SRH. We can conclude that normal-weight participants even suffering a chronic disease had lower probability to report poor health perception than participants with overweight/obesity and a chronic disease especially for hypertension and diabetes. Activities like jogging, gymnastics, biking, and track and field, and a higher consumption of fruits, vegetables and fish, were associated with better health rated perception.
Keywords: diet adequacy; lifestyles; nutritional status; physical activity; self-rated health.
Conflict of interest statement
The authors declare no conflict of interest.
Figures
References
-
- Ministerio de Sanidad, Consumo y Bienestar Social . Encuesta Nacional de Salud ENSE 2017. Ministerio de Sanidad, Consumo y Bienestar Social; Madrid, España: 2018. [(accessed on 19 July 2018)]. Available online: https://www.msssi.gob.es/estadEstudios/estadisticas/encuestaNacional/enc....
Publication types
MeSH terms
LinkOut - more resources
Full Text Sources
Other Literature Sources
Medical
