. 2018 Sep 25;15(10):2110.
doi: 10.3390/ijerph15102110.

Research on Water Environment Regulation of Artificial Playground Lake Interconnected Yangtze River

Affiliations

Research on Water Environment Regulation of Artificial Playground Lake Interconnected Yangtze River

Weiwei Song et al. Int J Environ Res Public Health. .

Abstract

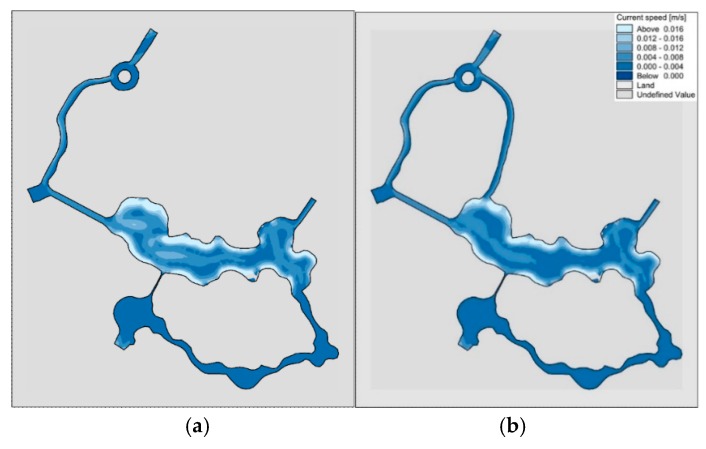
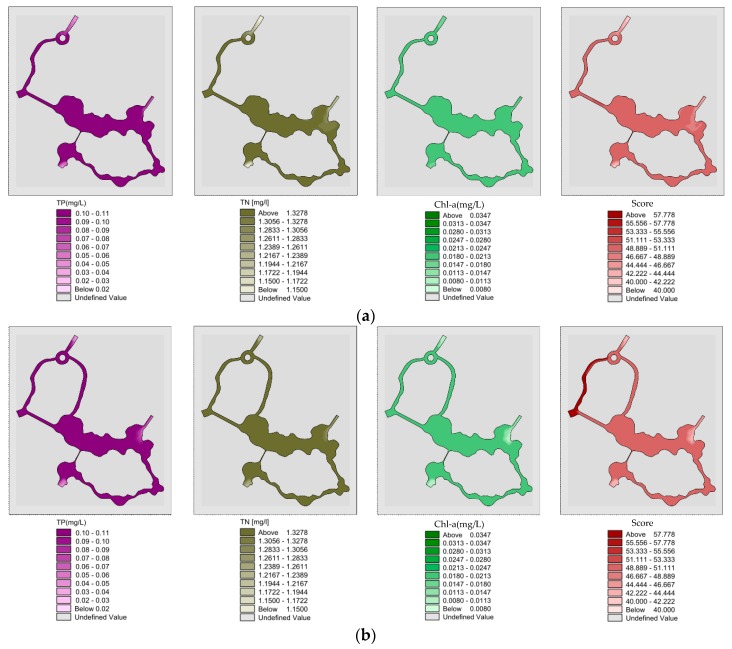
With the rapid development of China, water pollution is still a serious problem despite implementation of control measures. Reasonable water environment management measures are very important for improving water quality and controlling eutrophication. In this study, the coupled models of hydrodynamics, water quality, and eutrophication were used to predict artificial Playground Lake water quality in the Zhenjiang, China. Recommended "unilateral" and "bilateral" river numerical models were constructed to simulate the water quality in the Playground Lake without or with water diversion by pump, sluice and push pump. Under "unilateral" and "bilateral" river layouts, total nitrogen and total phosphorus meet the landscape water requirement through water diversion. Tourist season in spring and summer and its suitable temperature result in heavier eutrophication, while winter is lighter. Under pumping condition, water quality and eutrophication of "unilateral" river is better than "bilateral" rivers. Under sluice diversion, the central landscape lake of "unilateral river" is not smooth, and water quality and eutrophication is inferior to the "bilateral". When the water level exceeds the flood control level (4.1 m), priority 1 is launched to discharge water from the Playground Lake. During operation of playground, when water level is less than the minimum level (3.3 m), priority 2 is turned on for pumping diversion or sluice diversion to Playground Lake. After opening the Yangtze river diversion channel sluice, priority 3 is launched for sluice diversion to the Playground Lake. When the temperature is less than 15 °C, from 15 °C to 25 °C and higher than 25 °C, the water quality can be maintained for 15 days, 10 days and 7 days, respectively. Corresponding to the conditions of different priority levels, reasonable choices of scheduling measures under different conditions to improve the water quality and control eutrophication of the Playground Lake. This article is relevant for the environmental management of the artificial Playground Lake, and similar lakes elsewhere.

Keywords: Playground Lake; bilateral rivers; eutrophication remediation; numerical simulation; unilateral river.


Conflict of interest statement

The authors declare no conflict of interest.

Figures

Figure 1
Figure 1
Study area.
Figure 2
Figure 2
Chemical plant, domestic waste landfill site and shipyard area.
Figure 3
Figure 3
(a) Original planning “bilateral” river grid, (b) proposed “bilateral” river grid.
Figure 4
Figure 4
(a) The original planning of “bilateral” river elevation, (b) recommended “bilateral” river elevation.
Figure 5
Figure 5
Route of water diversion through the sluice.
Figure 6
Figure 6
Route of water diversion through pump.
Figure 7
Figure 7
Push pump position.
Figure 8
Figure 8
(a) Flow field without water diversion; (b) Flow field after pump diversion 30 h; (c) Flow field after sluice diversion.
Figure 9
Figure 9
The river layout program. (a) Original Planning river; (b) “Roughed” river; (c) “Bilateral” rivers; (d) “Unilateral” river.
Figure 10
Figure 10
(a) The remaining landfill scope and bottom elevation after project implementation; (b) Designed ground elevation after infrastructure foundation and river excavation; (c) Superimposed recommended “bilateral” rivers remaining landfill range.
Figure 11
Figure 11
(a) River seepage control area. (b) River slope protection type.
Figure 12
Figure 12
Comparison of flow field in “unilateral” and “bilateral” rivers without water diversion. (a) “unilateral” river; (b) “bilateral” rivers.
Figure 13
Figure 13
Comparison of the flow field in “unilateral” and “bilateral” rivers after 30 h of pumping. (a) “unilateral” river; (b) “bilateral” rivers.
Figure 14
Figure 14
Comparison of flow field in “unilateral” and “bilateral” rivers under sluice diversion conditions. (a) “unilateral” river; (b) “bilateral” rivers.
Figure 15
Figure 15
(a) Spatial distribution of “unilateral” river TP, TN, Chl-a and eutrophication comprehensive scores without water diversion in summer; (b) Spatial distribution of “bilateral” rivers TP, TN, Chl-a and eutrophication comprehensive scores without water diversion in summer.
Figure 15
Figure 15
(a) Spatial distribution of “unilateral” river TP, TN, Chl-a and eutrophication comprehensive scores without water diversion in summer; (b) Spatial distribution of “bilateral” rivers TP, TN, Chl-a and eutrophication comprehensive scores without water diversion in summer.
Figure 16
Figure 16
(a) Spatial distribution of “unilateral” river TP, TN, Chl-a and eutrophication scores after pumping 22 h in summer; (b) Spatial distribution of “unilateral” river TP, TN, Chl-a and eutrophication score after pumping for 30 h in summer, whereby the “unilateral” river model reached a completely steady state; (c) Spatial distribution of “bilateral” river TP, TN, Chl-a and eutrophication score after pumping for 22 h in summer; (d) Spatial distribution of “bilateral” river TP, TN, Chl-a and eutrophication score after pumping for 30 h in summer.
Figure 16
Figure 16
(a) Spatial distribution of “unilateral” river TP, TN, Chl-a and eutrophication scores after pumping 22 h in summer; (b) Spatial distribution of “unilateral” river TP, TN, Chl-a and eutrophication score after pumping for 30 h in summer, whereby the “unilateral” river model reached a completely steady state; (c) Spatial distribution of “bilateral” river TP, TN, Chl-a and eutrophication score after pumping for 22 h in summer; (d) Spatial distribution of “bilateral” river TP, TN, Chl-a and eutrophication score after pumping for 30 h in summer.
Figure 17
Figure 17
(a) Spatial distribution of “unilateral” river TP, TN, Chl-a and eutrophication scores by sluice diversion in summer; (b) Spatial distribution of “bilateral” river TP, TN, Chl-a and eutrophication scores by sluice diversion in summer.
Figure 18
Figure 18
(a) Spatial distribution of “unilateral” river TP, TN, Chl-a and eutrophication scores without water diversion in winter; (b) Spatial distribution of “bilateral” river TP, TN, Chl-a and eutrophication comprehensive scores in winter without water diversion.
Figure 19
Figure 19
(a) Spatial distribution of “unilateral” river TP, TN, Chl-a and eutrophication scores after pumping 22 h in winter, when river model reached a completely steady state; (b) Spatial distribution of “unilateral” river TP, TN, Chl-a and eutrophication scores after pumping for 30 h in winter; (c) Spatial distribution of “bilateral” rivers TP, TN, Chl-a and eutrophication score after pumping. 22 h in winter; (d) Spatial distribution of “bilateral” rivers TP, TN, Chl-a and eutrophication score after pumping for 30 h in winter.
Figure 19
Figure 19
(a) Spatial distribution of “unilateral” river TP, TN, Chl-a and eutrophication scores after pumping 22 h in winter, when river model reached a completely steady state; (b) Spatial distribution of “unilateral” river TP, TN, Chl-a and eutrophication scores after pumping for 30 h in winter; (c) Spatial distribution of “bilateral” rivers TP, TN, Chl-a and eutrophication score after pumping. 22 h in winter; (d) Spatial distribution of “bilateral” rivers TP, TN, Chl-a and eutrophication score after pumping for 30 h in winter.
Figure 20
Figure 20
Predicted value of TN, TP, Chl-a concentration throughout whole year. (a) TN concentration; (b) TP concentration; (c) Chl-a concentration.

References

    1. Zhao X., Shen Z.Y., Xiong M., Qi J. Key uncertainty sources analysis of water quality model using the first order error method. Int. J. Environ. Sci. Technol. 2011;8:137–148. doi: 10.1007/BF03326203. - DOI
    1. Piermay J.L. Long-term simulation of the eutrophication of the North Sea: Temporal development of nutrients, chlorophyll and primary production in comparison to observations. J. Sea Res. 1997;38:275–310. doi: 10.1016/S1385-1101(97)00051-8. - DOI
    1. Nobre A.M., Ferreira J.G., Newton A., Simas T., Icely J.D., Neves R. Management of coastal eutrophication: Integration of field data, ecosystem-scale simulations and screening models. J. Mar. Syst. 2005;56:375–390. doi: 10.1016/j.jmarsys.2005.03.003. - DOI
    1. Sagehashi M., Sakoda A., Suzuki M. A mathematical model of a shallow and Eutrophic Lake (The Keszthely Basin, Lake Balaton) and simulation of restorative manipulations. Water Res. 2001;35:1675. doi: 10.1016/S0043-1354(00)00435-8. - DOI - PubMed
    1. Madden C.J., Kemp W.M. Ecosystem model of an estuarine submersed plant community: Calibration and simulation of eutrophication responses. Estuaries. 1996;19:457–474. doi: 10.2307/1352463. - DOI

Publication types

LinkOut - more resources