

Spatio-temporal analysis of Plasmodium falciparum prevalence to understand the past and chart the future of malaria control in Kenya
- PMID: 30257697
- PMCID: PMC6158896
- DOI: 10.1186/s12936-018-2489-9
Spatio-temporal analysis of Plasmodium falciparum prevalence to understand the past and chart the future of malaria control in Kenya
Abstract
Background: Spatial and temporal malaria risk maps are essential tools to monitor the impact of control, evaluate priority areas to reorient intervention approaches and investments in malaria endemic countries. Here, the analysis of 36 years data on Plasmodium falciparum prevalence is used to understand the past and chart a future for malaria control in Kenya by confidently highlighting areas within important policy relevant thresholds to allow either the revision of malaria strategies to those that support pre-elimination or those that require additional control efforts.
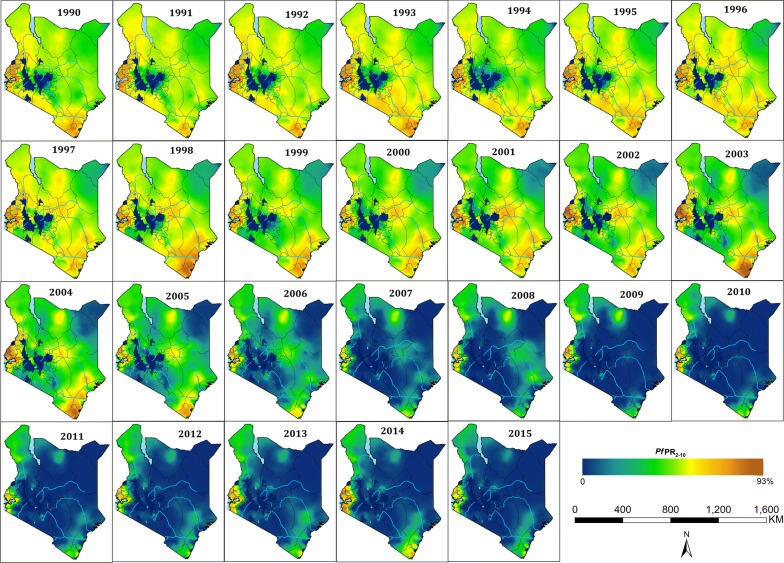
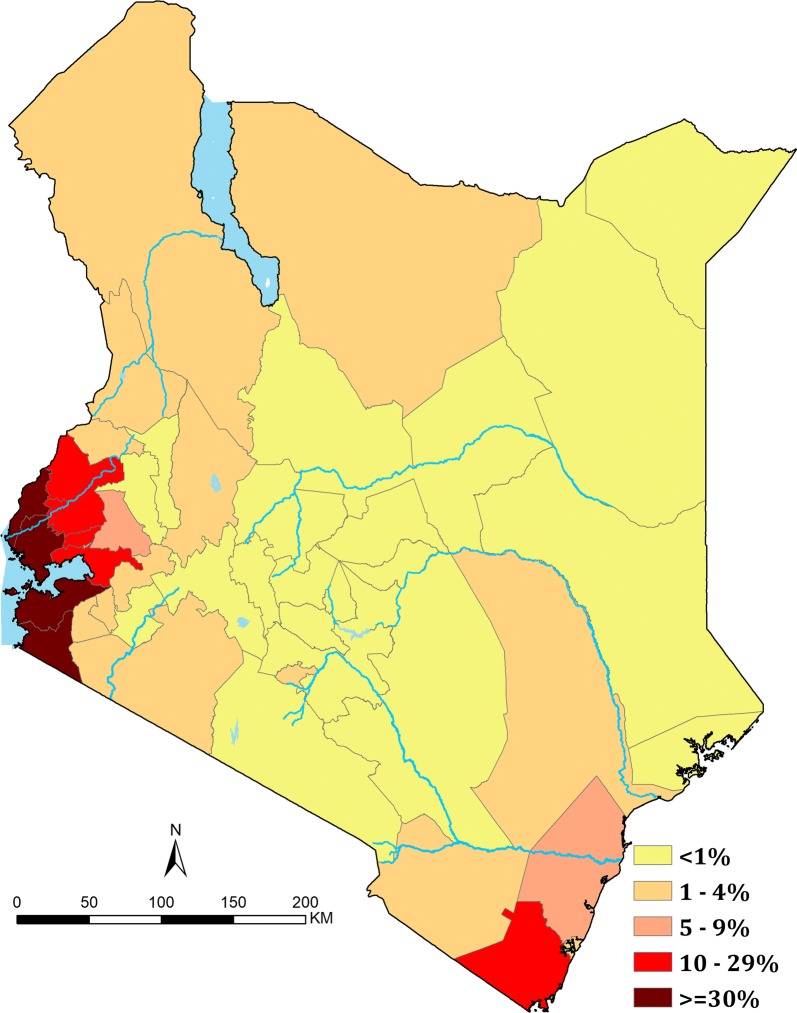
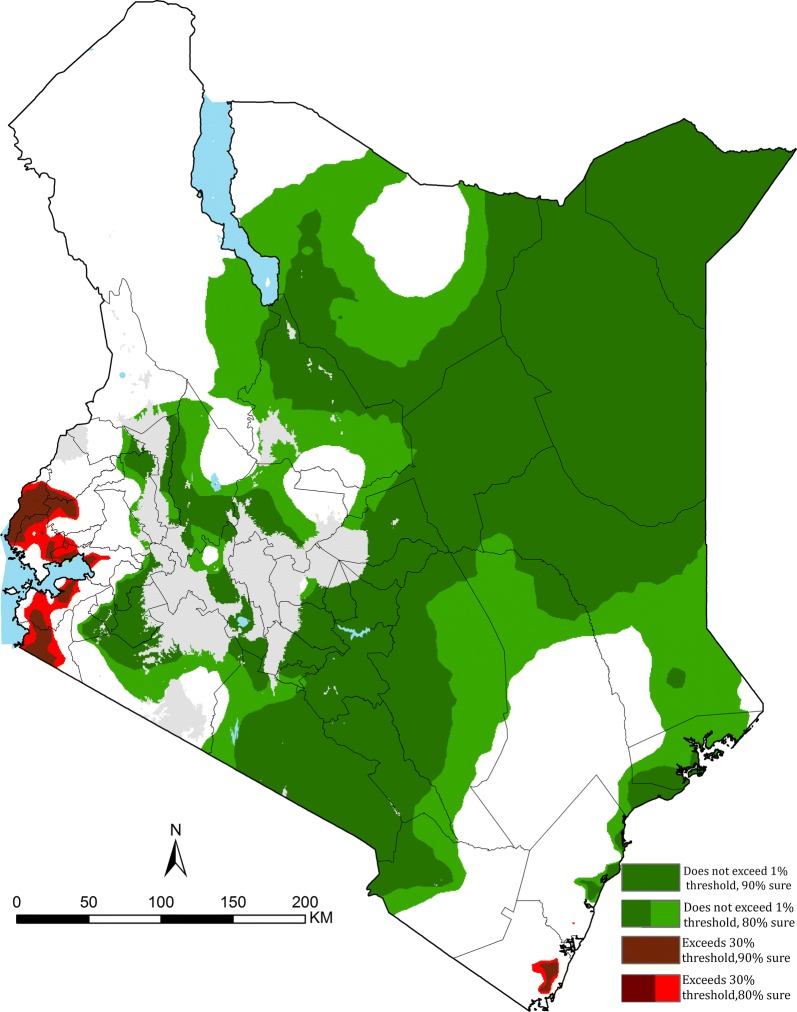
Methods: Plasmodium falciparum parasite prevalence (PfPR) surveys undertaken in Kenya between 1980 and 2015 were assembled. A spatio-temporal geostatistical model was fitted to predict annual malaria risk for children aged 2-10 years (PfPR2-10) at 1 × 1 km spatial resolution from 1990 to 2015. Changing PfPR2-10 was compared against plausible explanatory variables. The fitted model was used to categorize areas with varying degrees of prediction probability for two important policy thresholds PfPR2-10 < 1% (non-exceedance probability) or ≥ 30% (exceedance probability).
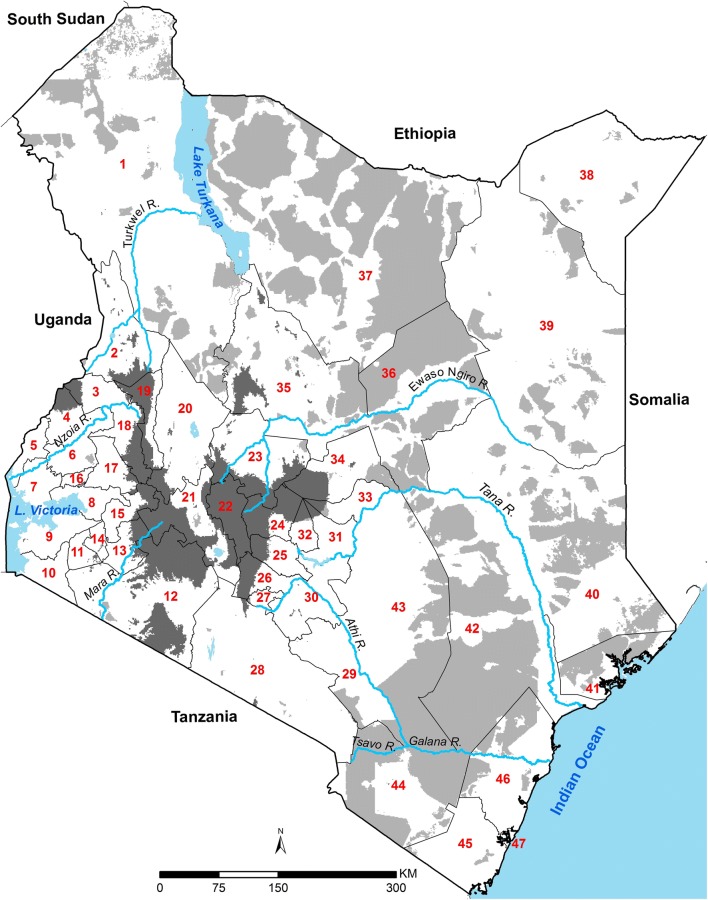
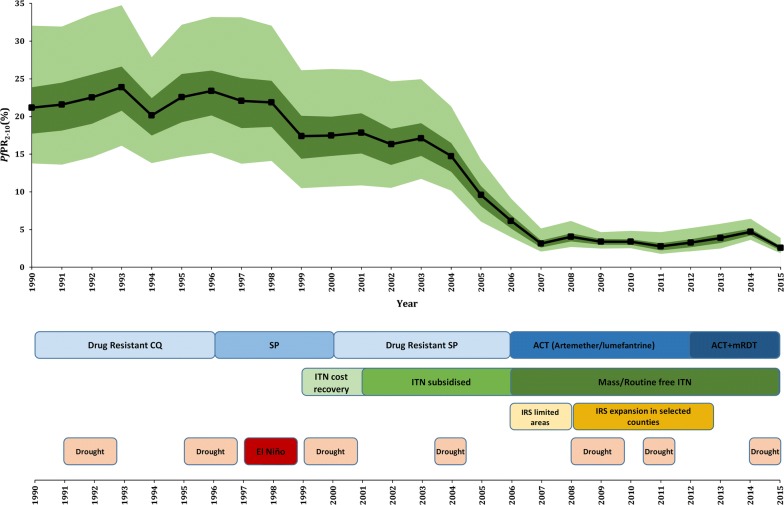
Results: 5020 surveys at 3701 communities were assembled. Nationally, there was an 88% reduction in the mean modelled PfPR2-10 from 21.2% (ICR: 13.8-32.1%) in 1990 to 2.6% (ICR: 1.8-3.9%) in 2015. The most significant decline began in 2003. Declining prevalence was not equal across the country and did not directly coincide with scaled vector control coverage or changing therapeutics. Over the period 2013-2015, of Kenya's 47 counties, 23 had an average PfPR2-10 of < 1%; four counties remained ≥ 30%. Using a metric of 80% probability, 8.5% of Kenya's 2015 population live in areas with PfPR2-10 ≥ 30%; while 61% live in areas where PfPR2-10 is < 1%.
Conclusions: Kenya has made substantial progress in reducing the prevalence of malaria over the last 26 years. Areas today confidently and consistently with < 1% prevalence require a revised approach to control and a possible consideration of strategies that support pre-elimination. Conversely, there remains several intractable areas where current levels and approaches to control might be inadequate. The modelling approaches presented here allow the Ministry of Health opportunities to consider data-driven model certainty in defining their future spatial targeting of resources.
Keywords: Kenya; Malaria; Model-based geostatistics; Plasmodium falciparum.
Figures
Comment in
-
Spatiotemporal analysis of malaria for new sustainable control strategies.BMC Med. 2018 Dec 4;16(1):226. doi: 10.1186/s12916-018-1224-2. BMC Med. 2018. PMID: 30509258 Free PMC article.
References
-
- WHO. Global technical strategy for malaria 2016–2030. Geneva: World Health Organization; 2015. http://www.who.int/malaria/publications/atoz/9789241564991/en/. Accessed 19 Aug 2017.
-
- Butler RJ. Atlas of Kenya a comprehensive series of new and authenticated maps prepared from the national survey and other governmental sources with gazetteer and notes on pronunciations and spelling. 1. Nairobi: the Survey of Kenya; 1959.
-
- Roberts JMD. Malaria. In: Vogel LC, Muller AS, Odingo RS, Onyango Z, De Geus A, editors. Health and disease in Kenya. Nairobi: East African Literature Bureau; 1974. pp. 305–317.
MeSH terms
Grants and funding
- 107769/WT_/Wellcome Trust/United Kingdom
- 201866/WT_/Wellcome Trust/United Kingdom
- 079080/WT_/Wellcome Trust/United Kingdom
- 103602/WT_/Wellcome Trust/United Kingdom
- 095127/WT_/Wellcome Trust/United Kingdom
- 034694/Wellcome Trust (GB)
- 203155/Department for International Development (UK)
- 077092/WT_/Wellcome Trust/United Kingdom
- MR/M015297/1/MRC_/Medical Research Council/United Kingdom
- 001/WHO_/World Health Organization/International
- 201866/Z/16/Z/WT_/Wellcome Trust/United Kingdom
- 203077/WT_/Wellcome Trust/United Kingdom
- 048335/International Development Research Centre, Canada (1996-1998) and the Wellcome Trust, UK (1996-1997)
LinkOut - more resources
Full Text Sources
Other Literature Sources
Miscellaneous
