. 2018 Sep 26;8(9):180119.
doi: 10.1098/rsob.180119.

Evolution of the calcium feedback steps of vertebrate phototransduction

Affiliations

Evolution of the calcium feedback steps of vertebrate phototransduction

Trevor D Lamb et al. Open Biol. .

Abstract

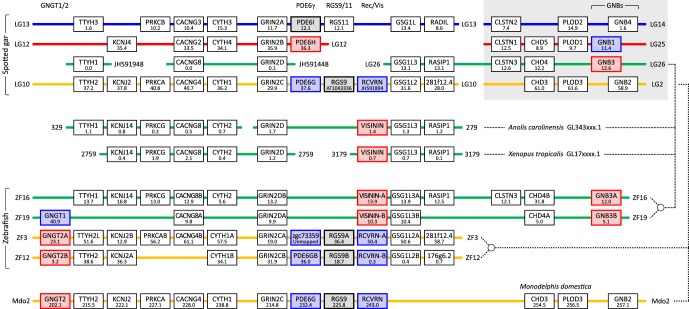
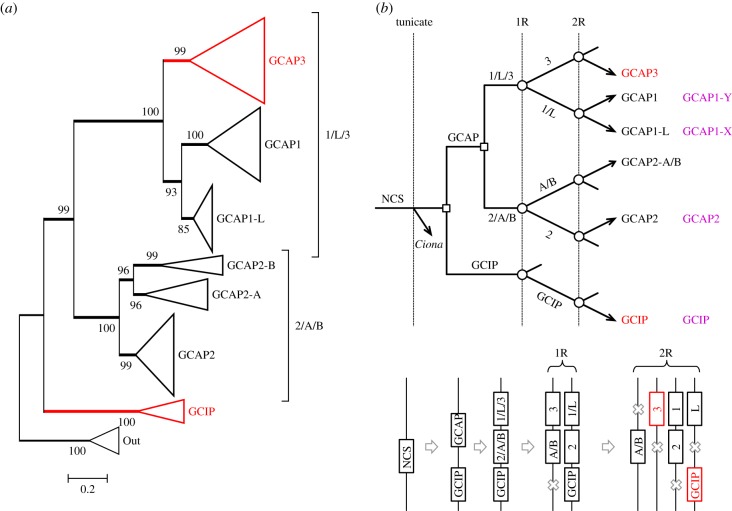
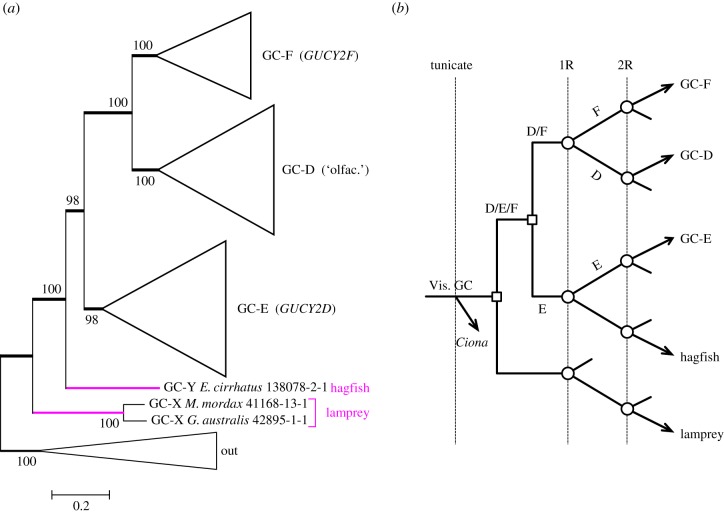
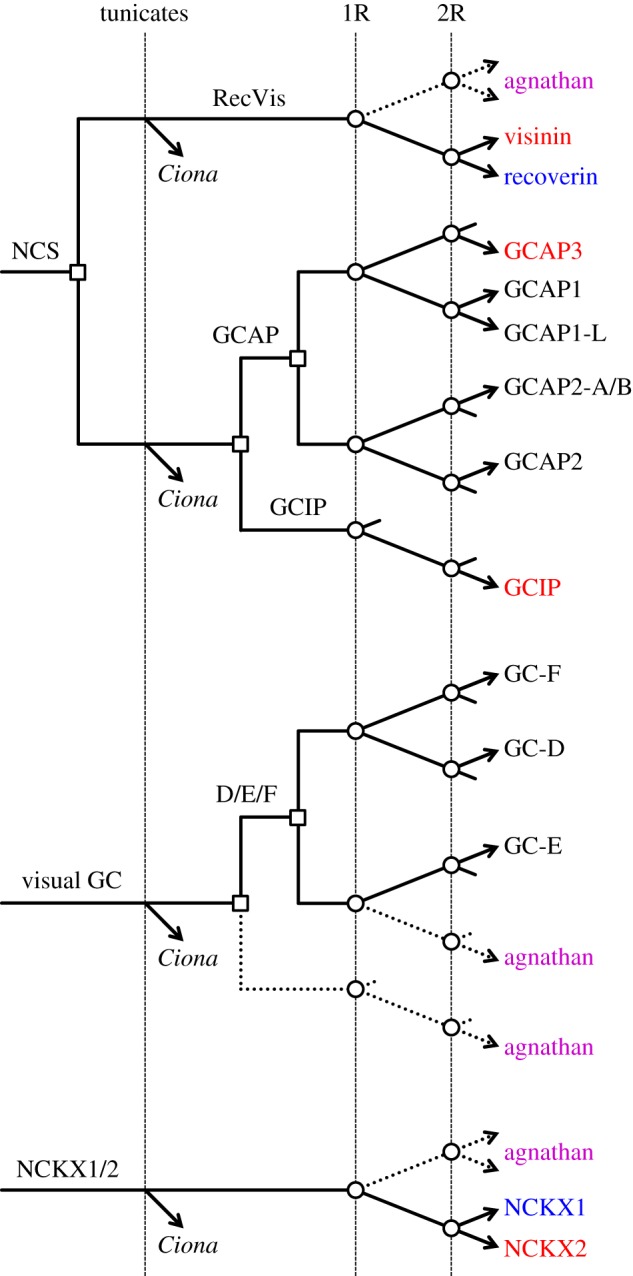
We examined the genes encoding the proteins that mediate the Ca-feedback regulatory system in vertebrate rod and cone phototransduction. These proteins comprise four families: recoverin/visinin, the guanylyl cyclase activating proteins (GCAPs), the guanylyl cyclases (GCs) and the sodium/calcium-potassium exchangers (NCKXs). We identified a paralogon containing at least 36 phototransduction genes from at least fourteen families, including all four of the families involved in the Ca-feedback loop (recoverin/visinin, GCAPs, GCs and NCKXs). By combining analyses of gene synteny with analyses of the molecular phylogeny for each of these four families of genes for Ca-feedback regulation, we have established the likely pattern of gene duplications and losses underlying the expansion of isoforms, both before and during the two rounds of whole-genome duplication (2R WGD) that occurred in early vertebrate evolution. Furthermore, by combining our results with earlier evidence on the timing of duplication of the visual G-protein receptor kinase genes, we propose that specialization of proto-vertebrate photoreceptor cells for operation at high and low light intensities preceded the emergence of rhodopsin, which occurred during 2R WGD.

Keywords: evolution; guanylyl cyclase; guanylyl cyclase activating protein; phototransduction; recoverin; sodium/calcium–potassium exchanger.


Conflict of interest statement

We declare we have no competing interests.

Figures

Figure 1.
Figure 1.
Syntenic arrangement of 62 families of genes located in the neighbourhood of phototransduction genes. The 28 genes involved in phototransduction (including nine that participate in Ca-feedback regulation) are shown either coloured or shaded. Red indicates preferential expression in cones; blue, preferential expression in rods; grey, expression in rods and cones; for the visual opsins, the colours instead provide an indication of spectral sensitivity. The rows represent spotted gar linkage groups (chromosomes) and the adjacent numbers identify the individual linkage groups; thus, ‘14’ indicates LG14. The diagram has arbitrarily been divided into six panels (a–f), and where a linkage group continues across a break between panels this is indicated by an arrow at the end of one panel and at the start of the next. The number below each gene identifier gives the gene location on the spotted gar linkage group in Mb. The order of gene families is arbitrary, although as far as possible we have arranged them in locally increasing or decreasing order of gene position in Mb on LG3/LG17 (green row). The diagram attempts to provide a coherent picture of the likely continuity of the four paralogous chromosomal regions in the ancestral post-2R genome. However, there is inevitable uncertainty at each break in linkage group coverage. To address this, our illustrated arrangement additionally takes into account the chromosomal locations of genes in human and chicken, as tabulated in electronic supplementary material, table S1. For those regions where we feel reasonably confident of the continuity of each postulated ancestral chromosome we have used thicker coloured lines; for regions where we are less confident the lines are thinner and grey. Genes with a diagonal strike-through are missing from the spotted gar genome, and their presumed locations have been derived from human and/or chicken. In panel (e), the dotted arrow links the postulated ancestral location of GCAP3 (GUCA1C) to its current location in spotted gar (see Text). The branching patterns sketched at the bottom right represents the order of 1R and 2R duplications deduced recently for the GRKs and arrestins [10], and for the GNAIs/GNATs [9].
Figure 2.
Figure 2.
Syntenic arrangement of genes neighbouring recoverin and visinin. Top four rows are spotted gar linkage groups that appear to form a 2R paralogon. The genes at the top right (grey background) also appear in figure 1, and this provides the basis for colouring the top row blue and the fourth row orange; the second and third rows have been coloured red and green, respectively, for reasons explained in the text, but this identification is not secure. As the genome assembly for spotted gar does not contain visinin, we also included genes from the unplaced scaffolds GL343279.1 and GL343329.1 of green anole, and GL173179.1 and GL172759.1 of Xenopus; these are shown as the next two rows. For spotted gar, five of the illustrated genes are on unplaced scaffolds; RCVRN and RGS9 have been placed on LG10/LG2 by comparison with mammalian genomes (e.g. opossum, in bottom row), TTYH1, CACNG8 and GRIN3D have been placed on the same row as LG26 by comparison with anole. Next four rows are for zebrafish, and show genes on chromosomes ZF3/ZF12 and ZF16/ZF19, that include the 3R copies of recoverin and visinin. Bottom row is for opossum chromosome 2, and is presented as evidence supporting continuity of the orange row LG10/LG2 for spotted gar. Bold outlines denote phototransduction genes, with colour coding as in figure 1. Dashed and dotted lines link the rows for visinin and recoverin, respectively; open circles denote 3R duplications in zebrafish. Note that the genes we designate as VISININ-A and VISININ-B are named RCVRN2 and RCVRN3 in Ensembl and NCBI; we have also made some minor changes to a few other gene names to aid comparison across the three species and for the avoidance of confusion. Gene locations are from Ensembl Release 93. The locations of PDE6H and PDE6I in spotted gar have been obtained from [7].
Figure 3.
Figure 3.
Molecular phylogeny and proposed gene duplications and losses for recoverin and visinin. (a) Constrained molecular phylogeny for recoverin and visinin sequences from jawed and agnathan vertebrates, in collapsed form. The fully expanded tree is shown in electronic supplementary material, figure S2; identical topology was obtained using the WAG and LG substitution models. The two dotted arrows show the positions obtained for the root of the unconstrained tree, with the WAG model (lower arrow) and the LG model (upper arrow). The constraint tree that was applied is shown below the main panel; by constraining just two jawed vertebrate sequences and two agnathan sequences, the support level became unanimous for each of the five sub-trees. (b) Proposed scenario for gene duplications and losses. The only losses are presumed to have occurred following agnathan-jawed (a–j) speciation. Although the pattern with visinin shown with a dashed arrow has the highest level of support, we could not rule out the possibility that visinin is instead sister to one or other of the two agnathan sequences, as shown by the dotted arrows (see text).
Figure 4.
Figure 4.
Molecular phylogeny and proposed gene duplications and losses for jawed vertebrate GCAPs. (a) Unconstrained molecular phylogeny for GCAP sequences from jawed vertebrates, in collapsed form; the fully expanded tree is shown in electronic supplementary material, figure S4. Support for the two main sub-trees, 1/3/L and 2/A/B, is unanimous, and support for each individual clade except one is at least 96%; GCAP1-L is supported at 85%. GCAP3 and GCIP are coloured red, as they are thought to be expressed only in cones. (b) Proposed scenario for gene duplications and losses. We invoke two duplications prior to WGD: a neuronal calcium sensor (NCS) duplicated to form GCIP and the ancestral GCAP, and then that GCAP duplicated to form what would become the 1/3/L and 2/A/B families. Subsequent duplications and losses occurred at 1R and 2R as indicated. The bottom panel shows the corresponding scenario for the positions of genes on blocks at the indicated times.
Figure 5.
Figure 5.
Molecular phylogeny and proposed gene duplications and losses for vertebrate visual guanylyl cyclases. (a) Unconstrained molecular phylogeny for GC sequences from jawed and agnathan vertebrates, in collapsed form. For an unconstrained tree, the level of support at every node is remarkably high. The fully expanded tree is shown in electronic supplementary material, figure S7, and in addition a tree with the single hagfish sequence constrained to clade with the GC-Es is given in electronic supplementary material, figure S8. GC-E (=Ret-GC1) is encoded by GUCY2D in human; GC-F (=Ret-GC2) is encoded by GUCY2F; GC-D is often referred to as ‘olfactory’, yet it is expressed in the retina in a number of aquatic taxa. (b) Proposed scenario for gene duplications and losses. We invoke two duplications prior to WGD. Following the duplication of an ancestral visual GC, one of the genes has been retained only in lampreys. The other duplicated to form GC-E plus the forerunner of GC-D and GC-F. The subsequent duplications during 2R WGD were followed by multiple losses.
Figure 6.
Figure 6.
Molecular phylogeny and proposed gene duplications and losses for vertebrate visual NCKX genes. (a) Unconstrained molecular phylogeny for visual NCKX sequences from jawed vertebrates and lampreys, in collapsed form; the fully expanded tree is presented in electronic supplementary material, figure S11. Alignment SATé with ClustalW (see Methods). Lampreys possess three visual NCKX genes, one of which is the orthologue of jawed vertebrate NCKX2. (b) Proposed scenario for gene duplications and losses. The ancestral NCKX1/2 gene duplicated at 1R, and then at 2R one of these duplicated to form NCKX1 and NCKX2, whereas the other duplicated to form NCKX-X and NCKX-Y which have been lost in jawed vertebrates.
Figure 7.
Figure 7.
Summary of proposed ancestral arrangement of vertebrate phototransduction gene families. The genes are taken from figures 1 and 2 after omission of families not involved in phototransduction. We deduced the 1R/2R branching pattern from the combined phylogenies for the families, placing particular weight on the GRKs, arrestins and GNAIs/GNATs. For the first three families in (a), we cannot assign the positions of the two middle rows, and they may correspond to either the red or the green row. The genes shown in white boxes indicate paralogues that are not used in retinal photoreceptors, though GNAT3 is used in parietal photoreceptors.
Figure 8.
Figure 8.
Summary of proposed patterns of duplications and losses in the families of genes encoding the proteins mediating Ca-feedback regulation of phototransduction in jawed vertebrates. NCS, neuronal calcium sensor.

Similar articles

Cited by

References

    1. Ohno S. 1970. Evolution by gene duplication. London, UK: Allen and Unwin.
    1. Nordström K, Larsson TA, Larhammar D. 2004. Extensive duplications of phototransduction genes in early vertebrate evolution correlate with block (chromosome) duplications. Genomics 83, 852–872. (10.1016/j.ygeno.2003.11.008) - DOI - PubMed
    1. Larhammar D, Nordström K, Larsson TA. 2009. Evolution of vertebrate rod and cone phototransduction genes. Phil. Trans. R. Soc. B 364, 2867–2880. (10.1098/rstb.2009.0077) - DOI - PMC - PubMed
    1. Lagman D, Sundström G, Ocampo Daza D, Abalo XM, Larhammar D. 2012. Expansion of transducin subunit gene families in early vertebrate tetraploidizations. Genomics 100, 203–211. (10.1016/j.ygeno.2012.07.005) - DOI - PubMed
    1. Lagman D, Ocampo Daza D, Widmark J, Abalo XM, Sundström G, Larhammar D. 2013. The vertebrate ancestral repertoire of visual opsins, transducin alpha subunits and oxytocin/vasopressin receptors was established by duplication of their shared genomic region in the two rounds of early vertebrate genome duplications. BMC Evol. Biol. 13, 238 (10.1186/1471-2148-13-238) - DOI - PMC - PubMed

Publication types

LinkOut - more resources