. 2018 Oct 9;115(41):10387-10391.
doi: 10.1073/pnas.1804755115. Epub 2018 Sep 26.

Role of transcription complexes in the formation of the basal methylation pattern in early development

Affiliations

Role of transcription complexes in the formation of the basal methylation pattern in early development

Razi Greenfield et al. Proc Natl Acad Sci U S A. .

Abstract

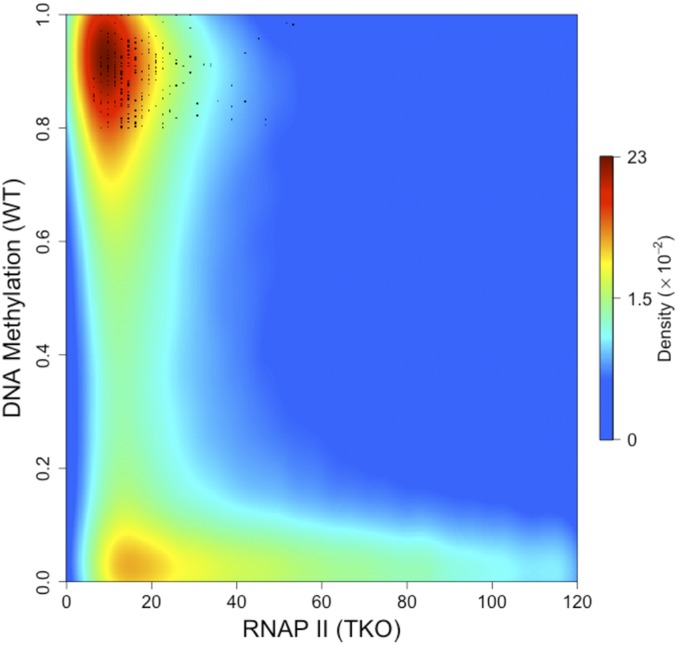
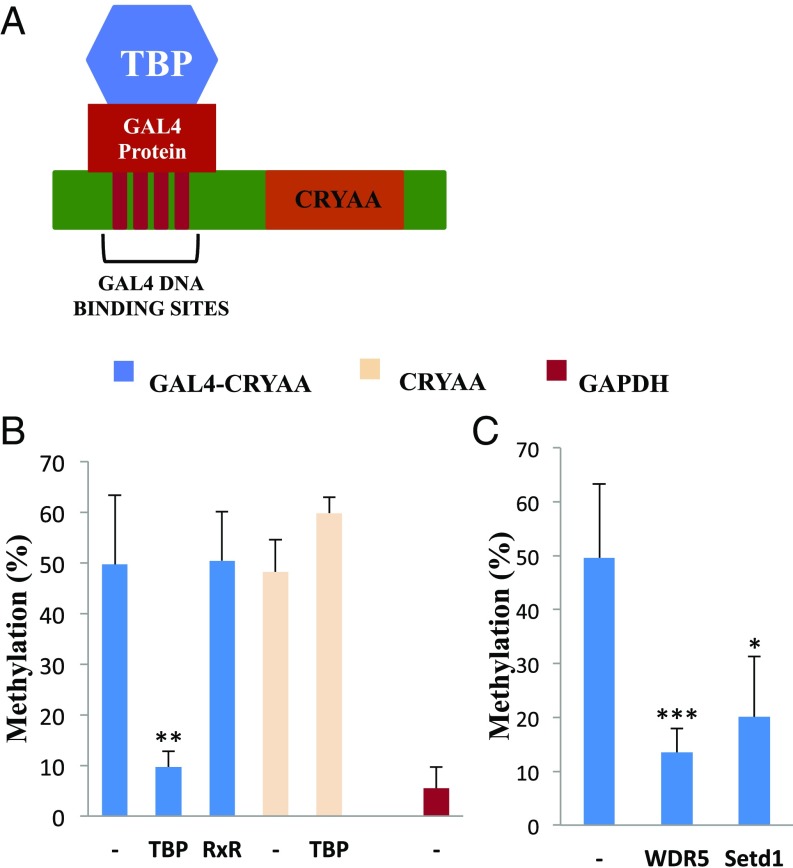
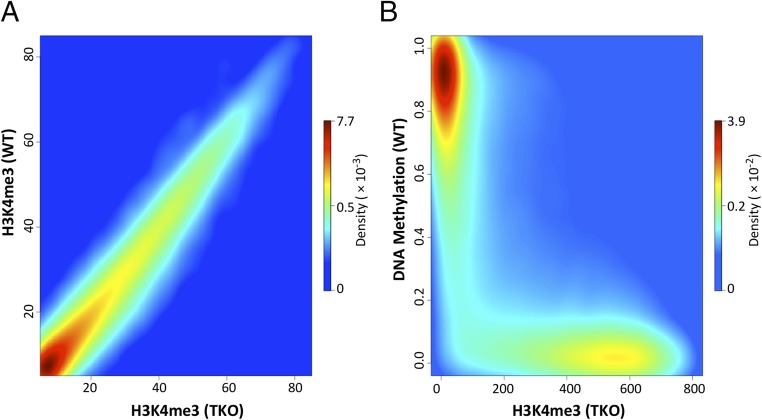
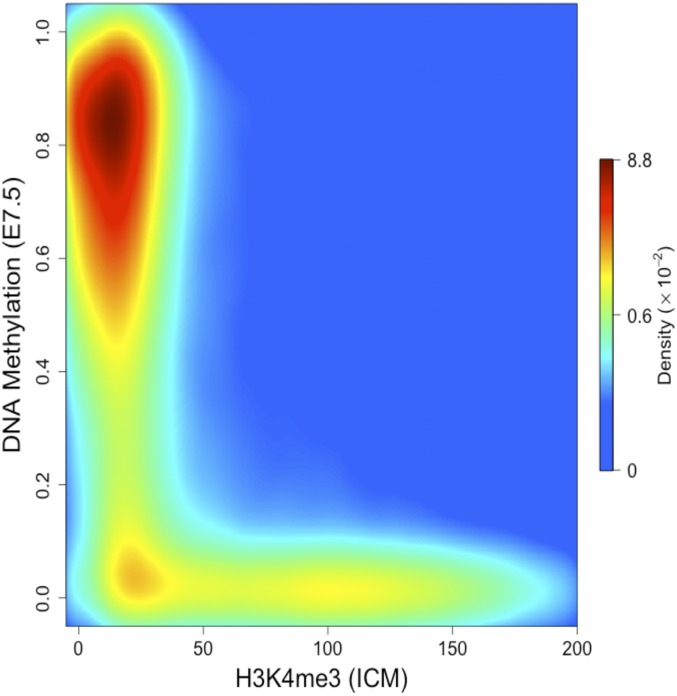
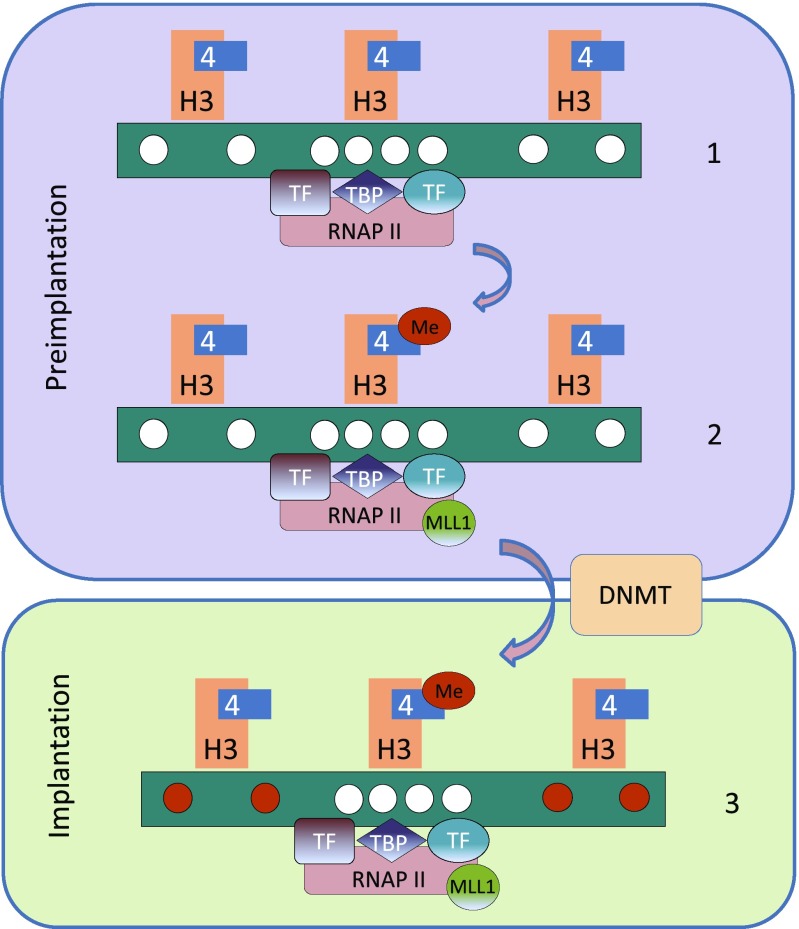
Following erasure in the blastocyst, the entire genome undergoes de novo methylation at the time of implantation, with CpG islands being protected from this process. This bimodal pattern is then preserved throughout development and the lifetime of the organism. Using mouse embryonic stem cells as a model system, we demonstrate that the binding of an RNA polymerase complex on DNA before de novo methylation is predictive of it being protected from this modification, and tethering experiments demonstrate that the presence of this complex is, in fact, sufficient to prevent methylation at these sites. This protection is most likely mediated by the recruitment of enzyme complexes that methylate histone H3K4 over a local region and, in this way, prevent access to the de novo methylation complex. The topological pattern of H3K4me3 that is formed while the DNA is as yet unmethylated provides a strikingly accurate template for modeling the genome-wide basal methylation pattern of the organism. These results have far-reaching consequences for understanding the relationship between RNA transcription and DNA methylation.

Keywords: development; epigenetics; histomodification; inheritance.


Conflict of interest statement

The authors declare no conflict of interest.

Figures

Fig. 1.
Fig. 1.
RNAP II binding predicts undermethylation. Density scatter plot of RNAP II binding (normalized ChIP-Seq reads) in TKO cells vs. percent DNA methylation (normalized RRBS) in WT ES cells. Note that regions bound to RNAP II are largely unmethylated in WT cells while unbound sites are highly methylated. Some unmethylated sites in the unbound fraction may reflect inefficiency of the RNAP II antibody ChIP. Sequences defined as CpG islands that are nonetheless methylated (>80%) in WT ES cells as well as four adult tissues (GSE60012) are marked as black dots. Data density is color-coded from blue (low) to red (high). Quantitative analysis indicates that the proportion of tiles that bind RNAP II (>40) but are methylated (>80%) in WT ES cells is 5%. The proportion of tiles not bound by RNAP II (<20), yet unmethylated (<20%) in WT ES cells was calculated to be 13%.
Fig. 2.
Fig. 2.
Tethering RNAP to a non-CpG island promoter. A vector carrying the human CRYAA promoter containing 4×GAL4 binding sites (A) was stably transfected (blue) into WT ES cells with or without (−) GAL4 binding domain fusion genes TBP and RXR (B) or WDR5 and Setd1 (C) and then analyzed for methylation by single molecule Bisulfite sequencing. Target controls include transfection of CRYAA without the GAL4 binding sites (yellow) and the GAPDH CpG-island promoter (red). Each bar represents results from three to six biological replicates. Statistical significance was determined by Student’s t test: *P < 0.05, **P < 0.005, ***P < 0.0005.
Fig. 3.
Fig. 3.
H3K4me3 predicts DNA undermethylation. (A) Density scatter plot of H3K4me3 (normalized ChIP-Seq reads) in TKO cells vs. H3K4me3 in WT ES cells. (B) Density scatter plot of H3K4me3 (normalized ChIP-Seq reads) in TKO cells vs. percent DNA methylation (normalized RRBS) in WT ES cells. Note that regions marked with H3K4me3 in TKO are unmethylated in WT ES cells. The density of dots is color-coded from blue (low) to red (high).
Fig. 4.
Fig. 4.
H3K4me3 predicts undermethylation in vivo. Density scatter plot of H3K4me3 (normalized ChIP-Seq reads) in ICM vs. percent DNA methylation (normalized RRBS) in 7.5-d embryos. Dot density is color-coded from blue (low) to red (high).
Fig. 5.
Fig. 5.
Mechanism of CpG island protection. Preimplantation, the genome is largely unmethylated (white circles) and RNAP II complexes are associated with sites of potential transcription by virtue of TBP as directed by transcription-factor recognition (1). RNAP II then recruits the MLL1 complex that brings about lysine 4 methylation of histone H3 within local nucleosomes (2). De novo methylation at the time of implantation (red circles) is carried out by the DNMT complex that can bind all regions of the DNA, as long as the local nucleosomes are not methylated at the H3 lysine 4 position (3).

Similar articles

Cited by

References

    1. Long HK, King HW, Patient RK, Odom DT, Klose RJ. Protection of CpG islands from DNA methylation is DNA-encoded and evolutionarily conserved. Nucleic Acids Res. 2016;44:6693–6706. - PMC - PubMed
    1. Straussman R, et al. Developmental programming of CpG island methylation profiles in the human genome. Nat Struct Mol Biol. 2009;16:564–571. - PubMed
    1. Ludwig G, et al. Aberrant DNA methylation in ES cells. PLoS One. 2014;9:e96090. - PMC - PubMed
    1. Habibi E, et al. Whole-genome bisulfite sequencing of two distinct interconvertible DNA methylomes of mouse embryonic stem cells. Cell Stem Cell. 2013;13:360–369. - PubMed
    1. Brandeis M, et al. Sp1 elements protect a CpG island from de novo methylation. Nature. 1994;371:435–438. - PubMed

Publication types