. 2018 Sep 26;10(460):eaat7163.
doi: 10.1126/scitranslmed.aat7163.

Disrupting the LINC complex in smooth muscle cells reduces aortic disease in a mouse model of Hutchinson-Gilford progeria syndrome

Affiliations

Disrupting the LINC complex in smooth muscle cells reduces aortic disease in a mouse model of Hutchinson-Gilford progeria syndrome

Paul H Kim et al. Sci Transl Med. .

Abstract

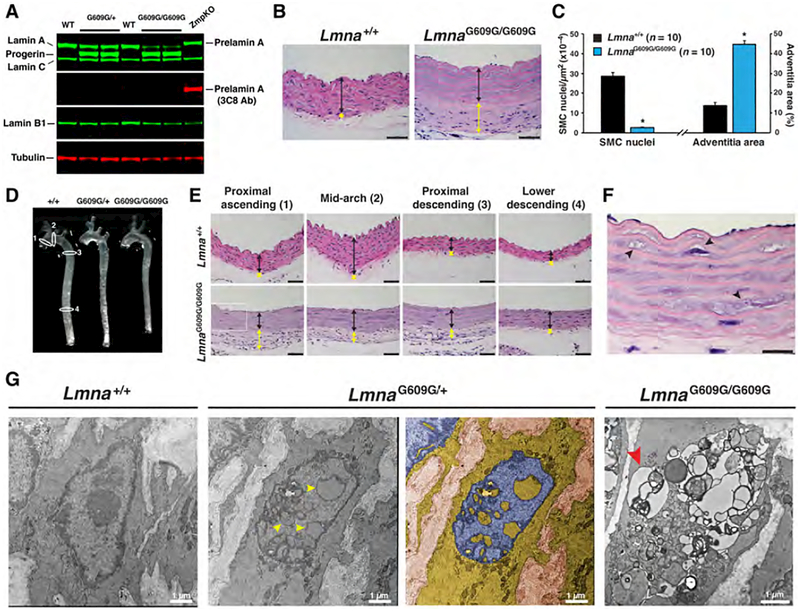
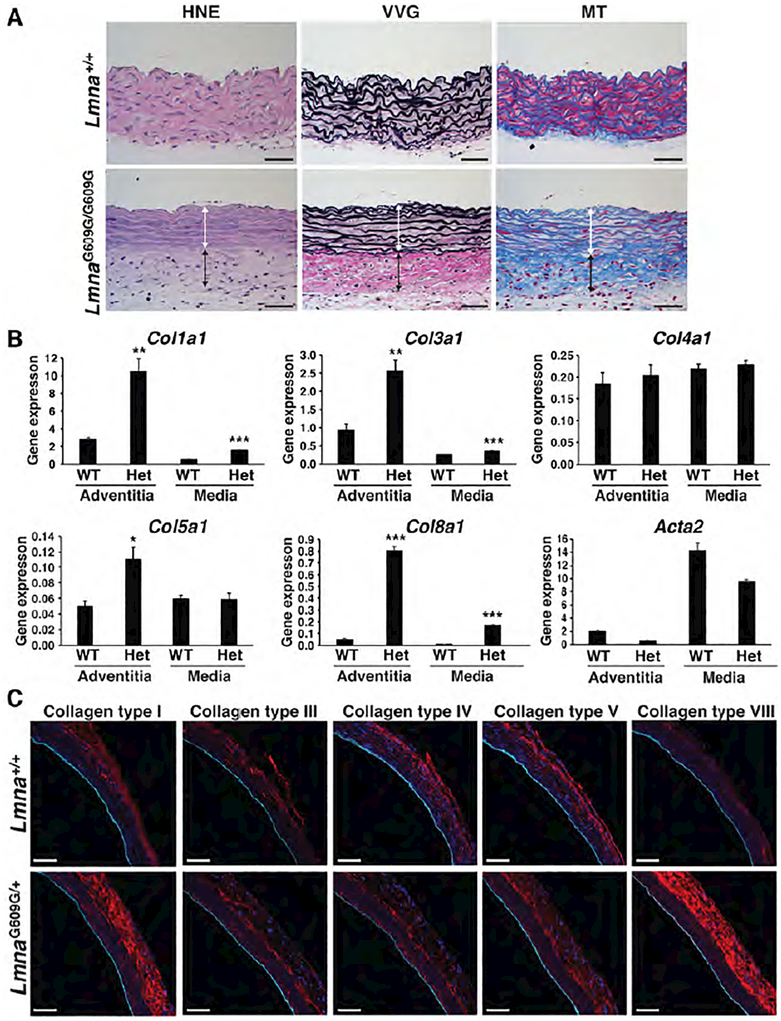
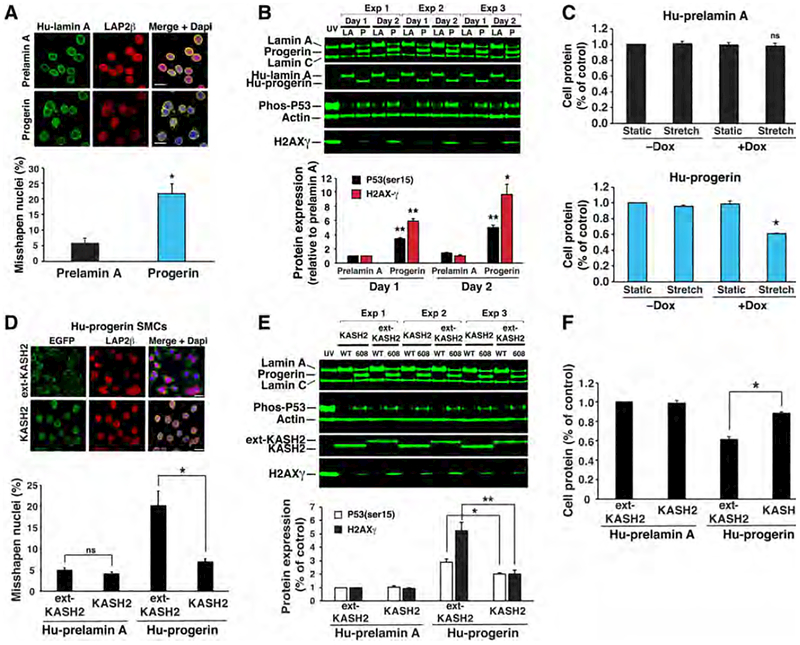
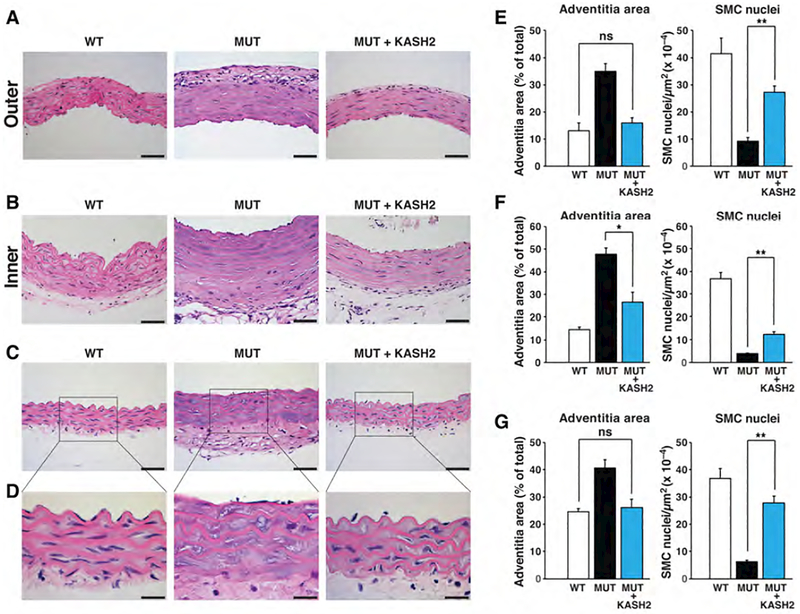
Hutchinson-Gilford progeria syndrome is a disorder of premature aging in children caused by de novo mutations in LMNA that lead to the synthesis of an internally truncated form of prelamin A (commonly called progerin). The production of progerin causes multiple disease phenotypes, including an unusual vascular phenotype characterized by the loss of smooth muscle cells in the arterial media and fibrosis of the adventitia. We show that progerin expression, combined with mechanical stress, promotes smooth muscle cell death. Disrupting the linker of the nucleoskeleton and cytoskeleton (LINC) complex in smooth muscle cells ameliorates the toxic effects of progerin on smooth muscle cells and limits the accompanying adventitial fibrosis.


Conflict of interest statement

Competing interests: The authors declare no competing interests.

Figures

Figure 1.
Figure 1.. Mice expressing progerin develop aortic pathology.
Mouse aortas analyzed by western blotting, histology, and electron microscopy. (a) Western blot showing the synthesis of progerin but not prelamin A in aortas from LmnaG609G/+ (G609G/+) and LmnaG609G/G609G (G609G/G609G) mice. Average progerin levels (relative to tubulin) were 1.15 and 1.43 for heterozygous and homozygous G609G mice, respectively. (b) Representative hematoxylin and eosin (HNE)–stained sections of the ascending aorta from a 4-month-old Lmna+/+ and LmnaG609G/G609G mouse. Colored lines identify the aortic media (black) and adventitia (yellow). Scale bar, 50 μm. (c) Bar graph showing fewer smooth muscle cell (SMC) nuclei (left) and greater adventitial area (right) in the ascending aorta (inner curvature) of 4-month-old LmnaG609G/G609G mice (blue), compared with age-matched wild-type mice (black). Mean ± SEM; n = 10/group. LmnaG609G/G609G vs. wild-type; *p < 0.001. (d) Thoracic aortas from wild-type (+/+), LmnaG609G/+ (G609G/+), and LmnaG609G/G609G (G609G/G609G) mice. Numbered white ovals identify locations for sections in panel e. (e) HNE-stained sections of four regions of the thoracic aorta from 4-month-old Lmna+/+ and LmnaG609G/G609G mice. Colored lines identify the adventitia (yellow) and media (black). Scale bar, 40 μm. (f) Enlarged image of the proximal ascending aorta (boxed area in panel e) showing vacuolated SMCs (black arrowheads). Scale bar, 20 μm. (g) Electron micrographs showing SMC nuclei in Lmna+/+, LmnaG609G/+, and LmnaG609G/G609G mice. Yellow arrowheads point to intranuclear vesicles in LmnaG609G/+ aortas. A duplicate image is colorized to show the nucleoplasm (blue) and cytoplasm (yellow). Red arrowhead points to a cytoplasmic vacuole in a LmnaG609G/G609G aortic SMC.
Figure 2.
Figure 2.. Collagen synthesis is increased in the adventitia of LmnaG609G mice.
Collagen synthesis in the aorta of Lmna+/+ and LmnaG609G mice was examined by histochemistry, gene-expression studies, and immunofluorescence microscopy. (a) Histochemical studies show that collagen content is increased in the adventitia of a 4-month-old LmnaG609G/G609G mouse. HNE: blue, nuclei; pink, cytoplasm. Verhoeff-Van Gieson (VVG) stain: black, elastic fibers and nuclei; red, collagen. Masson’s trichrome (MT) stain: pink/red, cytoplasm; blue, collagen. Colored lines identify the media (white) and adventitial (black) layers. Scale bar, 50 μm. (b) RT-PCR studies showing that Col1a1 and Col8a1 expression are increased in the adventitia of 12-month-old LmnaG609G/+ mice (mean ± SEM; n = 3). LmnaG609G/+ vs. wild-type; *p < 0.05, **p < 0.01, ***p < 0.001. (c) Serial frozen sections of the ascending aorta from 12-month-old wild-type and LmnaG609G/+ mice were stained with antibodies against collagen types I, III, IV, V, and VIII (red) and CD31 (cyan) and examined by confocal fluorescence microscopy. Scale bar, 50 μm.
Figure 3.
Figure 3.. Lamin A is expressed at high levels in the aorta of wild-type mice.
Nuclear lamin expression in different tissues of wild-type mice was measured by western blotting, RT-PCR, and fluorescence microscopy. (a) Representative western blot comparing lamin A, lamin C, and lamin B1 levels in different tissues. Tubulin was measured as a loading control. Cortex, cerebral cortex; BAT, brown adipose tissue; WAT, white adipose tissue; Gb, gallbladder; ASC, ascending aorta; DESC, descending aorta; ABD, abdominal aorta. Graphs showing lamin A expression relative to tubulin (b), relative to lamin C (c), and relative to lamin B1 (d). For panels b–d, the tissues are arranged in ascending order from left to right, with the expression in kidney set at a value of one (mean ± SEM; n = 4 mice). (e) RT-PCR studies comparing the expression of prelamin A (black) and Lmnb1 (blue) in tissues (mean ± SEM; n = 4 mice). (f) RT-PCR studies comparing the expression of prelamin A (black) and Lmnb1 (blue) in the media and adventitia (Adv) layers of wild-type mice (mean ± SEM; n = 4 mice). Media vs. adventitia; **p < 0.001. (g) Confocal fluorescence microscopy images showing the expression of CD31 (cyan) and lamin B1 (red) in the ascending aorta of a wild-type mouse. In the merged image, the adventitia is outlined by dotted white lines (see Fig. S4g). Scale bar, 50 μm.
Figure 4.
Figure 4.. Vascular pathology is more severe along the inner curvature of the ascending aorta and branches of the aortic arch.
The number of SMC nuclei and adventitial area were quantified at the inner and outer curvature of the ascending thoracic aorta of LmnaG609G mice. The white lines in panels a–c identify the location where the measurements were made. (a–c) Composite fluorescence microscopy images of the ascending aorta stained with antibodies against CD31 (green) and collagen type VIII (red) in 12-month-old Lmna+/+ and LmnaG609G/+ mice, and a 4-month-old LmnaG609G/G609G mouse. BC, brachiocephalic; LCC, left common carotid; and LSC, left subclavian. Scale bar, 500 μm. (d) Bar graph showing adventitial area (as a percentage of total area) in wild-type (black bars) and LmnaG609G/+ (white bars) mice at the outer and inner curvature of the ascending aorta. (e) Bar graph showing the number of SMC nuclei (relative to media area) in wild-type (black bars) and LmnaG609G/+ (white bars) mice at the outer and inner curvature of the ascending aorta. Mean ± SEM for wild-type (n = 12) and LmnaG609G/+ (n = 11) mice; *p < 0.02 and **p < 0.001. (f) RT-PCR studies measuring prelamin A, lamin C, and Lmnb1 expression at the inner and outer curvature in wild-type mice (mean ± SEM; n = 4). Inner vs. outer; ns (nonsignificant), p > 0.20.
Figure 5.
Figure 5.. Disrupting the LINC complex in SMCs ameliorates phenotypes elicited by progerin.
(a) Microscopy images showing progerin increases misshapen nuclei in SMCs. Scale bar, 20 μm. Bar graph shows quantification of misshapen nuclei (mean ± SEM; n = 3 experiments). *p < 0.02. (b) Western blots showing that progerin (P) induces P53 phosphorylation and H2AX-γ expression compared to lamin A (LA). Cells exposed to UV light were included as a control. The bar graph shows the expression of P53 phosphorylation (black) and H2AX-γ (red) after 1- or 2-days (mean ± SEM; n = 3 experiments). Progerin vs. prelamin A; *p < 0.01, **p < 0.001. (c) Uniaxial strain induces cell death in progerin-expressing SMCs. Prelamin A- and progerin-expressing cells were exposed to stretching (6 mm, 0.5 Hz) or static conditions for 1 day. Cell protein was measured and expressed relative to static cells (mean ± SEM; n = 3 experiments). Stretch vs. static; *p < 0.001. (d) Microscopy images showing that KASH2 reduces misshapen nuclei in progerin-expressing cells as compared to ext-KASH2. Scale bar, 20 μm. Bar graph shows quantification of misshapen nuclei (mean ± SEM; n = 3 experiments). KASH2 vs. ext-KASH2; *p < 0.02. (e) Western blot showing that KASH2 reduces H2AX-γ levels and p53 phosphorylation in unstrained, progerin-expressing cells. The bar graph shows the average expression of P53 phosphorylation (white) and H2AX-g (black) after 1 day (mean ± SEM; n = 3 experiments). KASH2 vs. ext-KASH2; *p < 0.05, **p < 0.01. (f) KASH2 reduces cell death in stretched, progerin-expressing cells. The bar graph shows cell protein levels relative to stretched, prelamin A/ext-KASH2–expressing cells (mean ± SEM; n = 3 experiments). KASH2 vs. ext-KASH2; *p < 0.001.
Figure 6.
Figure 6.. The expression of the KASH2 domain in smooth muscle cells ameliorates aortic disease in LmnaG609G/G609G mice.
The Cre-conditional KASH2–EGFP transgene was bred into LmnaG609G/G609G mice harboring the SMC-specific Sm22Cre transgene. Three groups were examined: WT, Lmna+/+KASH2–EGFP+Sm22-Cre+; MUT, LmnaG609G/G609GKASH2–EGFP+Sm22-Cre; and MUT + KASH2, LmnaG609G/G609GKASH2–EGFP+Sm22-Cre+. Adventitial fibrosis and SMC nuclei were quantified in the three groups. (a–d) Representative photographs of HNE-stained cross sections at the outer (a) and inner curvature (b) of the ascending aorta, and proximal descending aorta (c–d). Scale bars, 50 μm for panels a–c; 20 μm for panel d. (e) Adventitial area (as a percent of total area) and numbers of SMC nuclei (per media area) at the outer ascending thoracic aorta (mean ± SEM; n = 6/group). (f) Adventitial area and numbers of SMC nuclei at the inner ascending thoracic aorta (mean ± SEM; n = 6/group). (g) Adventitial area and numbers of SMC nuclei in the proximal descending thoracic aorta (mean ± SEM; n = 6/group). *p < 0.01; **p < 0.001; ns, nonsignificant defined as p > 0.40.

Similar articles

Cited by

References

    1. DeBusk FL, The Hutchinson-Gilford progeria syndrome. Report of 4 cases and review of the literature. J. Pediatrics 80, 697–724 (1972). - PubMed
    1. Sarkar PK, Shinton RA, Hutchinson-Guilford progeria syndrome. Postgrad. Med. J 77, 312–317 (2001). - PMC - PubMed
    1. Eriksson M, Brown WT, Gordon LB, Glynn MW, Singer J, Scott L, Erdos MR, Robbins CM, Moses TY, Berglund P, Dutra A, Pak E, Durkin S, Csoka AB, Boehnke M, Glover TW, Collins FS, Recurrent de novo point mutations in lamin A cause Hutchinson-Gilford progeria syndrome. Nature 423, 293–298 (2003). - PMC - PubMed
    1. Kieran MW, Gordon L, Kleinman M, New approaches to progeria. Pediatrics 120, 834–841 (2007). - PubMed
    1. Gordon LB, McCarten KM, Giobbie-Hurder A, Machan JT, Campbell SE, Berns SD, Kieran MW, Disease progression in Hutchinson-Gilford progeria syndrome: impact on growth and development. Pediatrics 120, 824–833 (2007). - PubMed

Publication types