. 2018 Sep 26;10(460):eaar8356.
doi: 10.1126/scitranslmed.aar8356.

PD-1 up-regulation on CD4+ T cells promotes pulmonary fibrosis through STAT3-mediated IL-17A and TGF-β1 production

Affiliations

PD-1 up-regulation on CD4+ T cells promotes pulmonary fibrosis through STAT3-mediated IL-17A and TGF-β1 production

Lindsay J Celada et al. Sci Transl Med. .

Abstract

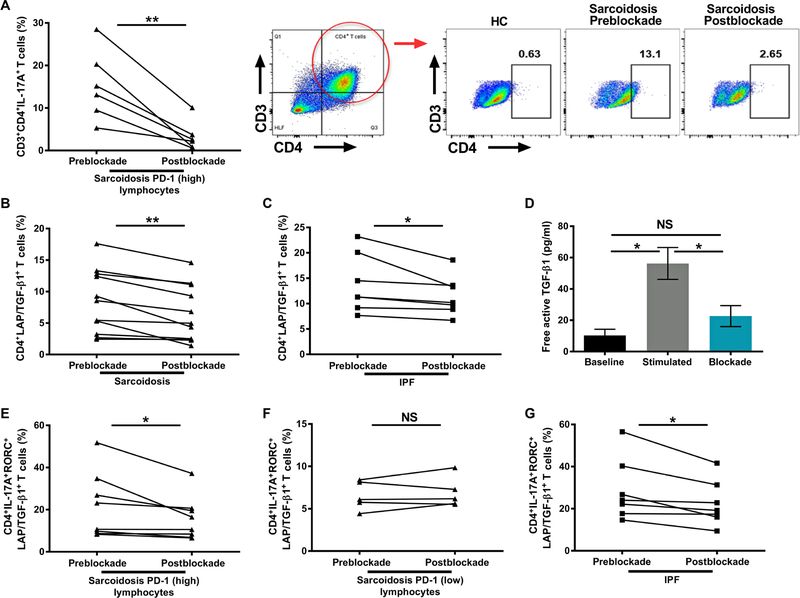
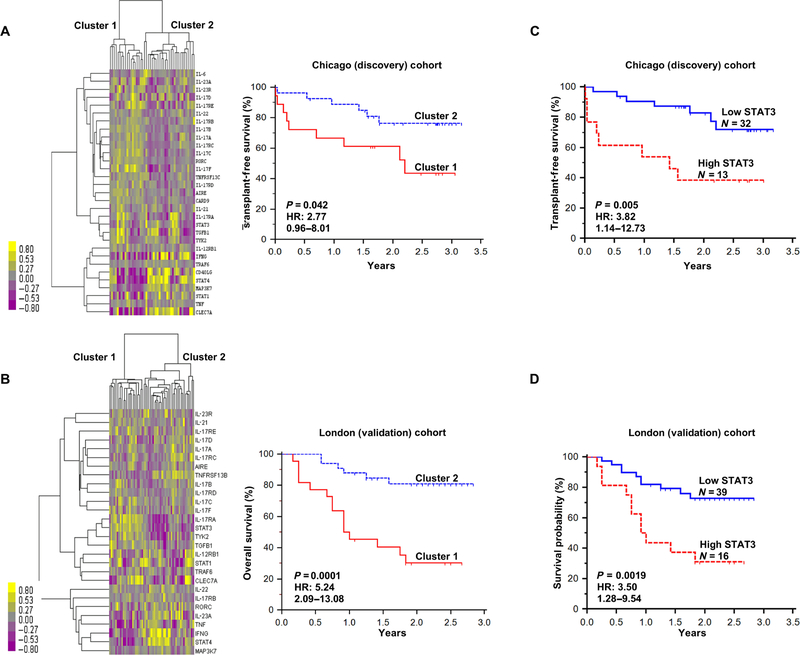
Pulmonary fibrosis is a progressive inflammatory disease with high mortality and limited therapeutic options. Previous genetic and immunologic investigations suggest common intersections between idiopathic pulmonary fibrosis (IPF), sarcoidosis, and murine models of pulmonary fibrosis. To identify immune responses that precede collagen deposition, we conducted molecular, immunohistochemical, and flow cytometric analysis of human and murine specimens. Immunohistochemistry revealed programmed cell death-1 (PD-1) up-regulation on IPF lymphocytes. PD-1+CD4+ T cells with reduced proliferative capacity and increased transforming growth factor-β (TGF-β)/interleukin-17A (IL-17A) expression were detected in IPF, sarcoidosis, and bleomycin CD4+ T cells. PD-1+ T helper 17 cells are the predominant CD4+ T cell subset expressing TGF-β. Coculture of PD-1+CD4+ T cells with human lung fibroblasts induced collagen-1 production. Strikingly, ex vivo PD-1 pathway blockade resulted in reductions in TGF-β and IL-17A expression from CD4+ T cells, with concomitant declines in collagen-1 production from fibroblasts. Molecular analysis demonstrated PD-1 regulation of the transcription factor STAT3 (signal transducer and activator of transcription 3). Chemical blockade of STAT3, using the inhibitor STATTIC, inhibited collagen-1 production. Both bleomycin administration to PD-1 null mice or use of antibody against programmed cell death ligand 1 (PD-L1) demonstrated significantly reduced fibrosis compared to controls. This work identifies a critical, previously unrecognized role for PD-1+CD4+ T cells in pulmonary fibrosis, supporting the use of readily available therapeutics that directly address interstitial lung disease pathophysiology.


Conflict of interest statement

Competing interests: N.K. and J.D.H.-M. are inventors on a patent application (number 20180101642) held by Yale University that covers a blood 52-gene expression signature useful to improve outcome prediction in IPF. N.K. is also an inventor on a patent application (number 9913819) held by Yale University that covers a method of preventing or treating a fibrotic lung disease. W.P.D. is an inventor on a patent application (number 62613600) submitted by Vanderbilt University that covers checkpoint inhibition in organ fibrosis.

Figures

Fig. 1.
Fig. 1.. PD-1 up-regulation in fibrotic lung disease.
(A) Baseline PD-1 on total CD4+ T cells (HC, n = 24; IPF = 25). (B) PD-1 expressed on CD4+ T cell subsets (HC, n = 10; TH1, Treg, and TH17, n = 7). (C) Percentage of proliferating CD4+ T cells from the peripheral blood of HC (n = 14) and IPF subjects (n = 20) after TCR stimulation with plate-bound CD3/CD28 antibodies. Corresponding histograms illustrating proliferative capacity for a HC and IPF patient. (D and E) Immunohistochemistry (IHC) assessment for PD-1 and PD-L1 (brown) in healthy and IPF pulmonary biopsies. Increased PD-1 expression on lymphocytes (upper right quadrant, arrows). Increased PD-L1 expression (lower right quadrant, arrows). N = 12. Comparisons between cohorts were performed using an unpaired two-tailed Student’s t test. Multiple group comparisons were performed using a one-way ANOVA with Tukey’s post hoc test. Proliferation data were analyzed using the Mann-Whitney U test. Bars indicate SEM. *P < 0.05, **P < 0.01, ***P < 0.001, ****P < 0.0001. NS, no significance; CFSE, carboxyfluorescein diacetate succinimidyl ester; FMO, fluorescence minus one.
Fig. 2.
Fig. 2.. TH17 cells are most likely to secrete TGF-β1 in association with PD-1 up-regulation after ex vivo stimulation.
Purified CD4+ T cells from the peripheral blood of HC, sarcoidosis, and IPF patients were TCR-stimulated and cultured for 24 hours. (A) Increased active TGF-β1 in the cell culture supernatants of sarcoidosis and IPF CD4+ T cells (HC, n = 9; sarc, n = 6; IPF, n = 8). (B) Frequency (left) and MFI (right) for total CD4+ T cells secreting TGF-β1 (HC, n = 12; sarc, n = 14; IPF, n = 7). (C) PD-1 percentages for total CD4+ T cells expressing TGF-β1 (HC, n = 6; sarc, n = 10; IPF, n = 7) and corresponding histograms. (D) Percentage of Tregs expressing TGF-β1 (HC, n = 14; sarc, n = 13; IPF, n = 7). (E) PD-1 expression on Tregs that are positive for TGF-β1 (HC, n = 8; sarc, n = 10; IPF, n = 7). (F) TH17 cells secreting TGF-β1 (frequency and MFI) in HC (n = 6), sarcoidosis patients according to baseline PD-1 expression (high, n = 8; low, n = 5) and IPF subjects (n = 7). (G) Percentage of TH17 cells that are secreting TGF-β1 and also expressing PD-1 (HC, n = 6; sarc, n = 13; IPF, n = 7). Histograms depict PD-1 expression on TGF-β1+ TH17 cells. (H) Percentage of TGF-β1 secreted by CD4+ T cell subsets. Comparisons between cohorts were performed using an unpaired two-tailed Student’s t test. Multiple group comparisons were performed using a one-way ANOVA with Tukey’s post hoc test. Bars indicate SEM. *P < 0.05, **P < 0.01, ***P < 0.001, ****P < 0.0001. NS, no significance for (A) to (G).
Fig. 3.
Fig. 3.. PD-1 blockade normalizes HLF collagen-1 production after coculture with patient T cells.
Purified CD4+ T cells were cultured overnight with or without the presence of anti–PD-1, anti–PD-L1, and anti–PD-L2. The following day, cells were TCR-stimulated and cocultured with purified HLF. (A) Percentage of fibroblasts (CD3CD4CD45) expressing collagen-1 when cultured alone (n = 14) and when cultured with HC (n = 8) or sarcoidosis (n = 12) CD4+ T cells. Collagen-1 assessment in cell culture supernatants from an independent experiment (HLF, n = 10; HC, n = 8; sarc, n = 8). (B) Collagen-1 expression by HLFs when cultured in the presence of purified CD4+ T cells isolated from IPF patients (n = 4). Collagen-1 in cell culture supernatants from an independent experiment (HLF, n = 10; HC, n = 8; IPF, n = 5). (C) Purified sarcoidosis CD4+ T cells from the same patients were cultured with (postblockade) or without (preblockade) the addition of PD-1–blocking antibodies. HLFs were added the following day, and the cells were cocultured at 37°C in 5% CO2 atmosphere. Percentage of fibroblasts expressing collagen-1 at baseline and in cocultures with sarcoidosis CD4+ T cells subsequent to PD-1 blockade [HLF (baseline), n = 14; preblockade, n = 13; postblockade, n = 13]. Collagen-1 expressed by fibroblasts cocultured with CD4+ T cells expressing high or low baseline PD-1 levels, before and after PD-1 blockade (high, n = 9; low, n = 4). (D) Percentage of collagen-1 expressed by HLFs cocultured with IPF CD4+ T cells pre- and postblockade (n = 4). (E) Collagen-1 assessment in coculture supernatants by HLF at baseline (HLF only) and with sarcoidosis CD4+ T cells before and after PD-1 pathway blockade and 24-hour TCR stimulation (n = 8). (F) Coculture lysates were immunoblotted with antibodies against COL1A1, α-SMA, and fibronectin after 24-hour TCR stimulation with and without the addition of PD-1–blocking antibodies. Representative Western blots for three sarcoidosis patients and quantification of results are depicted (baseline, n = 2; preblockade and postblockade, n = 5). Comparisons between cohorts were performed using an unpaired two-tailed Student’s t test. Preblockade and PD-1 pathway blockade cohort comparisons were analyzed using a paired Student’s t test. Multiple group comparisons were performed using a one-way ANOVA with Tukey’s post hoc test. Bars indicate SEM. *P < 0.05, **P < 0.01, ***P < 0.001, ****P < 0.0001. NS, no significance; GAPDH, glyceraldehyde-3-phosphate dehydrogenase.
Fig. 4.
Fig. 4.. PD-1 blockade reduces IL-17A and TGF-β1 expression.
Purified CD4+ T cells were cultured overnight with (postblockade) or without (preblockade) the presence of anti–PD-1, PD-L1, and PD-L2. The following day, cells were TCR-stimulated and cocultured with HLF. (A) CD4+IL-17A+ T cells with and without PD-1 blockade (n = 6). Representative FACS plots illustrating CD4+IL-17A+ T cell percentages pre- and postblockade. (B) Percentage of CD4+ T cells from sarcoidosis and (C) IPF patients secreting TGF-β1 pre- and postblockade (sarc, n = 11; IPF, n = 7). (D) Free active TGF-β1 in sarcoidosis coculture supernatants subsequent to PD-1 blockade. (E and F) Sarcoidosis TH17 cells expressing TGF-β1 after PD-1 pathway blockade according to CD4+ T cell baseline PD-1 levels (high PD-1, n = 8; low PD-1, n = 5). (G) Percentage of TH17 cells that are TGF-β1+ before and after PD-1 blockade in IPF patients (n = 7). Comparisons between cohorts were performed using an unpaired two-tailed Student’s t test. Preblockade and PD-1 pathway blockade cohort comparisons were analyzed using a paired Student’s t test. Multiple group comparisons were performed using a one-way ANOVA with Tukey’s post hoc test. Bars indicate SEM. *P < 0.05, **P < 0.01. NS, no significance.
Fig. 5.
Fig. 5.. PD-1 blockade reduces STAT3 mRNA and protein.
Purified CD4+ T cells from HC and sarcoidosis peripheral blood mononuclear cells (PBMCs) were TCR-stimulated for 24 hours at 37°C in 5% CO2. STAT3 protein expression was assessed using flow cytometry. (A) Percentage and MFI for CD4+ T cells expressing STAT3 (HC, n = 4; sarc, n = 8). (B) STAT3 gene expression was assessed using quantitative reverse transcription polymerase chain reaction (PCR). (HC, n = 6; high PD-1, n = 6; low PD-1, n = 4; IPF, n = 4). (C) STAT3 mRNA expression from sarcoidosis and IPF CD4+ T cells after PD-1 pathway blockade (n = 8). (D) CD4+ T cells were cultured overnight with or without the pSTAT3 inhibitor STATTIC. The following day, cells were TCR-stimulated in the presence of HLFs and cultured at 37°C in 5% CO2. Percentage of collagen-1 produced by fibroblasts that have been cultured in the presence of sarcoidosis CD4+ T cells without STATTIC (gray bar) and with STATTIC (green bar) (HLF, n = 14; sarcoidosis without STATTIC, n = 5; STATTIC, n = 5). Histograms illustrate percentage of collagen produced by fibroblasts before and after STAT3 inhibition. (E) Percentage of CD4+ T cells producing IL-17A before and after STATTIC inhibition and representative histograms. Comparisons between cohorts were performed using an unpaired two-tailed Student’s t test. Preblockade and PD-1 pathway blockade cohort comparisons were analyzed using a paired Student’s t test. Multiple group comparisons were performed using a one-way ANOVA with Tukey’s post hoc test. Bars indicate SEM. *P < 0.05, **P < 0.01. NS, no significance.
Fig. 6.
Fig. 6.. TH17 gene expression profiles in IPF.
(A) Hierarchical clustering of IPF discovery [University of Chicago (N = 45) (GSE27957)] and (B) validation cohort [Imperial College London (N = 55) (GSE93606)] based on a TH17 signature in PBMCs (discovery cohort) and whole blood (validation cohort) by GeneChip microarrays. Two major clusters of IPF patients were identified. Distinctions are present in transplant-free survival (TFS) over the course of 3.5 years post-diagnosis and overall survival between clusters in both the discovery and validation cohorts, respectively. (C) TFS for clusters 1 and 2 from the discovery cohort and (D) validation cohort based on the expression of STAT3.
Fig. 7.
Fig. 7.. Bleomycin-induced lung fibrotic murine model reveals reduced lung fibrosis in PD-1 null mice or after PD-L1 blockade.
(A) PD-1 percentages and MFI on CD4+ T cells from single-cell lung suspensions 21 days after bleomycin treatment. Matching histograms depicting PD-1 on CD4+ T cells. (B) Percentage and MFI for lung- derived CD4+PD-1+ T cells after TCR stimulation with plate-bound anti-CD3/CD28 antibodies after bleomycin treatment (PBS, n = 4; bleomycin, n = 8). Representative histograms showing percentage of PD-1 on CD4+ T cells after TCR stimulation. (C) CD4+ T cell proliferation subsequent to 5-day TCR stimulation and corresponding histograms (PBS, n = 3; bleomycin, n = 5). (D) Percentage of TH17 cells secreting TGF-β1 (PBS, n = 4; bleomycin, n = 8). Representative FACS plots illustrating percentage of TGF-β1 in a PBS- and bleomycin-treated mouse. (E) TGF-β1 percentages expressed by Tregs in PBS- treated (n = 4) and bleomycin- treated (n = 8) mice. Flow cytometry plots demonstrating percentage of TGF-β1 expressed by Tregs. (F) Percentage of TGF-β1 secreted by CD4+ T cell subsets. (G) Representative images for H&E- and trichrome-stained lungs with Ashcroft scoring 14 days after bleomycin injury from WT and PD-1 null mice. Scale bar, 100 μm. n = 4 in each cohort. Lungs were processed for measuring hydroxyproline levels by HPLC (n = 4 in each bleomycin cohort; n = 2 in NS cohort). (H) Trichrome-stained lungs and quantification of collagen content after isotype or anti–PD-L1 treatment 4 days after bleomycin administration to mice, as well as weight differences for isotype and anti–PD-L1 bleomycin-treated mice (n = 7). (I) Percentage of CD4+PD-1+ T cells by flow cytometry after anti–PD-L1 antibody administration to bleomycin-treated mice (n = 5). (J) Percentage of phosphorylated STAT3 at Tyr705 in CD4+ T cells from single-cell lung suspensions of bleomycin-treated mice after isotype and anti–PD-L1 antibody treatment (n = 10 and n = 12, respectively). (K) Linear correlation between PD-1 and pSTAT3 (Y705) after bleomycin administration. Comparisons between cohorts were performed using an unpaired two-tailed Student’s t test. Preblockade and PD-1 pathway blockade cohort comparisons were analyzed using a paired Student’s t test. Multiple group comparisons were performed using a one-way ANOVA with Tukey’s post hoc test. Proliferation data were analyzed using the Mann-Whitney U test. PD-1/pSTAT3 correlation analyzed using Spearman correlation. Bars indicate SEM. *P < 0.05, **P < 0.01, ***P < 0.001, ****P < 0.0001. NS, no significance.

Similar articles

Cited by

References

    1. Hams E, Armstrong ME, Barlow JL, Saunders SP, Schwartz C, Cooke G, Fahy RJ, Crotty TB, Hirani N, Flynn RJ, Voehringer D, McKenzie ANJ, Donnelly SC, Fallon PG, IL-25 and type 2 innate lymphoid cells induce pulmonary fibrosis. Proc. Natl. Acad. Sci. U.S.A 111, 367–372 (2014). - PMC - PubMed
    1. Pesce JT, Ramalingam TR, Wilson MS, Mentink-Kane MM, Thompson RW, Cheever AW, Urban JF Jr., Wynn TA, Retnla (Relmα/Fizz1) suppresses helminthinduced Th2-type immunity. PLOS Pathog. 5, e1000393 (2009). - PMC - PubMed
    1. Tager AM, LaCamera P, Shea BS, Campanella GS, Selman M, Zhao Z, Polosukhin V, Wain J, Karimi-Shah BA, Kim ND, Hart WK, Pardo A, Blackwell TS, Xu Y, Chun J, Luster AD, The lysophosphatidic acid receptor LPA1 links pulmonary fibrosis to lung injury by mediating fibroblast recruitment and vascular leak. Nat. Med 14, 45–54 (2008). - PubMed
    1. King TE Jr., Bradford WZ, Castro-Bernardini S, Fagan EA, Glaspole I, Glassberg MK, Gorina E, Hopkins PM, Kardatzke D, Lancaster L, Lederer DJ, Nathan SD, Pereira CA, Sahn SA, Sussman R, Swigris JJ, Noble PW, A phase 3 trial of pirfenidone in patients with idiopathic pulmonary fibrosis. N. Engl. J. Med 370, 2083–2092 (2014). - PubMed
    1. Kolodsick JE, Toews GB, Jakubzick C, Hogaboam C, Moore TA, McKenzie A, Wilke CA, Chrisman CJ, Moore BB, Protection from fluorescein isothiocyanateinduced fibrosis in IL-13-deficient, but not IL-4-deficient, mice results from impaired collagen synthesis by fibroblasts. J. Immunol 172, 4068–4076 (2004). - PubMed

Publication types

MeSH terms