

Metabolic regulation of pluripotency and germ cell fate through α-ketoglutarate
- PMID: 30257965
- PMCID: PMC6315289
- DOI: 10.15252/embj.201899518
Metabolic regulation of pluripotency and germ cell fate through α-ketoglutarate
Abstract
An intricate link is becoming apparent between metabolism and cellular identities. Here, we explore the basis for such a link in an in vitro model for early mouse embryonic development: from naïve pluripotency to the specification of primordial germ cells (PGCs). Using single-cell RNA-seq with statistical modelling and modulation of energy metabolism, we demonstrate a functional role for oxidative mitochondrial metabolism in naïve pluripotency. We link mitochondrial tricarboxylic acid cycle activity to IDH2-mediated production of alpha-ketoglutarate and through it, the activity of key epigenetic regulators. Accordingly, this metabolite has a role in the maintenance of naïve pluripotency as well as in PGC differentiation, likely through preserving a particular histone methylation status underlying the transient state of developmental competence for the PGC fate. We reveal a link between energy metabolism and epigenetic control of cell state transitions during a developmental trajectory towards germ cell specification, and establish a paradigm for stabilizing fleeting cellular states through metabolic modulation.
Keywords: cell state transitions; germ cells; metabolism; pseudotime analysis; single‐cell analysis.
© 2018 The Authors. Published under the terms of the CC BY 4.0 license.
Figures
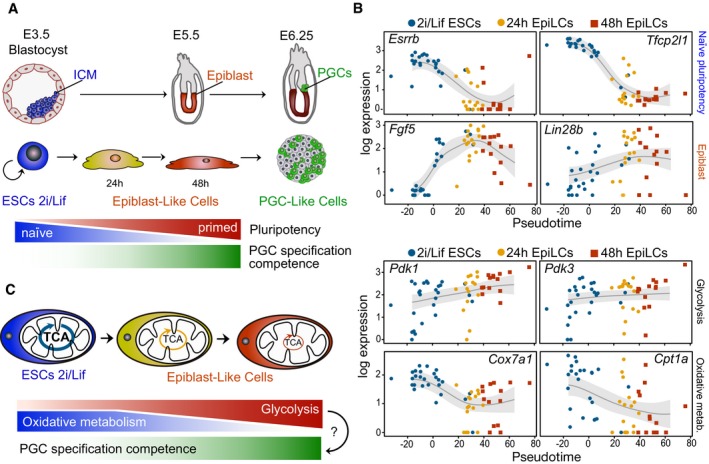
Model depicting the conversion of mouse embryonic stem cells (ESCs) from a naïve pluripotent state in 2i/Lif culture conditions to primed epiblast‐like cells (EpiLCs), which acquire transient competence for induction into primordial germ cell (PGC)‐like cell fate. Corresponding developmental stages are shown in the mouse embryo.
Single‐cell expression data in pseudotime of central regulators of naïve pluripotency, epiblast marker genes, glycolytic regulators and genes with key functions in oxidative metabolism.
Schematic illustrating the dynamic changes in energy metabolism during the acquisition of developmental competence for the PGC fate. TCA, tricarboxylic acid cycle.
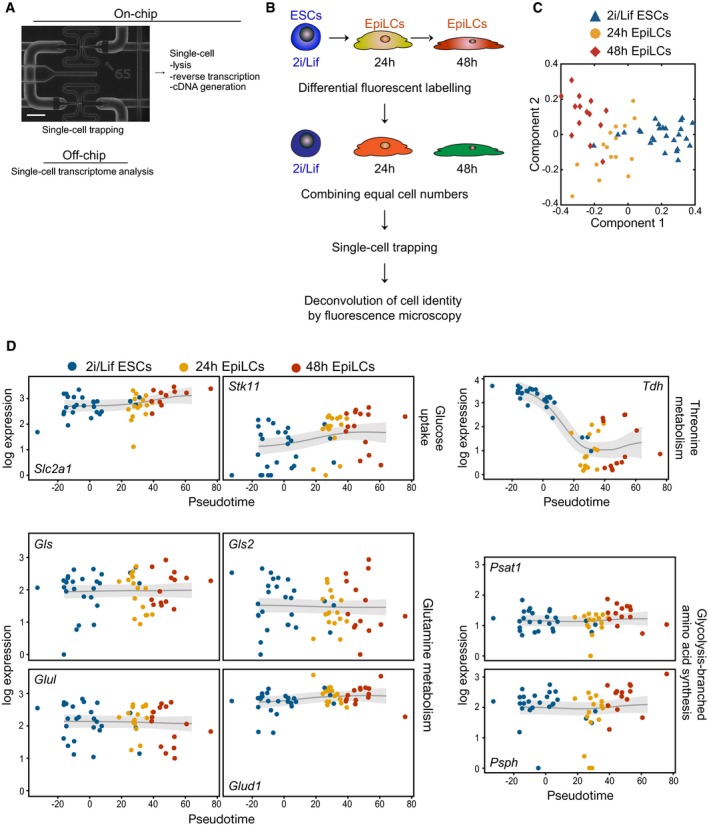
Overview of the process flow of single‐cell transcriptome analysis using the C1 Single‐Cell AutoPrep System (Fluidigm). A magnified image of a microfluidic chip with single cells trapped within individual capture sites is shown. Scale bar, 20 μm.
Scheme for the concurrent processing of single cells harvested at time points t = 0 h (ESCs 2i/Lif/KSR), t = 24 and t = 48 h following staggered EpiLC induction.
GPLVM plot of single‐cell transcriptome data from ESCs in 2i/Lif/KSR, 24 and 48 h EpiLCs.
Pseudotime expression trajectories for regulators with key functions in glucose uptake, threonine and glutamine metabolism, and glycolysis‐branched amino acid synthesis.
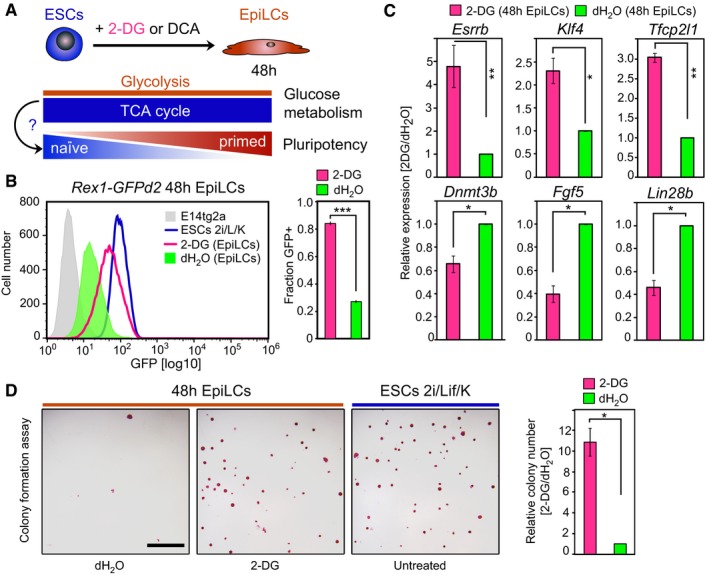
Investigating the effect of sustained oxidative mitochondrial metabolism on the transition from naïve ESCs to primed EpiLCs through supplementation of the glycolysis inhibitors 2‐deoxy‐D‐glucose (2‐DG) and dichloroacetate (DCA), respectively.
Flow cytometry analysis of Rex1‐GFPd2 cells following addition of 10 mM 2‐DG during the 48 h EpiLC induction. Representative GFP intensity distributions are depicted. Average proportions of Rex1‐GFPd2‐positive (GFP+) cells are quantified from two independent biological replicates. Error bars represent ± SE. ***P = 0.0006 (unpaired 1‐tailed Student's t‐test).
Expression analysis by qRT–PCR of naïve pluripotency and epiblast marker genes in bulk 48 h cells after 10 mM 2‐DG treatment. Relative expression levels, normalized to control culture conditions, are shown. Graphs represent averages from triplicate (duplicate for Klf4 and Tfcp2l1) independent biological experiments. Error bars denote ± SE. *P ≤ 0.05; **P ≤ 0.01 (unpaired 1‐tailed Student's t‐test, see Appendix Table S3 for exact P‐values).
Colony‐forming ability following 10 mM 2‐DG supplementation during EpiLC stimulation. Representative images of alkaline phosphatase (AP)‐stained colonies are displayed. Scale bar, 250 μm. The average colony formation, normalized to control culture conditions, quantified from two independent biological replicates, is shown. Error bars signify ± SE. *P = 0.0424 (unpaired 1‐tailed Student's t‐test).
- A–G
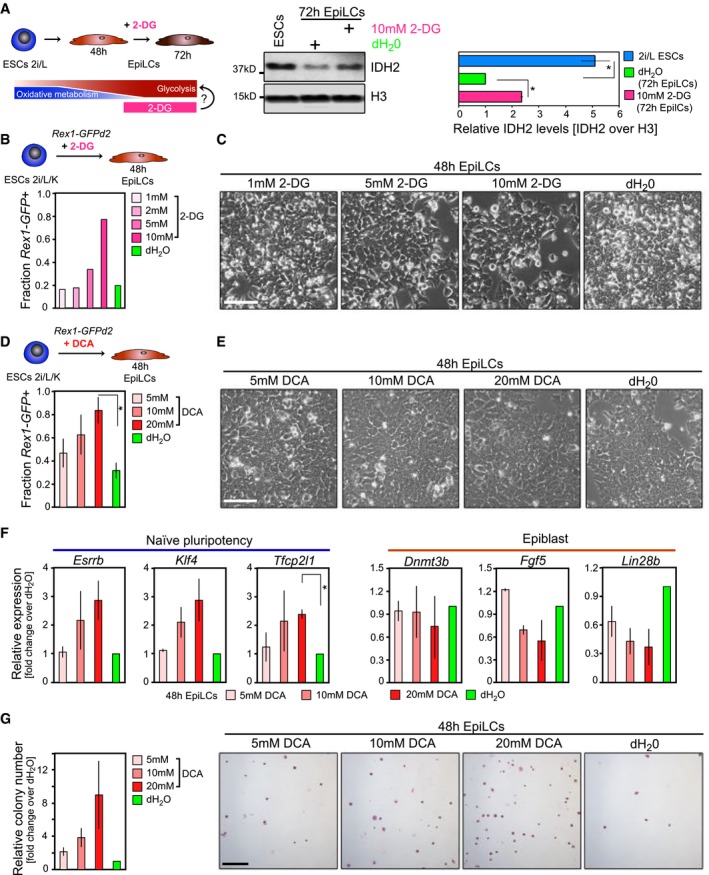
Examining the effect of glycolytic inhibition on pluripotent state through supplementation of 2‐deoxy‐D‐glucose (2‐DG; A–C) and pyruvate dehydrogenase kinase (PDK) inhibitor dichloroacetate (DCA; D–G), respectively, during the ESC‐to‐EpiLC transition. (A) Western blot showing protein levels for the αKG‐generating enzyme IDH2 as a marker for TCA cycle activity after addition of 2‐DG and dH2O, respectively, from t = 48 to t = 72 h during EpiLC differentiation. H3 is used as a loading control. Quantifications are based on two independent experiments. Error bars signify ± SE. *P ≤ 0.05 (unpaired 1‐tailed Student's t‐test, see Appendix Table S3 for precise P‐values). (B, D) Flow cytometry‐based quantification of Rex1‐GFPd2 cells following 2‐DG and DCA supplementation, respectively. (D) Proportions of Rex1‐GFPd2‐positive (GFP+) cells represent averages from duplicate experiments, with error bars denoting ± SE. *P = 0.0403 (unpaired 1‐tailed Student's t‐test). (C, E) Characteristic bright‐field images after addition of 2‐DG and DCA, respectively, during the 48 h EpiLC induction. Scale bar, 10 μm. (F) Expression analysis by qRT–PCR of naïve pluripotency regulators and epiblast marker genes in bulk 48 h cells following culture in EpiLC‐inducing conditions in the presence of increasing doses of DCA. Graphs show average fold changes in expression over control culture conditions from duplicate experiments. Error bars indicate ± SE. *P = 0.0246 (unpaired 1‐tailed Student's t‐test). (G) Colony‐forming ability subsequent to 48 h DCA treatment. Representative images of AP‐stained colonies are displayed. Scale bar, 250 μm. Colony formation following DCA supplementation is normalized to control‐treated cells. Graphs represent averages from duplicate experiments. Error bars signify ± SE.
- A
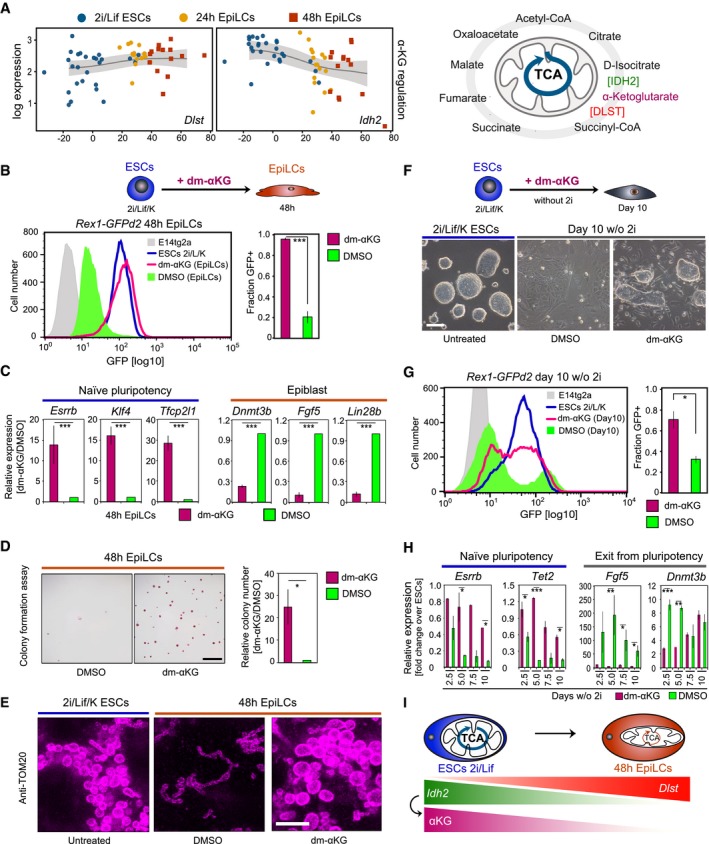
Pseudotime expression profiles for the αKG‐regulating enzymes Idh2 and Dlst during the transition from naïve to primed pluripotency. TCA cycle enzymes and metabolites produced within the TCA cycle are illustrated.
- B
Representative flow cytometry profiles of Rex1‐GFPd2 cells following 4 mM dm‐αKG supplementation during the EpiLC induction are depicted. Graphs show average fractions of Rex1‐GFPd2‐positive (GFP+) cells from six independent biological assays. Error bars indicate ± SE. ***P = 1.241E‐05 (unpaired 1‐tailed Student's t‐test).
- C
qRT–PCR analysis of naïve pluripotency regulators and epiblast marker genes following EpiLC stimulation in the presence of 4 mM dm‐αKG. Expression data are normalized to control culture conditions and represent averages from five biological replicates in bulk 48 h cells. Error bars denote ± SE. ***P ≤ 0.005 (unpaired 1‐tailed Student's t‐test, see Appendix Table S3 for exact P‐values).
- D
Colony‐forming ability succeeding 4 mM dm‐αKG treatment during the 48 h EpiLC induction. Characteristic images of AP‐stained colonies are shown. Scale bar, 250 μm. Colony formation is normalized to control‐treated cells and quantified from quadruplicate experiments. Error bars signify ± SE. *P = 0.0283 (unpaired 1‐tailed Student's t‐test).
- E
Representative super‐resolution images of TOM‐20 immune‐labelled mitochondria in ESCs following 48 h culture in 2i/Lif/KSR media, and EpiLC‐inducing conditions in the presence of 4 mM dm‐αKG and DMSO, respectively, are displayed. Scale bar, 3 μm.
- F–H
Ten‐day culture of Rex1‐GFPd2 cells in N2B27/Lif/KSR with 4 mM dm‐αKG and DMSO, respectively, with passaging every 2.5 days. (F) Characteristic bright‐field images of Rex1‐GFPd2 cells after 10 days of culture in 2i/Lif/KSR and N2B27/Lif/KSR, in the presence of dm‐αKG and DMSO, respectively. Scale bar, 10 μm. (G) Flow cytometer‐based quantification of Rex1‐GFPd2‐positive (GFP+) cells. Representative GFP intensity distributions are displayed. The average fractions of GFP+ cells are measured from duplicate experiments. Error bars denote ± SE. *P = 0.0477 (unpaired 1‐tailed Student's t‐test). (H) qRT–PCR analysis of naïve pluripotency and differentiation markers in bulk cells harvested at 2.5‐day intervals during the 10‐day culture in N2B27/Lif/KSR with dm‐αKG or DMSO. Expression data are normalized to time‐matched ESCs in 2i/Lif/KSR culture conditions and are averaged over two independent biological experiments. Error bars indicate ± SE. *P ≤ 0.05; **P ≤ 0.01; ***P ≤ 0.005 (unpaired 1‐tailed Student's t‐test, see Appendix Table S3 for precise P‐values).
- I
Model illustrating the IDH2‐mediated production of αKG in the mitochondrial TCA cycle during oxidative metabolism in ESCs in naïve pluripotency conditions.
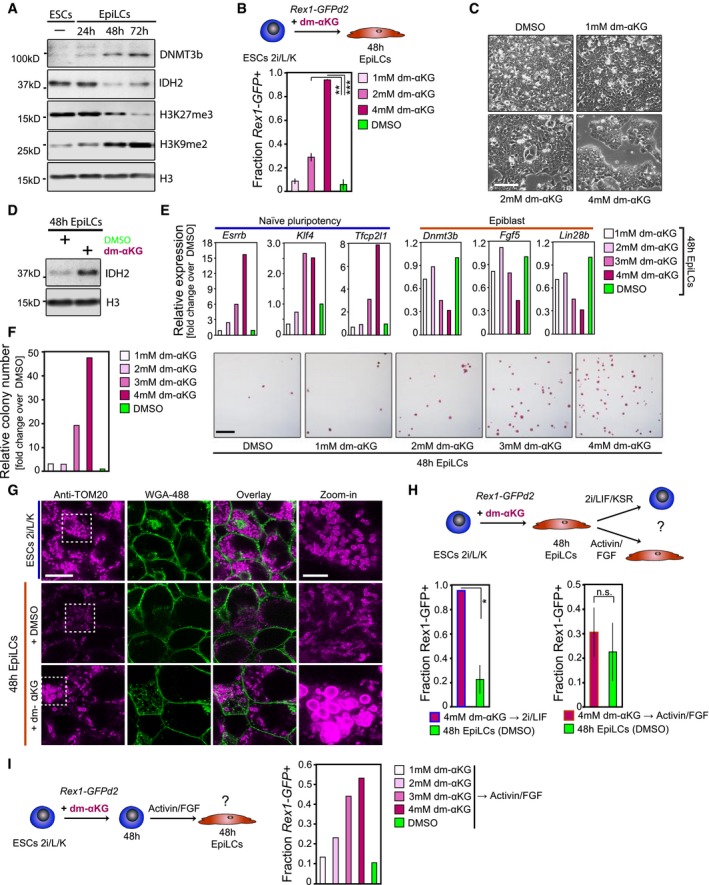
- A
Representative Western blot showing DNMT3b, IDH2, H3K27me3 and H3K27me2 dynamics during the ESC‐to EpiLC transition. H3 is used as a loading control.
- B–D
Investigating the impact of dm‐αKG supplementation during the ESC‐to‐EpiLC transition on pluripotent state. (B) Flow cytometer analysis of Rex1‐GFPd2‐positive (Rex1‐GFP+) cells. Graphs represent average fractions of Rex1‐GFP+ cells quantified from triplicate experiments. Error bars denote ± SE. **P ≤ 0.01; ***P ≤ 0.005 (unpaired 1‐tailed Student's t‐test, see Appendix Table S3 for precise P‐values). (C) Characteristic bright‐field images of Rex1‐GFPd2 cells following 48 h culture in EpiLC‐inducing conditions in the presence of increasing doses of dm‐αKG. Scale bar, 10 μm. (D) Representative Western blot displaying IDH2 levels following 48 h EpiLC stimulation with 4 mM dm‐αKG and DMSO, respectively. H3 is used as a loading control.
- E
Expression analysis by qRT–PCR of key regulators of naïve pluripotency and epiblast genes in bulk 48 h cells. Transcript levels are normalized to levels in control culture conditions.
- F
Colony formation after culture with increasing dm‐αKG concentration during the ESC‐to‐EpiLC transition, normalized to control culture conditions. Representative images of AP‐stained colonies are displayed. Scale bar, 250 μm.
- G
Super‐resolution images of TOM‐20 immune‐stained outer mitochondrial membranes (in magenta) following 48 h culture in 2i/Lif/KSR and EpiLC‐inducing conditions with 4 mM dm‐αKG and DMSO, respectively. Cell membranes (in green) are stained with Alexa‐488‐coupled wheat germ agglutinin (WGA‐488). Scale bars, 10 and 3 μm (in zoomed‐in images), respectively.
- H
Flow cytometry‐based quantification of Rex1‐GFPd2‐positive (Rex1‐GFP+) cells following 4 mM dm‐αKG supplementation during the ESC‐to‐EpiLC transition, and subsequent release into standard 2i/Lif/KSR and EpiLC culture conditions, respectively. Average fractions of Rex1‐GFP+ cells are calculated from duplicate experiments each. Error bars indicate ± SE. *P = 0.0517 (unpaired 1‐tailed Student's t‐test).
- I
Flow cytometer analysis of Rex1‐GFPd2‐positive (GFP+) cells following 48 h dm‐αKG pre‐treatment of ESCs in 2i/Lif/KSR culture conditions and subsequent release into EpiLC‐inducing culture conditions.
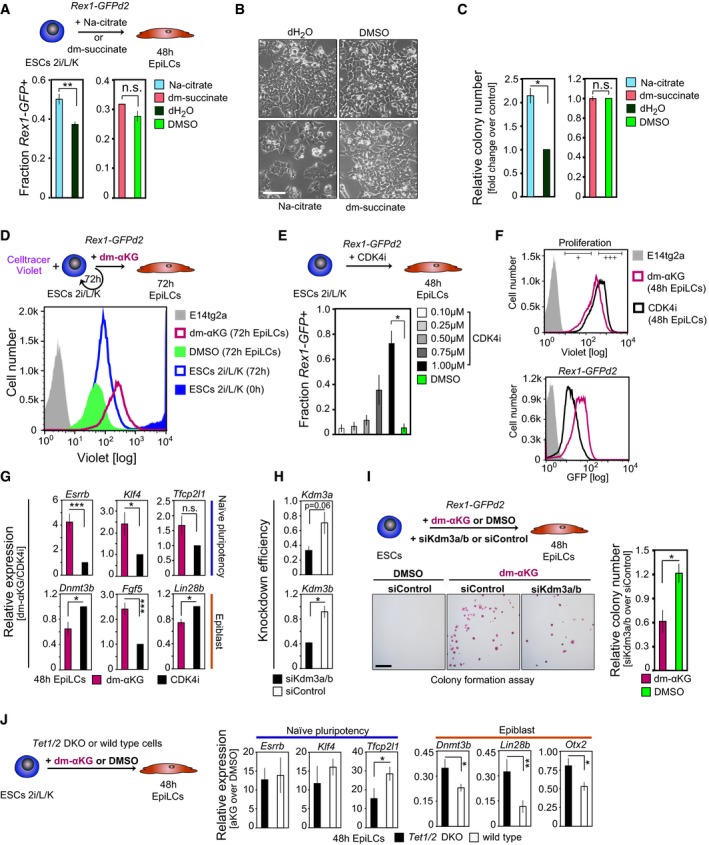
- A
Flow cytometer analysis of Rex1‐GFPd2 cells following 48 h EpiLC stimulation in the presence of 4 mM sodium citrate dehydrate (Na‐citrate; graphs represent averages from quadruplicate assays) and 4 mM dimethyl succinate (dm‐succinate; graphs show averages from duplicate assays). Error bars signify ± SE. **P = 0.0058 (unpaired 1‐tailed Student's t‐test).
- B
Representative bright‐field images after 48 h EpiLC induction with 4 mM Na‐citrate and dm‐succinate, respectively. Scale bar, 10 μm.
- C
Colony‐forming ability following addition of 4 mM Na‐citrate and dm‐succinate, respectively, during the EpiLC induction. Graphs represent colony formation normalized to control culture conditions, averaged over duplicate experiments each. Error bars denote ± SE. *P = 0.0459 (unpaired 1‐tailed Student's t‐test).
- D, E
Investigating the impact of proliferation rate on cell state. (D) Cell proliferation analysis through CellTrace Violet labelling of Rex1‐GFPd2 ESCs in 2i/Lif/KSR culture conditions (t = 0 h) followed by flow cytometry‐based evaluation of dye dilution in the presence of 4 mM dm‐αKG and DMSO, respectively, at t = 72 h. (E) Flow cytometer‐based quantification of Rex1‐GFPd2 cells following EpiLC stimulation in the presence of increasing concentrations of CDK4 inhibitor (CDK4i). Graphs represent the average fractions of Rex1‐GFPd2‐positive (Rex1‐GFP+) cells from duplicate experiments. Error bars indicate ± SE. *P = 0.0375 (unpaired 1‐tailed Student's t‐test).
- F
FACS profiles of CellTrace Violet‐labelled Rex1‐GFPd2 cells at t = 48 h, following supplementation of 4 mM dm‐αKG and 1 μM CDK4i, respectively, during the ESC‐to‐EpiLC transition. Cells are gated based on CellTrace Violet intensities (+++, CellTrace Violet‐high; +, CellTrace Violet‐low) and collected for transcript profiling (see G).
- G
qRT–PCR analysis of FACS‐sorted CellTrace Violet‐labelled Rex1‐GFPd2 cells of matching CellTrace Violet intensities. Transcript levels are normalized to levels in CDK4i‐treated cells, averaged over both CellTrace Violet‐high (+++) and CellTrace Violet‐low (+) fractions, and represent duplicate experiments. Error bars denote ± SE. *P ≤ 0.05; ***P ≤ 0.005 (unpaired 1‐tailed Student's t‐test, see Appendix Table S3 for all P‐values).
- H
Expression analysis by qRT–PCR confirms the small‐interfering RNA (siRNA)‐mediated knockdown of Kdm3a and Kdm3b in ESCs in 2i/Lif conditions. Knockdown efficiencies represent expression levels at t = 48 h after siRNA transfection normalized to levels prior to siRNA transfection (t = 0 h) and are averaged over duplicate experiments. Error bars signify ± SE. *P = 0.0327 (unpaired 1‐tailed Student's t‐test).
- I
Colony‐forming abilities of cells subsequent to the combinatorial knockdown of Kdm3a and Kdm3b and EpiLC differentiation in the presence of 4 mM dm‐αKG and DMSO, respectively. Representative images of AP‐positive colonies are displayed. Scale bar, 250 μm. Graphs show relative colony formation following Kdm3a/b knockdown, normalized to non‐targeting control siRNA‐treated cells derived under identical culture conditions, averaged over duplicate assays. Error bars denote ± SE. *P = 0.0438 (unpaired 1‐tailed Student's t‐test).
- J
Expression analysis by qRT–PCR of naïve pluripotency and epiblast marker genes in Tet1/2 wild‐type and double‐knockout (DKO) cells following 4 mM dm‐αKG and DMSO, respectively, supplementation during the 48 h EpiLC induction. Transcript levels are normalized to levels in the respective control‐treated cells. Averages of five independent biological assays are shown. Error bars indicate ± SE. *P ≤ 0.05; **P ≤ 0.01 (unpaired 1‐tailed Student's t‐test, see Appendix Table S3 for all P‐values).
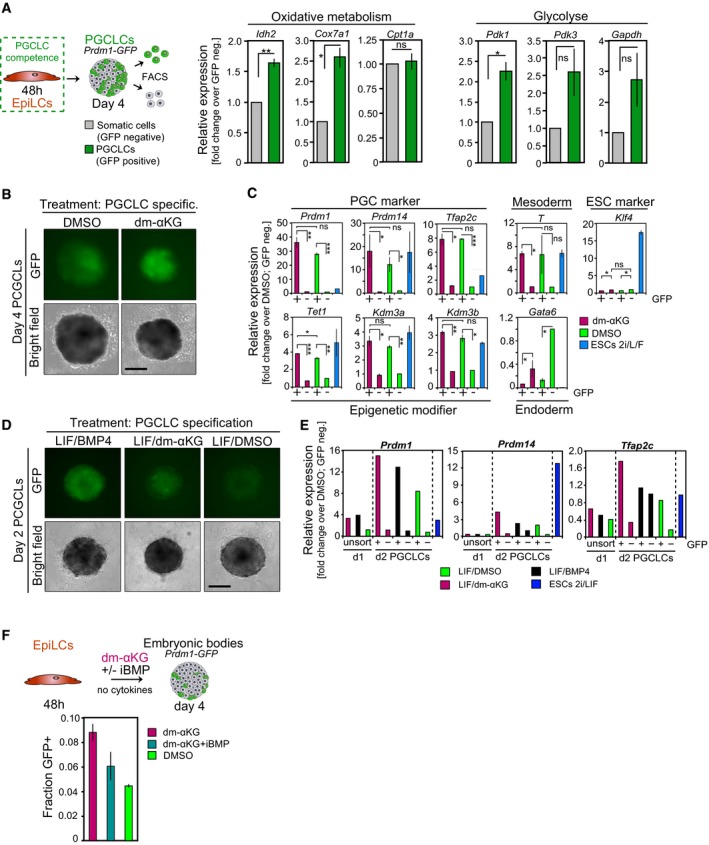
- A
qRT–PCR analysis of key regulators implicated in oxidative (Cox7a1, Cpt1a), glycolytic (Pdk1, Pdk3, Gapdh) and αKG (Idh2) metabolism, respectively, in FACS‐purified Prdm1‐GFP‐positive (GFP+) and Prdm1‐GFP‐negative (GFP−) cells of day‐4 PGCLC embryoids. Transcript levels are normalized to levels in GFP− fractions of control‐treated embryoids. Graphs represent triplicate experiments. Error bars indicate ± SE. *P ≤ 0.05; **P ≤ 0.01 (unpaired 1‐tailed Student's t‐test, see Appendix Table S3 for all P‐values).
- B, C
PGCLC induction in the presence of PGC cytokines and 4 mM dm‐αKG. (B) Characteristic bright‐field and corresponding fluorescence images of day‐4 Prdm1‐GFP PGCLC aggregates are shown. Scale bar, 20 μm. Fluorescent image intensity scales (in units of counts) are adjusted equally. (C) Expression analysis by qRT–PCR in FACS‐purified Prdm1‐GFP‐positive (GFP+) and Prdm1‐GFP‐negative (GFP−) cells at day 4 of PGCLC induction. Transcript levels are normalized to levels in GFP− fractions of control‐treated embryoids. Graphs represent duplicate experiments. Error bars indicate ± SE. *P ≤ 0.05; **P ≤ 0.01; ***P ≤ 0.005 (unpaired 1‐tailed Student's t‐test, see Appendix Table S3 for all P‐values).
- D, E
PGCLC differentiation upon addition of 4 mM dm‐αKG, without cytokines. (D) Characteristic bright‐field and fluorescence images of Prdm1‐GFP embryoids after 2 days of aggregation with LIF (10 ng ml−1) and BMP4 (500 ng ml−1) or dm‐αKG (4 mM) are presented. Scale bar, 20 μm. Fluorescent image intensity scales (in units of counts) are adjusted equally. (E) Expression analysis by qRT–PCR of the key PGC regulators Prdm1, Prdm14 and Tfap2c in FACS‐purified Prdm1‐GFP‐positive (GFP+) and Prdm1‐GFP‐negative (GFP−) embryoids following 2 days of aggregation in the presence of LIF (10 ng ml−1) and BMP4 (500 ng ml−1) or dm‐αKG (4 mM). Transcript levels are normalized to levels in GFP− cells from BMP4‐stimulated embryoids.
- F
Flow cytometer‐based quantification of Prdm1‐GFP‐positive (GFP+) cells following 4 days of aggregation in the presence of 4 mM dm‐αKG and 500 nM inhibitor of BMP signalling (iBMP), without external BMP4/8 supplementation. Average fractions of GFP+ cells are quantified from duplicate assays. Error bars denote ± SE.
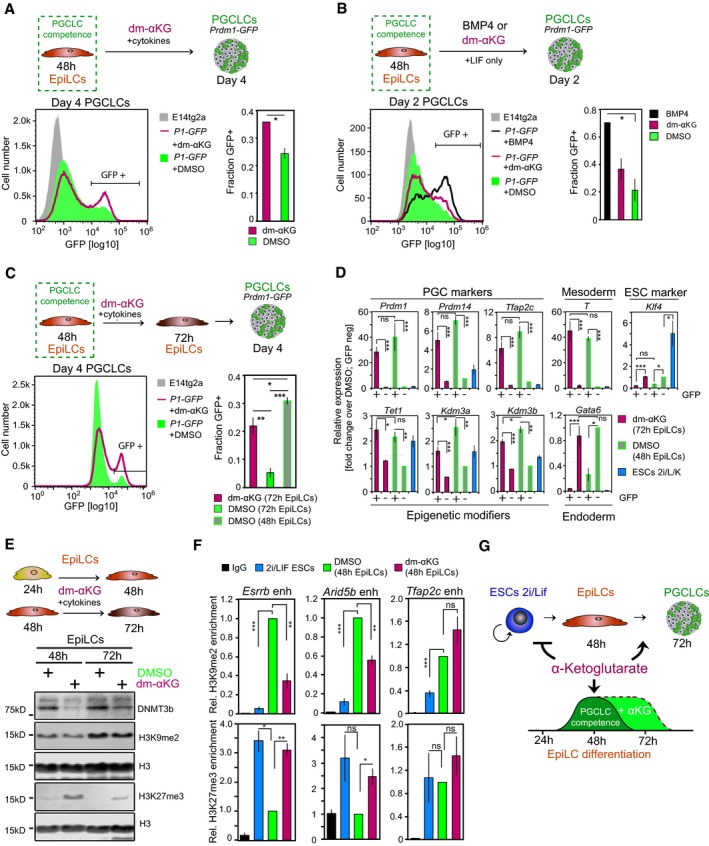
FACS analysis of Prdm1‐GFP‐positive (GFP+) cells in day‐4 embryoids specified in the presence of 4 mM dm‐αKG and PGC cytokines. Representative flow cytometer profiles are depicted. Graphs show the average fractions of GFP+ cells from duplicate experiments. Error bars denote ± SE. *P = 0.0526 (unpaired 1‐tailed Student's t‐test). P1‐GFP, Prdm1‐GFP.
FACS analysis of Prdm1‐GFP‐positive (GFP+) cells in day‐2 embryoids aggregated under addition of LIF (10 ng ml−1) and BMP4 (500 ng ml−1), dm‐αKG (4 mM) or DMSO. Representative flow cytometer profiles are displayed. Average fractions of GFP+ cells are calculated from duplicate assays. Error bars denote ± SE. *P = 0.0526. P1‐GFP, Prdm1‐GFP.
FACS analysis of Prdm1‐GFP‐positive (GFP+) cells in day‐4 PGCLC aggregates specified from 4 mM dm‐αKG‐treated (t = 48 to t = 72 h) EpiLCs. Representative flow cytometer profiles are depicted. The average fractions of GFP+ cells, quantified from triplicate experiments, are shown. Error bars signify ± SE. *P ≤ 0.05; **P ≤ 0.01; ***P ≤ 0.005 (unpaired 1‐tailed Student's t‐test, see Appendix Table S3 for precise P‐values). P1‐GFP, Prdm1‐GFP.
Transcript analysis by qRT–PCR of PGC specifiers, demethylating enzymes, mesoderm, endoderm and ESC regulators in FACS‐sorted day‐4 Prdm1‐GFP embryoids induced from 4 mM dm‐αKG‐treated 72 h EpiLCs. Expression levels are normalized to Prdm1‐GFP‐negative cells from control embryoids. Graphs represent averages from triplicate experiments. Error bars indicate ± SE. *P ≤ 0.05; **P ≤ 0.01; ***P ≤ 0.005 (unpaired 1‐tailed Student's t‐test, see Appendix Table S3 for precise P‐values). +, Prdm1‐GFP‐positive cells; −, Prdm1‐GFP‐negative cells.
Western blot analysis for H3K9me2, H3K27me3 and DNMT3b in 4 mM dm‐αKG‐treated EpiLCs. H3 is used as a loading control.
ChIP‐qPCR analysis of H3K9me2 and H3K27me3 in putative enhancer regions of genes associated with the naïve pluripotent state (Esrrb, Arid5b) and PGC fate (Tfap2c), respectively, in naïve ESCs and at t = 48 h following EpiLC induction in the presence of 4 mM dm‐αKG and DMSO, respectively. Graphs show enrichment of H3K9me2, H3K27me3 and IgG control, respectively, relative to DMSO‐treated EpiLCs. Averages represent triplicate independent experiments. Error bars signify ± SE. *P ≤ 0.05; **P ≤ 0.01; ***P ≤ 0.005 (unpaired 1‐tailed Student's t‐test, see Appendix Table S3 for precise P‐values).
Model illustrating the extension of the transient developmental competence for the PGC fate through αKG.
- A, B
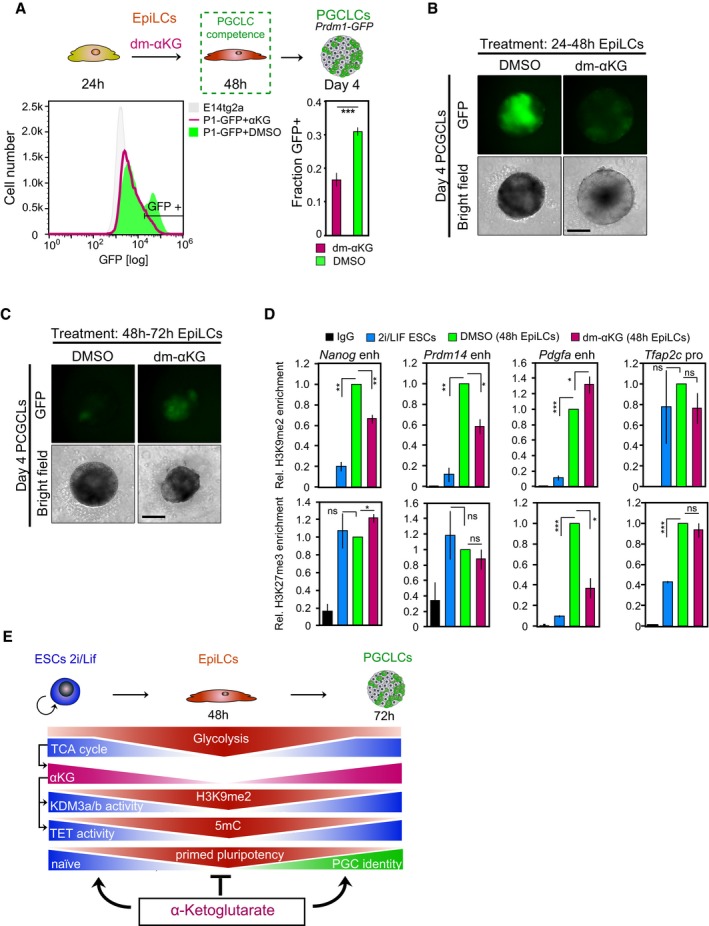
Day‐4 Prdm1‐GFP aggregates induced from 48 h EpiLCs following dm‐αKG supplementation from t = 24 to t = 48 h during the EpiLC differentiation. (A) Characteristic flow cytometer profiles are presented. Average proportions of Prdm1‐GFP‐positive (GFP+) cells are quantified from triplicate experiments. Error bars indicate ± SE. ***P = 0.0035 (unpaired 1‐tailed Student's t‐test). (B) Representative bright‐field and fluorescent images of day‐4 Prdm1‐GFP aggregates are shown. Scale bar, 20 μm. Fluorescent image intensity scales (in units of counts) are adjusted equally.
- C
Characteristic bright‐field and fluorescent images of day‐4 Prdm1‐GFP aggregates specified from 72 h EpiLCs following dm‐αKG supplementation from t = 48 to t = 72 h during the EpiLC differentiation are presented. Scale bar, 20 μm. Fluorescent image intensity scales (in units of counts) are adjusted equally.
- D
ChIP‐qPCR analysis of H3K9me2 and H3K27me3 in selected cis‐regulatory regions in naïve ESCs and at t = 48 h following EpiLC induction in the presence of 4 mM dm‐αKG and DMSO, respectively. Graphs show enrichment of H3K9me2, H3K27me3 and IgG control, respectively, relative to DMSO‐treated EpiLCs. Averages represent triplicate independent experiments. Error bars indicate ± SE. *P ≤ 0.05; **P ≤ 0.01; ***P ≤ 0.005 (unpaired 1‐tailed Student's t‐test, see Appendix Table S3 for all P‐values).
- E
Model illustrating the effect of αKG on the epigenetic state and, in turn, cell fate competency.
Comment in
-
Alpha-ketoglutarate: a "magic" metabolite in early germ cell development.EMBO J. 2019 Jan 3;38(1):e100615. doi: 10.15252/embj.2018100615. Epub 2018 Oct 1. EMBO J. 2019. PMID: 30275267 Free PMC article.
References
-
- Aramaki S, Hayashi K, Kurimoto K, Ohta H, Yabuta Y, Iwanari H, Mochizuki Y, Hamakubo T, Kato Y, Shirahige K, Saitou M (2013) A mesodermal factor, T, specifies mouse germ cell fate by directly activating germline determinants. Dev Cell 27: 516–529 - PubMed
-
- Brind'Amour J, Liu S, Hudson M, Chen C, Karimi MM, Lorincz MC (2015) An ultra‐low‐input native ChIP‐seq protocol for genome‐wide profiling of rare cell populations. Nat Commun 6: 6033 - PubMed
Publication types
MeSH terms
Substances
Grants and funding
LinkOut - more resources
Full Text Sources
Other Literature Sources
Molecular Biology Databases
Miscellaneous
