. 2018 Nov 27;92(24):e00988-18.
doi: 10.1128/JVI.00988-18. Print 2018 Dec 15.

Spatiotemporal Distribution and Evolution of the A/H1N1 2009 Pandemic Influenza Virus in Pigs in France from 2009 to 2017: Identification of a Potential Swine-Specific Lineage

Affiliations

Spatiotemporal Distribution and Evolution of the A/H1N1 2009 Pandemic Influenza Virus in Pigs in France from 2009 to 2017: Identification of a Potential Swine-Specific Lineage

Amélie Chastagner et al. J Virol. .

Abstract

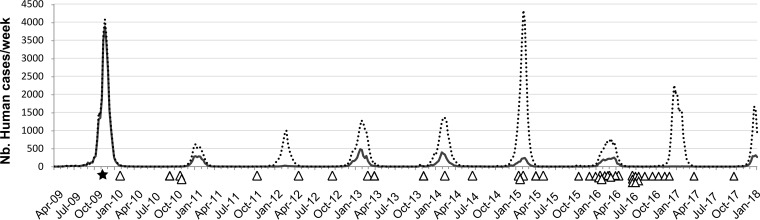
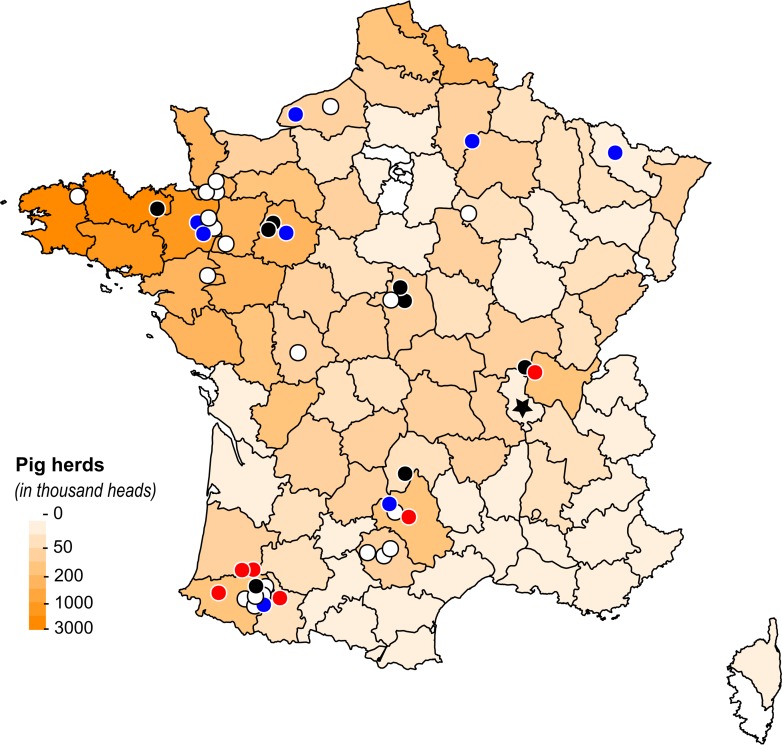
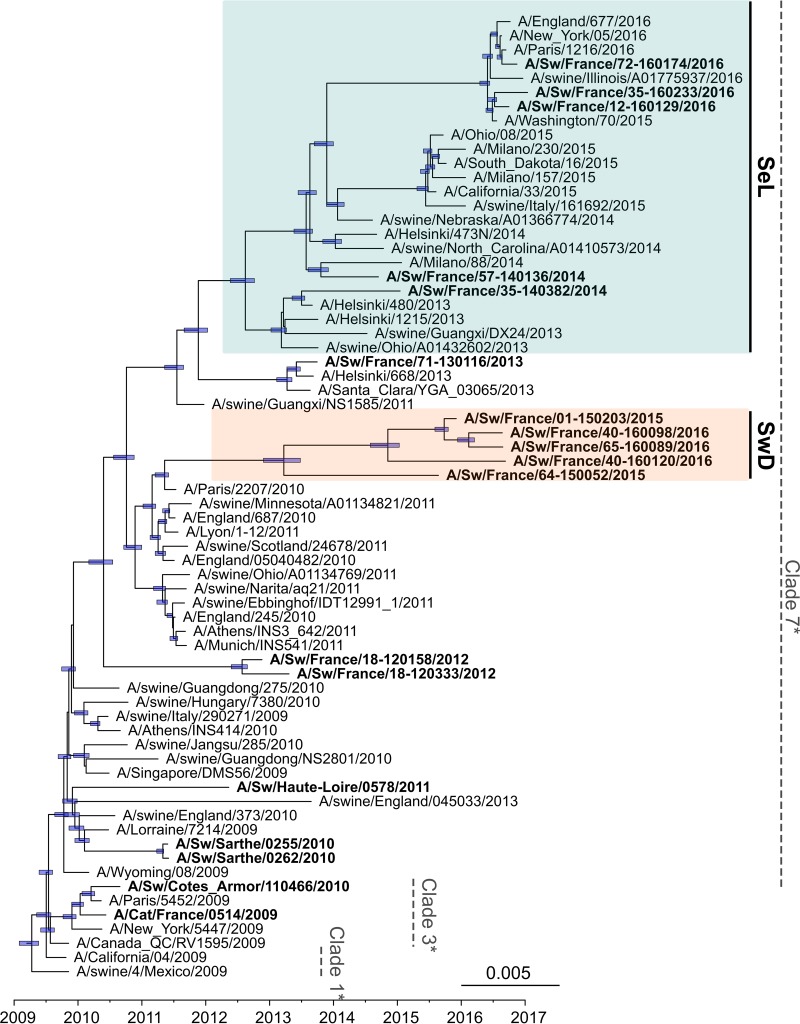
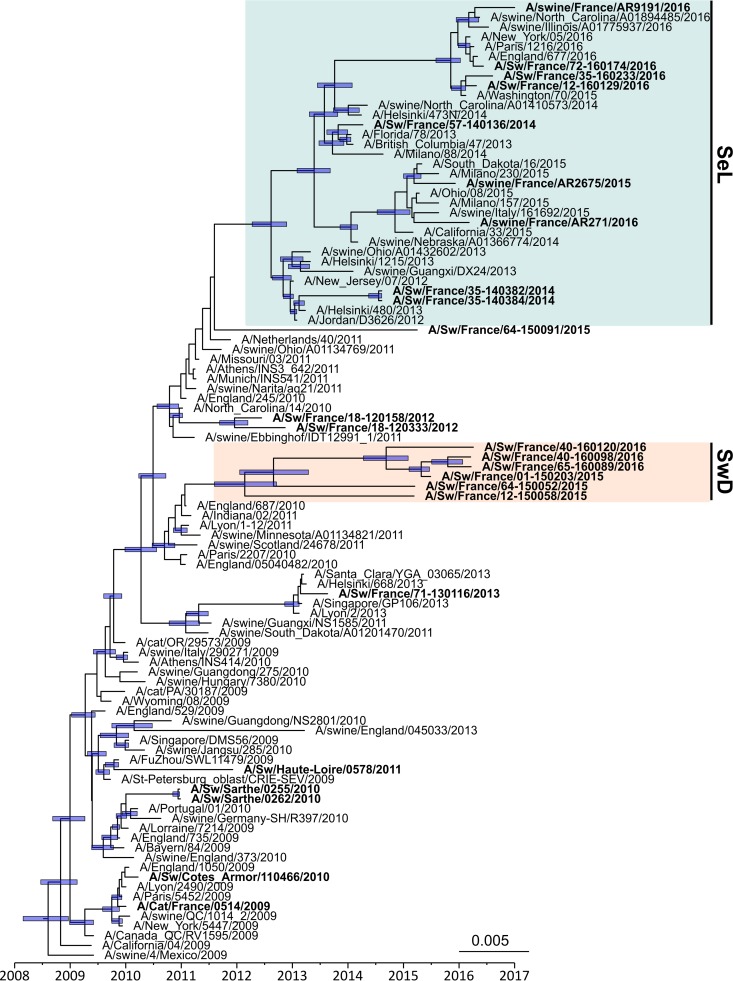
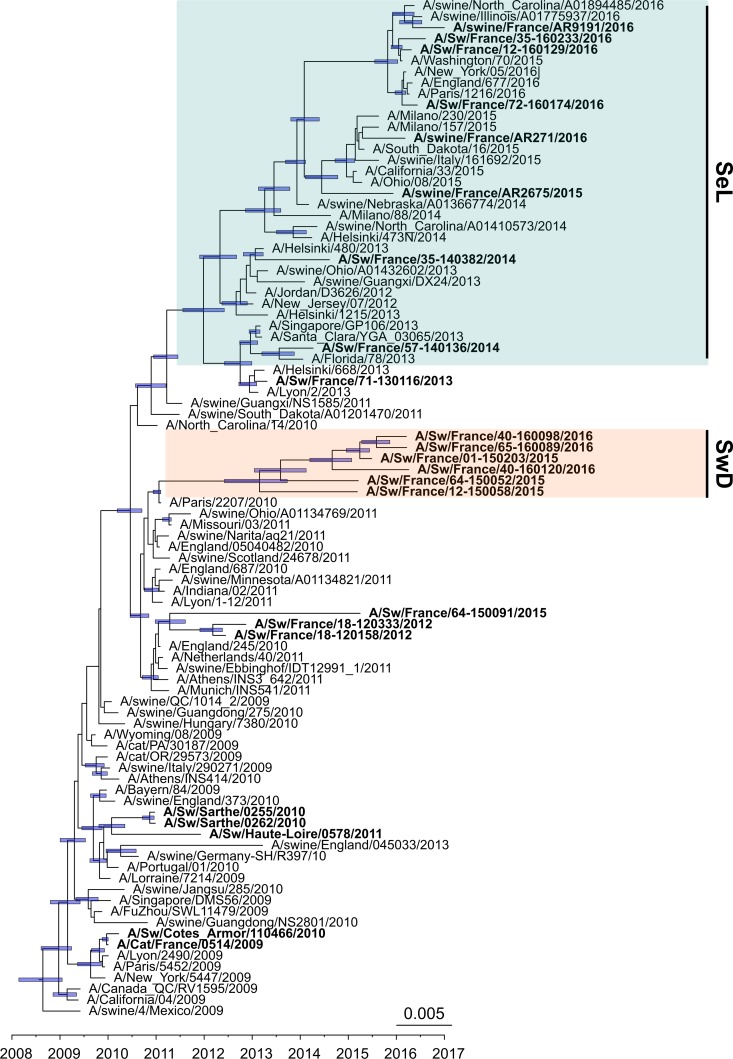
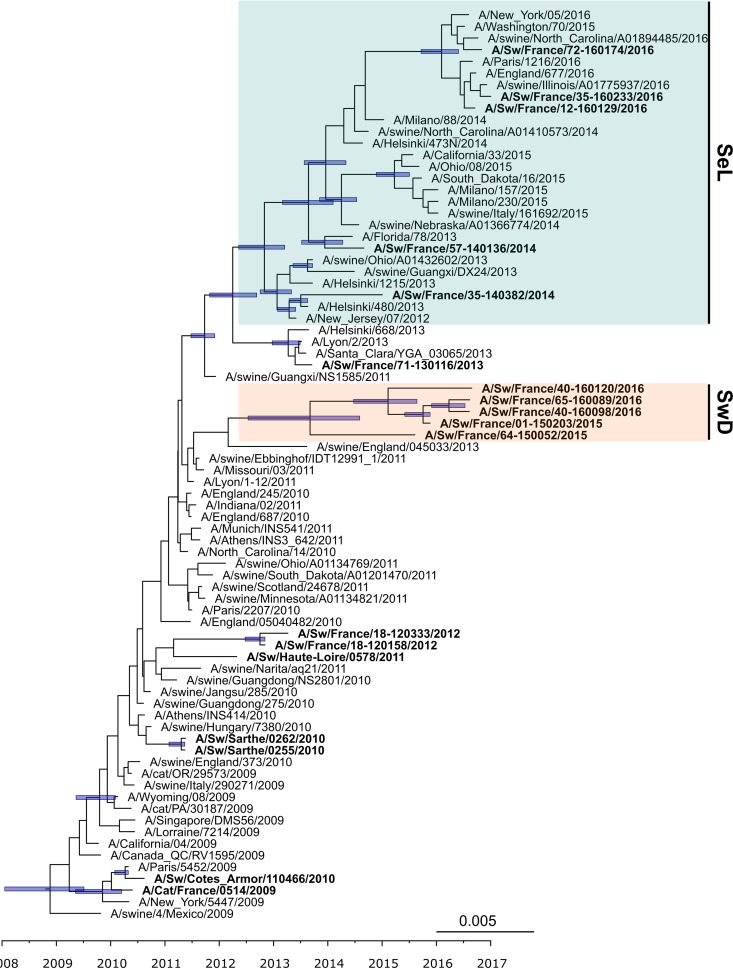
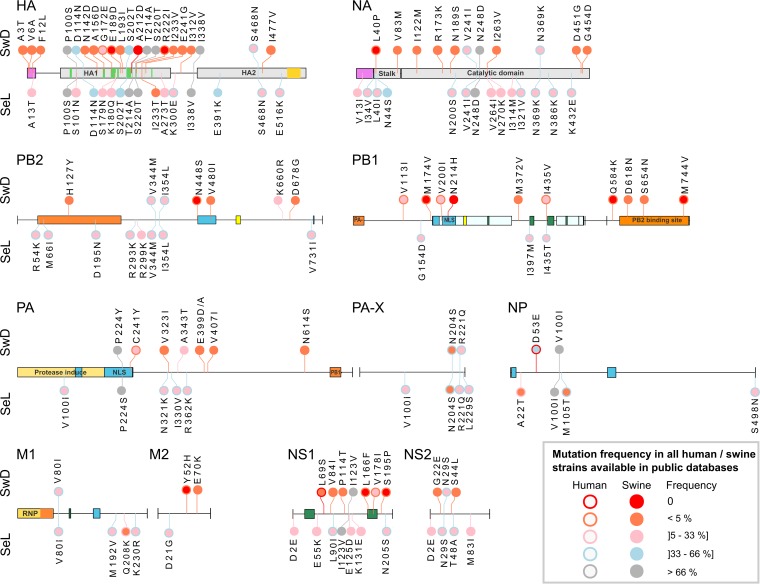
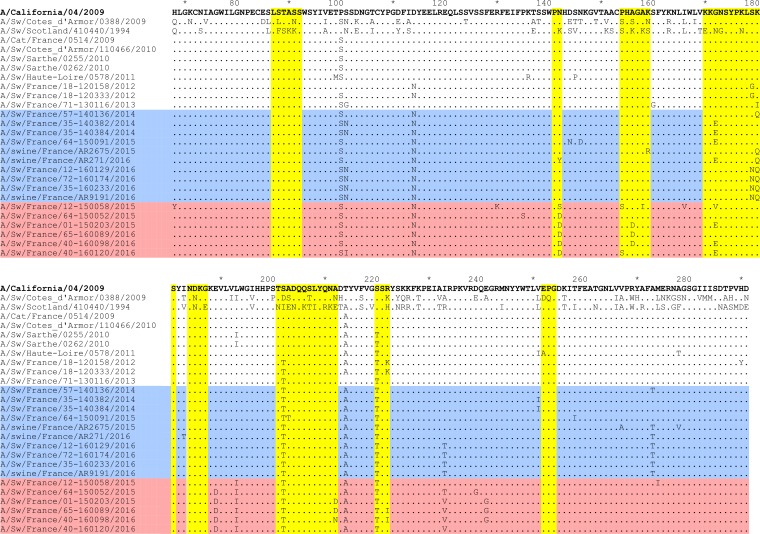
The H1N1 influenza virus responsible for the most recent pandemic in 2009 (H1N1pdm) has spread to swine populations worldwide while it replaced the previous seasonal H1N1 virus in humans. In France, surveillance of swine influenza A viruses in pig herds with respiratory outbreaks led to the detection of 44 H1N1pdm strains between 2009 and 2017, regardless of the season, and findings were not correlated with pig density. From these isolates, 17 whole-genome sequences were obtained, as were 6 additional hemagglutinin (HA)/neuraminidase (NA) sequences, in order to perform spatial and temporal analyses of genetic diversity and to compare evolutionary patterns of H1N1pdm in pigs to patterns for human strains. Following mutation accumulation and fixation over time, phylogenetic analyses revealed for the first time the divergence of a swine-specific genogroup within the H1N1pdm lineage. The divergence is thought to have occurred around 2011, although this was demonstrated only through strains isolated in 2015 to 2016 in the southern half of France. To date, these H1N1pdm swine strains have not been related to any increased virulence in swine herds and have not exhibited any antigenic drift compared to seasonal human strains. However, further monitoring is encouraged, as diverging evolutionary patterns in these two species, i.e., swine and humans, may lead to the emergence of viruses with a potentially higher risk to both animal and human health.IMPORTANCE Pigs are a "mixing vessel" for influenza A viruses (IAVs) because of their ability to be infected by avian and human IAVs and their propensity to facilitate viral genomic reassortment events. Also, as IAVs may evolve differently in swine and humans, pigs can become a reservoir for old human strains against which the human population has become immunologically naive. Thus, viruses from the novel swine-specific H1N1pdm genogroup may continue to diverge from seasonal H1N1pdm strains and/or from other H1N1pdm viruses infecting pigs and lead to the emergence of viruses that would not be covered by human vaccines and/or swine vaccines based on antigens closely related to the original H1N1pdm virus. This discovery confirms the importance of encouraging swine IAV monitoring because H1N1pdm swine viruses could carry an increased risk to both human and swine health in the future as a whole H1N1pdm virus or gene provider in subsequent reassortant viruses.

Keywords: antigenic drift; cat; genetic diversity; influenza A virus; molecular epidemiology; orthomyxoviridae; pandemic; pig; regional pattern; zoonotic infections.


Figures

FIG 1
FIG 1
Temporal distribution of swine H1N1pdm in France. The H1N1pdm viruses detected in pigs in France are individually represented by triangles positioned on the time x axis (graduated monthly from April 2009 to January 2018). The first H1N1pdm virus isolated from a mammalian animal in France, i.e., a cat, is represented by a black star. The lines represent the weekly numbers (y axis) of influenza A viruses (dotted line) and H1N1pdm viruses (black full line) detected in humans in France during this period. Human data were extracted from the World Health Organization (WHO)/Global Influenza Surveillance and Response System (GISRS) database (www.who.int/flunet).
FIG 2
FIG 2
Distribution of H1N1pdm viruses detected in pigs in France from November 2009 to 2017. The map was colored in an orange gradient according to the size of the pig population in each administrative department, based on data provided by the National Agricultural Census (56). The first mammalian animal H1N1pdm strain isolated in France, i.e., the cat strain, is indicated by a black star. Each circle represents an H1N1pdm virus strain detected in swine. Blue circles are isolates belonging to the seasonal-like (SeL) group, red circles are isolates belonging to the swine divergent (SwD) group, black circles are isolates belonging to neither the SeL group nor the SwD group, and white circles are isolates that were not sequenced. The SeL and SwD genogroups were defined in this study. The map was drawn using R 3.4.0 software (https://CRAN.R-project.org/package=maps).
FIG 3
FIG 3
Bayesian inference tree of H1N1pdm virus strains from whole-genome sequences. Strains isolated from pigs (and a cat) in France are indicated in boldface type. Nodes supported by more than 50% of sampled trees are indicated by a blue bar displaying the 95% highest posterior density (HPD) intervals of the node heights. The SeL and SwD genogroups were defined in this study. *, clades 1, 3, and 7 correspond to the classification of Nelson et al. (33).
FIG 4
FIG 4
Bayesian inference tree of the HA segment of H1N1pdm virus strains. Strains isolated from pigs (and a cat) in France are indicated in boldface type. Nodes supported by more than 50% of sampled trees are indicated by a blue bar displaying the 95% HPD intervals of the node heights. The SeL and SwD genogroups were defined in this study.
FIG 5
FIG 5
Bayesian inference tree of the NA segment of the H1N1pdm virus. Strains from French swine or cat are indicated in boldface type. Nodes supported by more than 50% of sampled trees are indicated by a blue bar displaying the 95% HPD intervals of the node heights. The SeL and SwD genogroups were defined in this study.
FIG 6
FIG 6
Bayesian inference tree of the M segment of the H1N1pdm virus. Strains from French swine or cat are indicated in boldface type. Nodes supported by more than 50% of sampled trees are indicated by a blue bar displaying the 95% HPD intervals of the node heights. The SeL and SwD genogroups were defined in this study.
FIG 7
FIG 7
Distribution and frequency of amino acid mutations in proteins from swine H1N1pdm strains belonging to the SeL and SwD genogroups, respectively. Each bullet represents a mutation in strains from the SeL group (below the line) or the SwD group (above the line), in comparison with the amino acid sequence of reference strain A/California/04/2009 (on the line). The bullet’s color represents the frequency level of a given residue among swine (color inside the bullet) and human (color outside the bullet) H1N1pdm haplotypes available in public databases. Known protein domains or important sites are represented by colored blocks on the reference line: the signal peptide (violet), the antigenic sites (green) inside the HA1 globular head, and the transmembrane domain (yellow) inside the HA2 part for HA; the signal anchor (violet) and the stalk and catalytic domains in NA; two NLSs (cyan) in NP; the PB1-binding site (orange), two NLSs (cyan), and the cap-binding site (yellow) in PB2; the PA-binding site (orange), two nucleotide-cross-linked regions, including two NLSs (cyan), the RNA-binding site (yellow), and four polymerase motifs (in green) (inside and between the regions), three cap-dependent RNase active sites (positions 508, 519, and 522), and the PB2-binding site (orange) in PB1; the protease-induced domain, including two NLSs (cyan), and the PB1-binding site (orange) in PA; the ribonucleoprotein (RNP) (gold), including the membrane-binding site (orange), an RNA-binding site (green), and an NLS (cyan), in M1; and two secondary RNA structures (green) in NS1.
FIG 8
FIG 8
Distribution of amino acid mutations in the HA1 domain of swine H1N1pdm strains isolated in France compared to reference strain A/California/04/2009. H1N1pdm strains from the SeL group are highlighted in blue, and those from the SwD group are highlighted in pink. The SeL and SwD genogroups were defined in this study. Strain A/Cat/France/0514/2009 was included as it was the first H1N1pdm strain isolated in a mammalian animal in France. Strains A/Sw/Cotes d’Armor/0388/2009 (H1avN1) and A/Sw/Scotland/410440/1994 (H1huN2) were included as reference strains from other genetic lineages within the swine H1 subtype. The antigenic sites Ca1, Ca2, Cb, Sa, and Sb (57) are marked in yellow.
FIG 9
FIG 9
Antigenic map of French swine H1N1pdm from HI data. The relative positions of antisera (black shapes) and strains (colored shapes) correspond to the adjusted distance of the HI measurement with the least error calculated by ACMACS. The size of the shape represents the confidence area in the position (0.5-U increase in total error). Black shapes represent antisera directed against strains A/California/04/2009 (CALIF04), A/Sw/Sarthe/0255/2010 (SARTHE), and A/Sw/Cotes d’Armor/0388/2009 (H1avN1). Shapes representing swine virus strains are colored as follows: blue for H1N1pdm strains from the SeL group, red for H1N1pdm strains from the SwD group, green for other H1N1pdm strains from clade 7, yellow for H1N1pdm strains from clade 3, and gray for the H1avN1 reference strain. The SeL and SwD genogroups were defined in this study. Correspondences between numbers and strain names are given in Table 5.
FIG 10
FIG 10
RNA secondary structures predicted in two regions of the NS segment suspected to be lineage-specific regions. Only strains showing nucleotide substitutions compared to reference strain A/California/04/2009 are presented. Strains A/Sw/France/12-160129/2016 and A/Sw/France/01-150203/2015 were used to represent the predicted RNA secondary structures of strains belonging to the SeL and SwD genogroups, respectively. Nucleotide substitutions are indicated by blue arrows.

Similar articles

Cited by

References

    1. Palese P, Shaw ML. 2007. Orthomyxoviridae: the viruses and their replication, p 1647–1689. In Knipe DM, Howley PM, Griffin DE, Lamb RA, Martin MA, Roizman B, Straus SE (ed), Fields virology, 5th ed, vol 2 Lippincott Williams & Wilkins, Philadelphia, PA.
    1. Tong S, Zhu X, Li Y, Shi M, Zhang J, Bourgeois M, Yang H, Chen X, Recuenco S, Gomez J, Chen LM, Johnson A, Tao Y, Dreyfus C, Yu W, McBride R, Carney PJ, Gilbert AT, Chang J, Guo Z, Davis CT, Paulson JC, Stevens J, Rupprecht CE, Holmes EC, Wilson IA, Donis RO. 2013. New world bats harbor diverse influenza A viruses. PLoS Pathog 9:e1003657. - PMC - PubMed
    1. Centers for Disease Control and Prevention, NCIRD. 2017. Influenza type A viruses. Centers for Disease Control and Prevention, Atlanta, GA: https://www.cdc.gov/flu/avianflu/influenza-a-virus-subtypes.htm.
    1. Schrauwen EJ, Fouchier RA. 2014. Host adaptation and transmission of influenza A viruses in mammals. Emerg Microbes Infect 3:e9. doi:10.1038/emi.2014.9. - DOI - PMC - PubMed
    1. Taubenberger JK, Kash JC. 2010. Influenza virus evolution, host adaptation and pandemic formation. Cell Host Microbe 7:440–451. doi:10.1016/j.chom.2010.05.009. - DOI - PMC - PubMed

Publication types

MeSH terms

LinkOut - more resources