

Distribution patterns and variation analysis of simple sequence repeats in different genomic regions of bovid genomes
- PMID: 30258087
- PMCID: PMC6158176
- DOI: 10.1038/s41598-018-32286-5
Distribution patterns and variation analysis of simple sequence repeats in different genomic regions of bovid genomes
Abstract
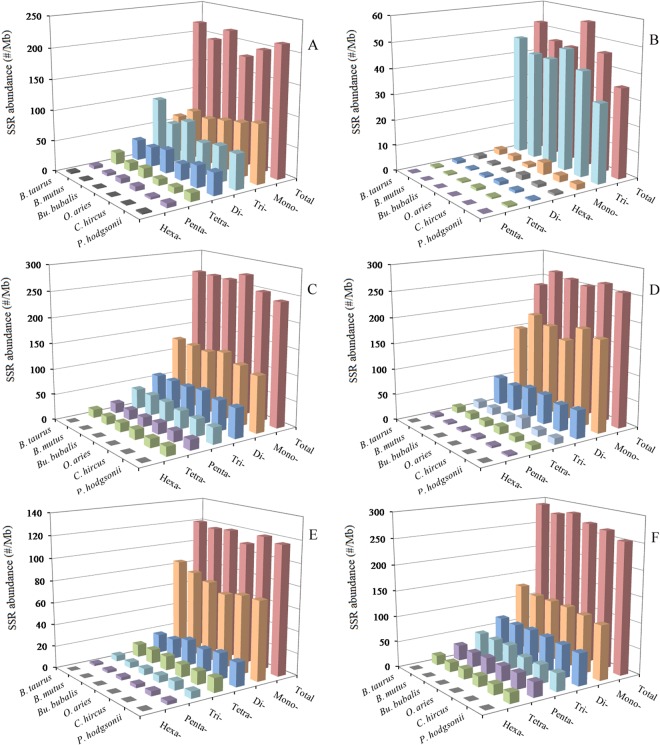
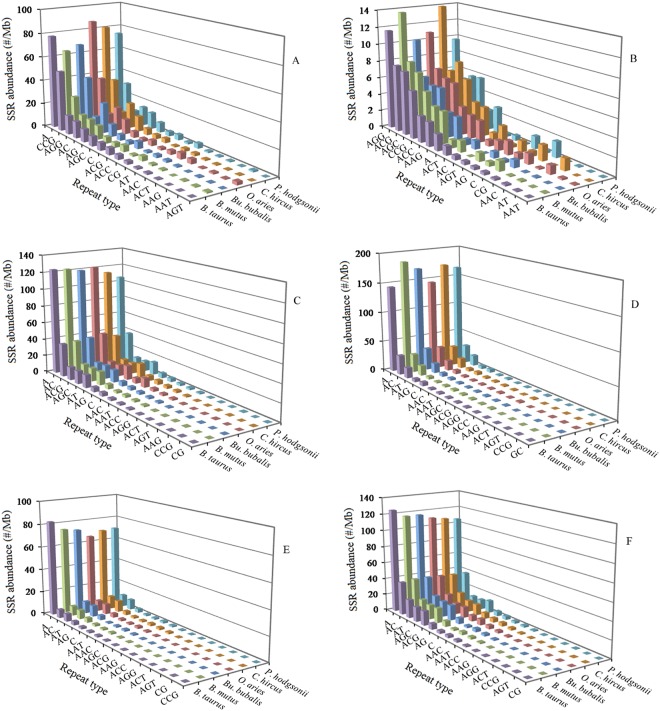
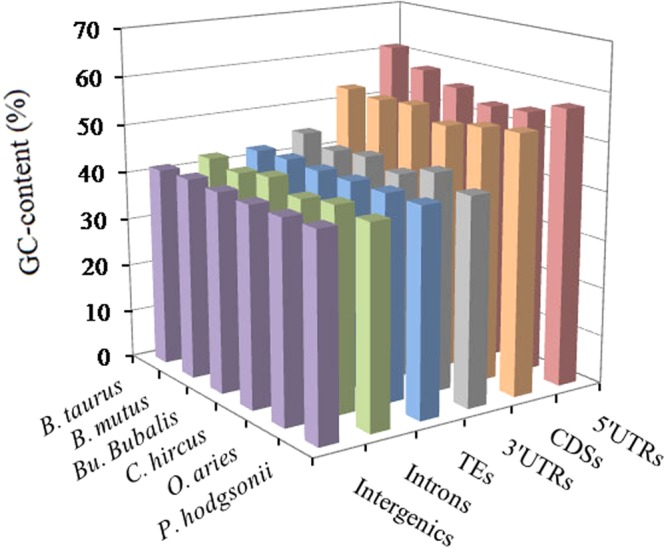
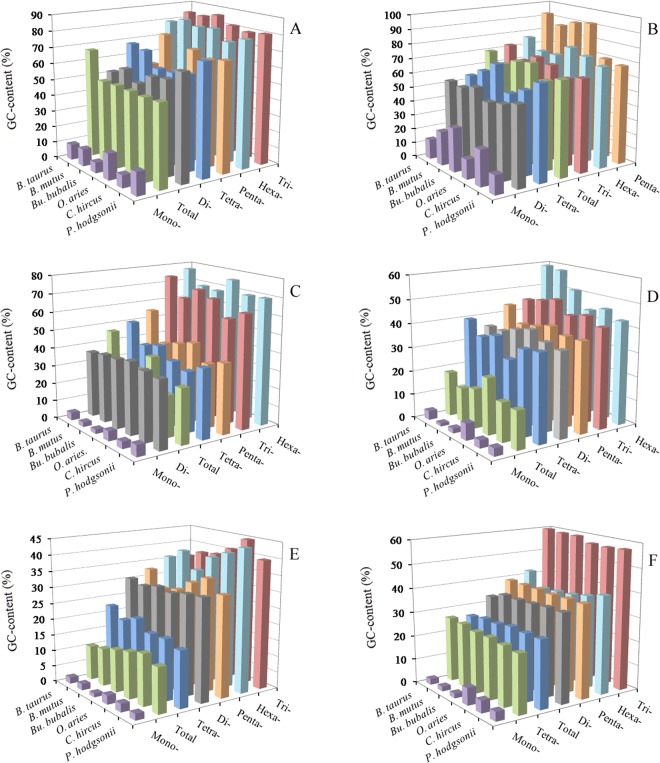
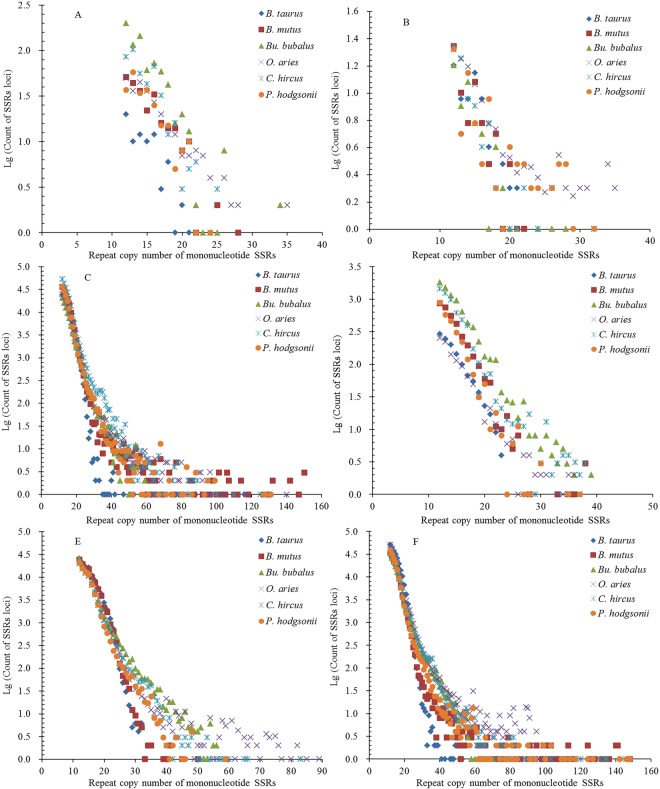
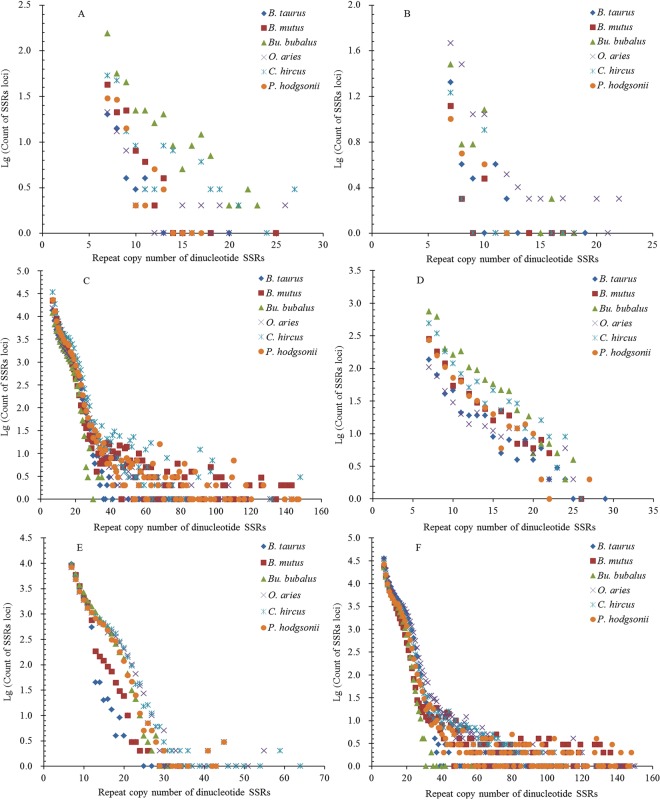
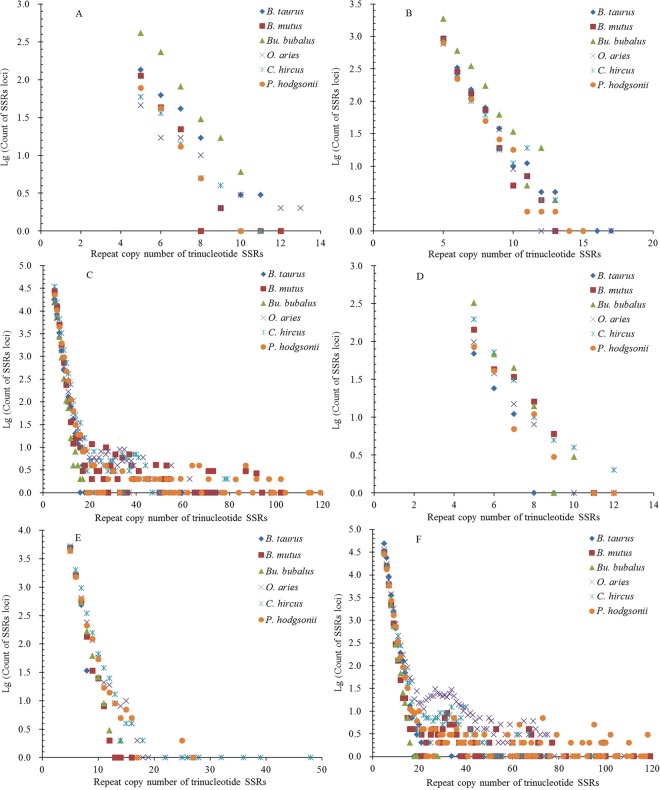
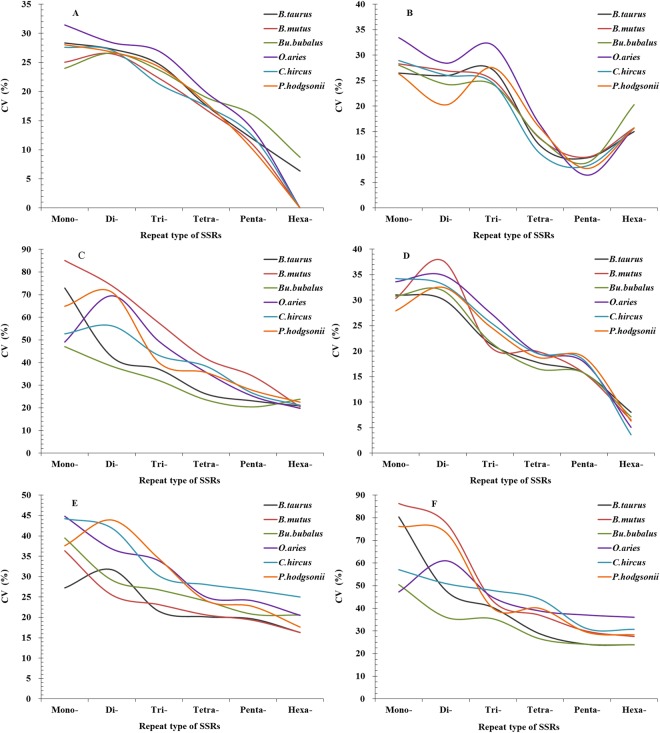
As the first examination of distribution, guanine-cytosine (GC) pattern, and variation analysis of microsatellites (SSRs) in different genomic regions of six bovid species, SSRs displayed nonrandomly distribution in different regions. SSR abundances are much higher in the introns, transposable elements (TEs), and intergenic regions compared to the 3'-untranslated regions (3'UTRs), 5'UTRs and coding regions. Trinucleotide perfect SSRs (P-SSRs) were the most frequent in the coding regions, whereas, mononucleotide P-SSRs were the most in the introns, 3'UTRs, TEs, and intergenic regions. Trifold P-SSRs had more GC-contents in the 5'UTRs and coding regions than that in the introns, 3'UTRs, TEs, and intergenic regions, whereas mononucleotide P-SSRs had the least GC-contents in all genomic regions. The repeat copy numbers (RCN) of the same mono- to hexanucleotide P-SSRs showed significantly different distributions in different regions (P < 0.01). Except for the coding regions, mononucleotide P-SSRs had the most RCNs, followed by the pattern: di- > tri- > tetra- > penta- > hexanucleotide P-SSRs in the same regions. The analysis of coefficient of variability (CV) of SSRs showed that the CV variations of RCN of the same mono- to hexanucleotide SSRs were relative higher in the intronic and intergenic regions, followed by the CV variation of RCN in the TEs, and the relative lower was in the 5'UTRs, 3'UTRs, and coding regions. Wide SSR analysis of different genomic regions has helped to reveal biological significances of their distributions.
Conflict of interest statement
The authors declare no competing interests.
Figures
Similar articles
-
Distribution patterns of microsatellites and development of its marker in different genomic regions of forest musk deer genome based on high throughput sequencing.Aging (Albany NY). 2020 Mar 10;12(5):4445-4462. doi: 10.18632/aging.102895. Epub 2020 Mar 10. Aging (Albany NY). 2020. PMID: 32155132 Free PMC article.
-
Distinct patterns of simple sequence repeats and GC distribution in intragenic and intergenic regions of primate genomes.Aging (Albany NY). 2016 Sep 16;8(11):2635-2654. doi: 10.18632/aging.101025. Aging (Albany NY). 2016. PMID: 27644032 Free PMC article.
-
Genome-Wide Survey and Analysis of Microsatellite Sequences in Bovid Species.PLoS One. 2015 Jul 21;10(7):e0133667. doi: 10.1371/journal.pone.0133667. eCollection 2015. PLoS One. 2015. PMID: 26196922 Free PMC article.
-
Comparison of microsatellite distribution patterns in twenty-nine beetle genomes.Gene. 2020 Oct 5;757:144919. doi: 10.1016/j.gene.2020.144919. Epub 2020 Jun 27. Gene. 2020. PMID: 32603771
-
Microsatellites within genes: structure, function, and evolution.Mol Biol Evol. 2004 Jun;21(6):991-1007. doi: 10.1093/molbev/msh073. Epub 2004 Feb 12. Mol Biol Evol. 2004. PMID: 14963101 Review.
Cited by
-
Comprehensive Comparative Analysis Sheds Light on the Patterns of Microsatellite Distribution across Birds Based on the Chromosome-Level Genomes.Animals (Basel). 2023 Feb 13;13(4):655. doi: 10.3390/ani13040655. Animals (Basel). 2023. PMID: 36830442 Free PMC article.
-
MicrosatNavigator: exploring nonrandom distribution and lineage-specificity of microsatellite repeat motifs on vertebrate sex chromosomes across 186 whole genomes.Chromosome Res. 2023 Sep 30;31(4):29. doi: 10.1007/s10577-023-09738-4. Chromosome Res. 2023. PMID: 37775555
-
The first complete chloroplast genome of Thalictrum fargesii: insights into phylogeny and species identification.Front Plant Sci. 2024 Apr 29;15:1356912. doi: 10.3389/fpls.2024.1356912. eCollection 2024. Front Plant Sci. 2024. PMID: 38745930 Free PMC article.
-
Comprehensive analysis of complete chloroplast genome and phylogenetic aspects of ten Ficus species.BMC Plant Biol. 2022 May 23;22(1):253. doi: 10.1186/s12870-022-03643-4. BMC Plant Biol. 2022. PMID: 35606691 Free PMC article.
-
Genome skimming-based simple sequence repeat (SSR) marker discovery and characterization in Grevillea robusta.Physiol Mol Biol Plants. 2021 Jul;27(7):1623-1638. doi: 10.1007/s12298-021-01035-w. Epub 2021 Jul 17. Physiol Mol Biol Plants. 2021. PMID: 34305342 Free PMC article.
References
Publication types
MeSH terms
Substances
Grants and funding
LinkOut - more resources
Full Text Sources
Other Literature Sources
Research Materials
Miscellaneous
