

Modelling realistic microgels in an explicit solvent
- PMID: 30258102
- PMCID: PMC6158278
- DOI: 10.1038/s41598-018-32642-5
Modelling realistic microgels in an explicit solvent
Abstract
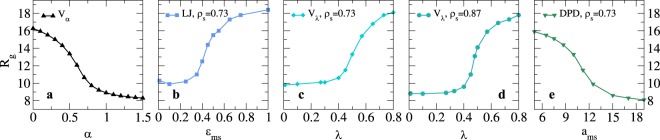
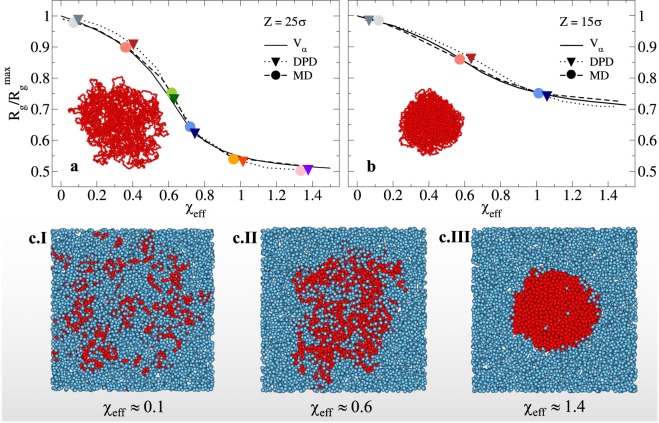
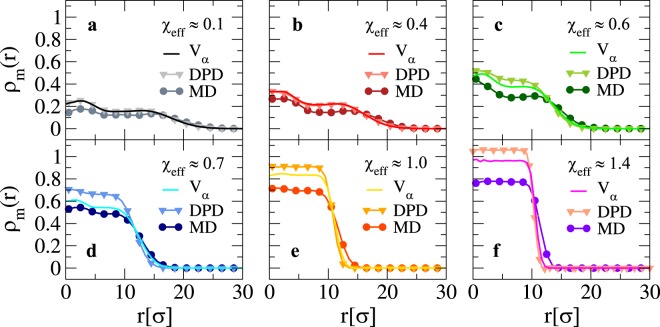
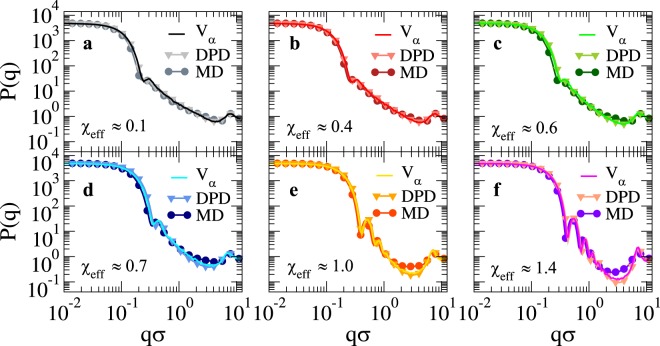
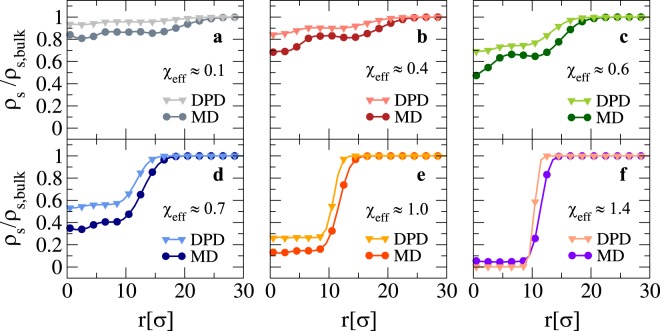
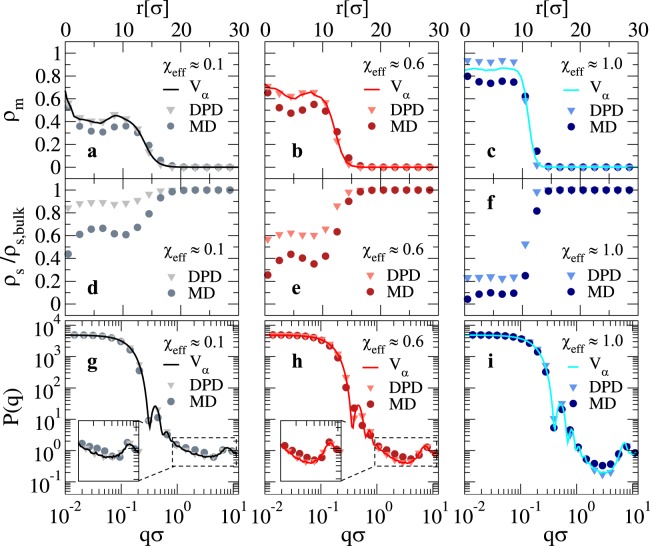
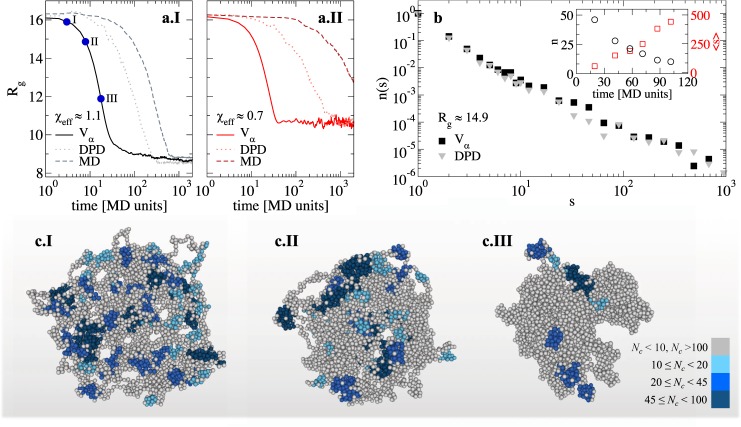
Thermoresponsive microgels are polymeric colloidal networks that can change their size in response to a temperature variation. This peculiar feature is driven by the nature of the solvent-polymer interactions, which triggers the so-called volume phase transition from a swollen to a collapsed state above a characteristic temperature. Recently, an advanced modelling protocol to assemble realistic, disordered microgels has been shown to reproduce experimental swelling behavior and form factors. In the original framework, the solvent was taken into account in an implicit way, condensing solvent-polymer interactions in an effective attraction between monomers. To go one step further, in this work we perform simulations of realistic microgels in an explicit solvent. We identify a suitable model which fully captures the main features of the implicit model and further provides information on the solvent uptake by the interior of the microgel network and on its role in the collapse kinetics. These results pave the way for addressing problems where solvent effects are dominant, such as the case of microgels at liquid-liquid interfaces.
Conflict of interest statement
The authors declare no competing interests.
Figures
Similar articles
-
Numerical insights on ionic microgels: structure and swelling behaviour.Soft Matter. 2019 Oct 28;15(40):8113-8128. doi: 10.1039/c9sm01253b. Epub 2019 Oct 7. Soft Matter. 2019. PMID: 31589214
-
Interface-induced hysteretic volume phase transition of microgels: simulation and experiment.Soft Matter. 2021 Jun 9;17(22):5581-5589. doi: 10.1039/d1sm00111f. Soft Matter. 2021. PMID: 33988219
-
Functional Microgels and Microgel Systems.Acc Chem Res. 2017 Feb 21;50(2):131-140. doi: 10.1021/acs.accounts.6b00544. Epub 2017 Feb 10. Acc Chem Res. 2017. PMID: 28186408
-
3D Printable Poly(N-isopropylacrylamide) Microgel Suspensions with Temperature-Dependent Rheological Responses.ACS Appl Polym Mater. 2024 Mar 21;6(23):14095-14105. doi: 10.1021/acsapm.3c03230. eCollection 2024 Dec 13. ACS Appl Polym Mater. 2024. PMID: 39697841 Free PMC article. Review.
-
Soft Colloidal Particles at Fluid Interfaces.Polymers (Basel). 2022 Mar 11;14(6):1133. doi: 10.3390/polym14061133. Polymers (Basel). 2022. PMID: 35335463 Free PMC article. Review.
Cited by
-
Linking Structure and Optical Properties of Plasmonic Nanoparticles on Tunable Spherical Surfaces.ACS Appl Mater Interfaces. 2025 Aug 20;17(33):47385-47395. doi: 10.1021/acsami.5c11151. Epub 2025 Aug 11. ACS Appl Mater Interfaces. 2025. PMID: 40789125 Free PMC article.
-
Coarsening Kinetics of Complex Macromolecular Architectures in Bad Solvent.Polymers (Basel). 2020 Mar 2;12(3):531. doi: 10.3390/polym12030531. Polymers (Basel). 2020. PMID: 32121665 Free PMC article.
-
In-situ study of the impact of temperature and architecture on the interfacial structure of microgels.Nat Commun. 2022 Jun 29;13(1):3744. doi: 10.1038/s41467-022-31209-3. Nat Commun. 2022. PMID: 35768399 Free PMC article.
-
Numerical modelling of non-ionic microgels: an overview.Soft Matter. 2019 Feb 6;15(6):1108-1119. doi: 10.1039/c8sm02089b. Soft Matter. 2019. PMID: 30543246 Free PMC article. Review.
References
-
- Fernandez-Nieves, A., Wyss, H., Mattsson, J. & Weitz, D. A. Microgel suspensions: fundamentals and applications (John Wiley & Sons, 2011).
Publication types
Grants and funding
LinkOut - more resources
Full Text Sources
Other Literature Sources
