. 2018 Sep 26;9(1):3942.
doi: 10.1038/s41467-018-06310-1.

The MinDE system is a generic spatial cue for membrane protein distribution in vitro

Affiliations

The MinDE system is a generic spatial cue for membrane protein distribution in vitro

Beatrice Ramm et al. Nat Commun. .

Abstract

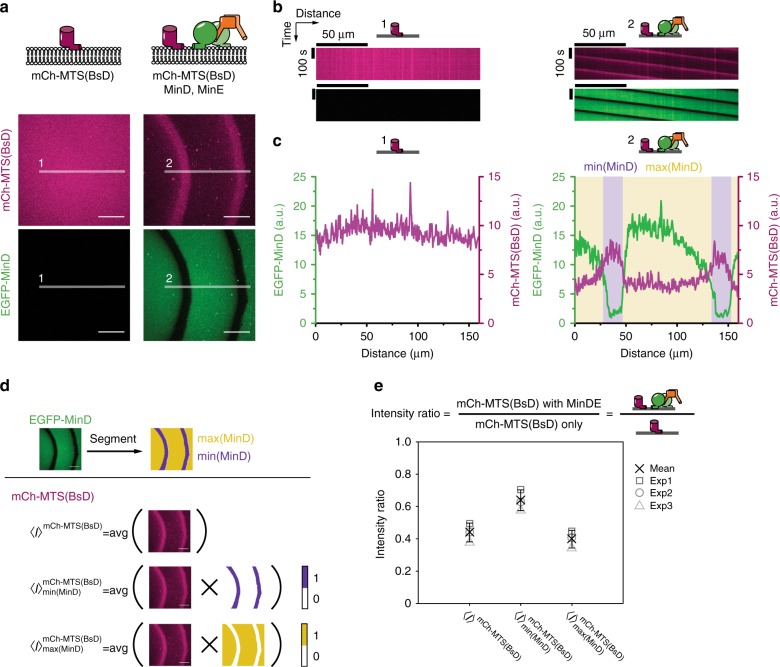
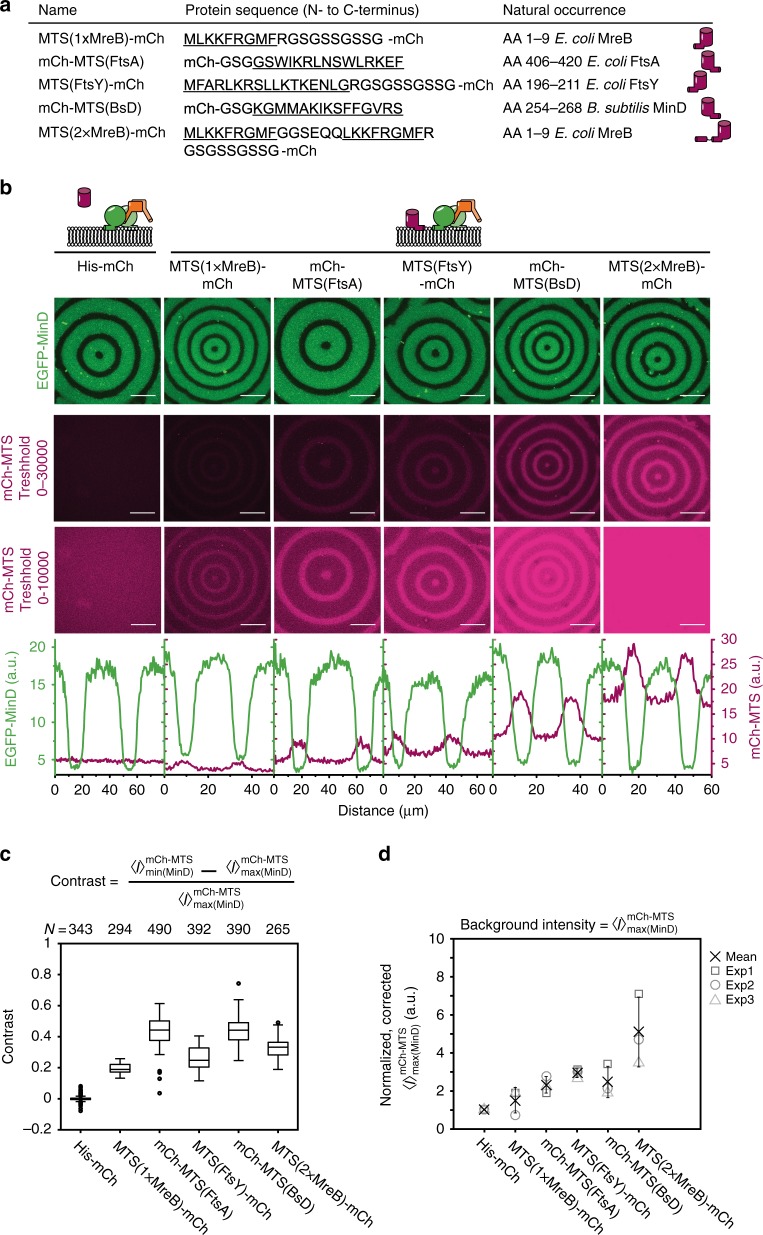
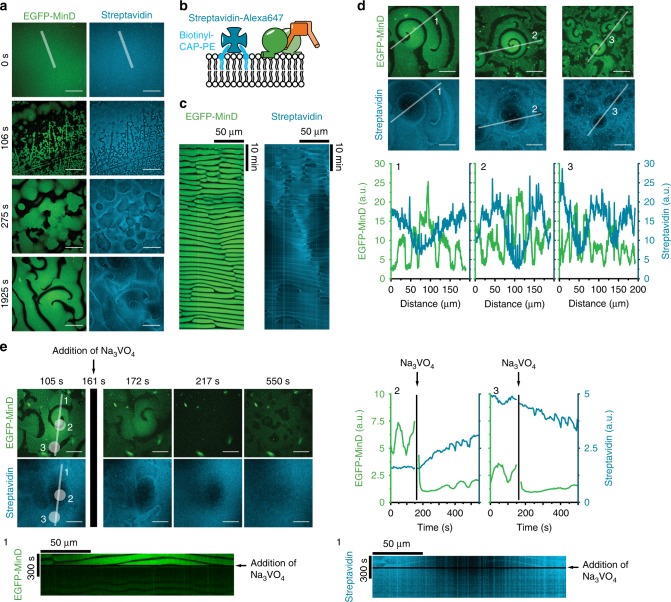
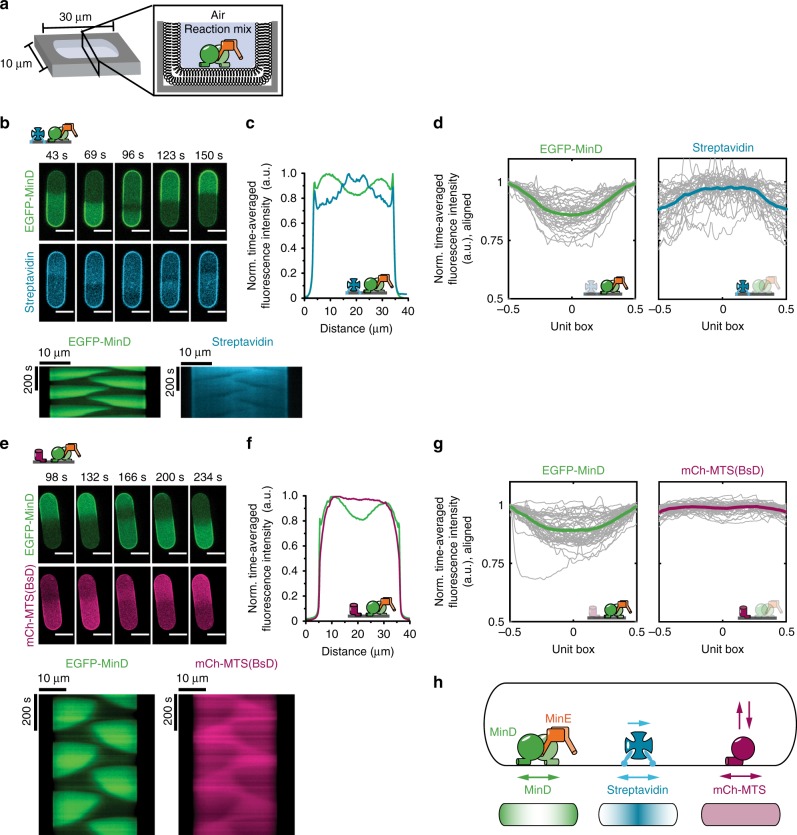
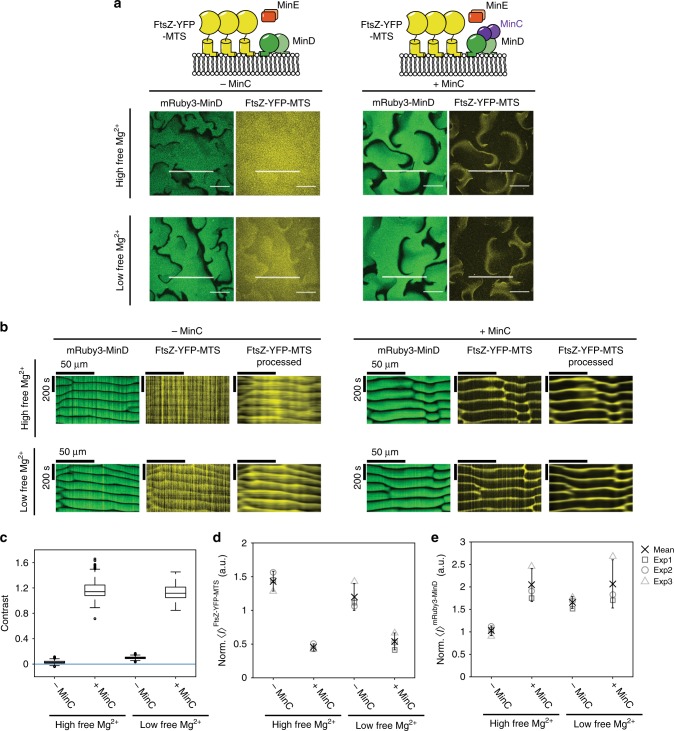
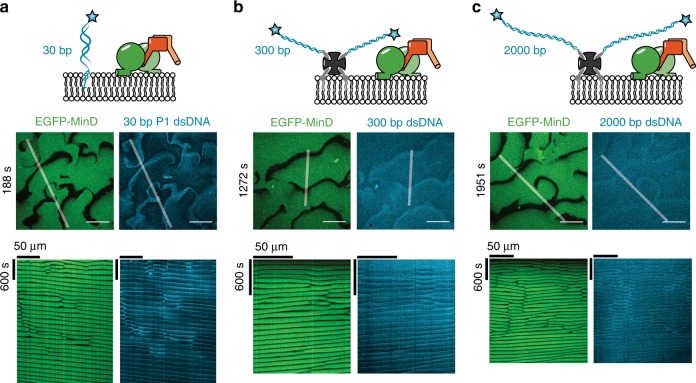
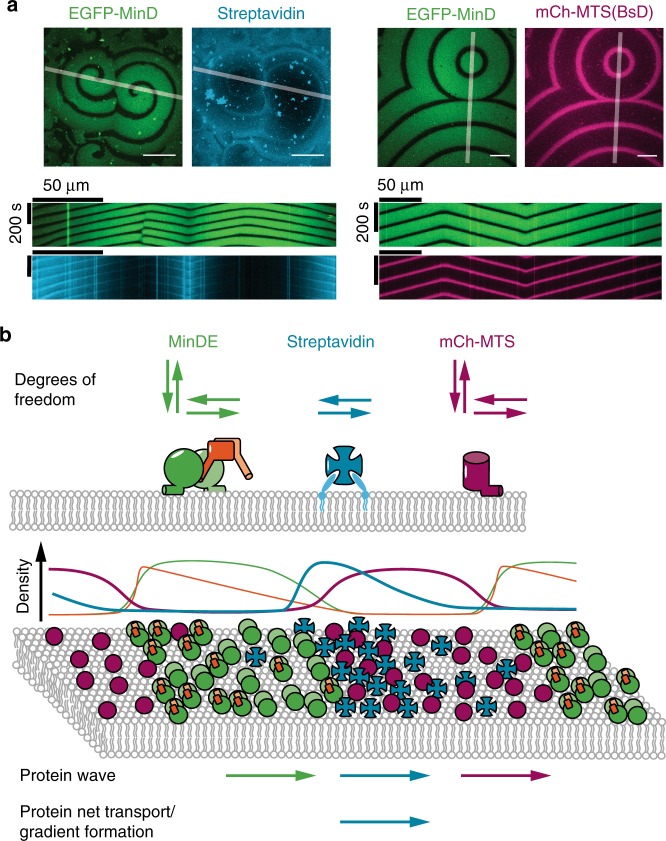
The E. coli MinCDE system has become a paradigmatic reaction-diffusion system in biology. The membrane-bound ATPase MinD and ATPase-activating protein MinE oscillate between the cell poles followed by MinC, thus positioning the main division protein FtsZ at midcell. Here we report that these energy-consuming MinDE oscillations may play a role beyond constraining MinC/FtsZ localization. Using an in vitro reconstitution assay, we show that MinDE self-organization can spatially regulate a variety of functionally completely unrelated membrane proteins into patterns and gradients. By concentration waves sweeping over the membrane, they induce a direct net transport of tightly membrane-attached molecules. That the MinDE system can spatiotemporally control a much larger set of proteins than previously known, may constitute a MinC-independent pathway to division site selection and chromosome segregation. Moreover, the here described phenomenon of active transport through a traveling diffusion barrier may point to a general mechanism of spatiotemporal regulation in cells.


Conflict of interest statement

The authors declare no competing interests.

Figures

Fig. 1
Fig. 1
MinDE can spatiotemporally regulate a model peripheral membrane protein. a mCh-MTS(BsD), mCherry fusion to the C-terminal amphipathic helix of B. subtilis MinD, homogenously covers SLBs in the absence of MinDE (1 µM mCh-MTS(BsD)). In the presence of MinDE and ATP mCh-MTS(BsD) forms traveling surface waves that are anticorrelated to the MinDE wave (1 µM mCh-MTS(BsD), 1 µM MinD (30% EGFP-MinD), 1 µM MinE). Scale bars: 50 µm. b Kymographs of the line selections shown in a. Scale bars: 50 µm and 100 s. c Intensity profiles of the line selections shown in a. mCh-MTS(BsD) fluorescence (magenta) on the SLBs in the presence of MinDE is reduced and shows clear maxima in the minima of the MinDE waves (min(MinD)) and clear minima in the MinDE wave maxima (max(MinD)). d Schematic of the analysis process. EGFP-MinD images are segmented to generate two binary masks that are subsequently multiplied with mCh-MTS(BsD) images to obtain average intensities for the full image and in the minimum and maximum of the MinDE wave. e Intensity ratio of the average fluorescence of mCh-MTS(BsD) in the presence over in the absence of MinDE. Intensity ratios are shown for the average intensity of the full image (ImCh-MTS(BsD)), in the MinDE minimum (IminMinDmCh-MTS(BsD)) and in the MinDE maximum (ImaxMinDmCh-MTS(BsD)). Each data point (exp 1–3) is generated from at least one time series consisting of 75 images in one sample chamber. Cross and error bars depict the mean values and standard deviations from three independent experiments
Fig. 2
Fig. 2
MinDE regulate a variety of peripheral membrane proteins to different extents. a Overview of the model peripheral membrane proteins employed. All amphipathic helices were fused to mCherry at their endogenous terminus. b Representative images of the MinDE wave (upper panel) and the anticorrelated mCh-MTS wave with two different brightness settings (middle and lower panels) on the membrane (1 µM mCh-MTS, 1 µM MinD (30% EGFP-MinD), 1 µM MinE). All images in one row were acquired and displayed using the same instrumental settings. Fluorescence intensity line plots of the corresponding images (EGFP-MinD fluorescence in green, mCh-MTS fluorescence in magenta) show the difference in the extent of the spatial regulation (lowest panel). c mCh-MTS constructs with a C-terminal amphipathic helix exhibit highest contrast. Box plot of the contrast of mCh-MTS constructs, lines are median, box limits are quartiles 1 and 3, whiskers are 1.5× interquartile range (IQR) and points are outliers. d mCh-MTS intensity in the MinDE maximum (ImaxMinDmCh-MTS) normalized to His-mCh and corrected for the fluorescent protein fraction. Each data point (square, sphere, triangle) corresponds to one independent experiment (exp 1–3) and was generated from at least one tile scan (7 by 7) in one sample chamber (number of images NHis-mCh = 343, NMTS(1×MreB)-mCh = 294, NmCh-MTS(FtsA) = 490, NMTS(FtsY)-mCh = 392, NmCh-MTS(BsD) = 390, NMTS(2×MreB)-mCh = 265). Cross and error bars represent the mean value and standard deviation of the three independent experiments. Scale bars: 50 µm
Fig. 3
Fig. 3
MinDE spatiotemporally position a lipid-anchored protein resulting in large-scale concentration gradients. a MinDE self-organization spatiotemporally regulates lipid-anchored streptavidin. Representative time series of MinDE self-organization on a SLB with Biotinyl-CAP-PE-bound streptavidin (1 µM MinD, 1 µM MinE, streptavidin-Alexa647). ATP is added at t = 0 s to start self-organization. Scale bars: 50 µm. b Schematic of the experimental setup. Tetrameric streptavidin is anchored to the SLB by binding two to three Biotinyl-CAP-PE lipids and MinDE and ATP are added. c Kymograph of the line selections shown in a. Scale bars: 50 µm and 10 min. d MinDE self-organization leads to large-scale concentration gradients of streptavidin. Representative images of streptavidin distribution in MinDE spirals after >1 h of MinDE self-organization on SLBs. Fluorescence intensity line plots of EGFP-MinD and streptavidin distribution of selections shown in the respective images. Scale bars: 50 µm. e Large-scale streptavidin gradient formation by MinDE is reversible. Representative images and kymograph (1) of a running MinDE assay in the presence of anchored streptavidin. Addition of sodium orthovanadate (Na3VO4) leads to MinDE detachment which in turn leads to homogenization of streptavidin fluorescence on the membrane. Fluorescence intensity of streptavidin (cyan) and EGFP-MinD (green) is plotted over the duration of the time-lapse in the center (2) and at the rim of the MinDE spiral (3). Scale bars: 50 µm and 300 s. All experiments were performed independently three or more times under identical conditions
Fig. 4
Fig. 4
MinDE induce oscillatory and time-averaged concentration gradients of model membrane proteins in microcompartments. a Experimental setup: PDMS-microcompartments are lined with an SLB and covered by air to confine the proteins. b Representative time-lapse images and kymographs of MinDE oscillations and streptavidin counter-oscillations in the compartments (1 µM MinD, 2 µM MinE, streptavidin-Alexa647). Brightness of the streptavidin channel was corrected for bleaching using histogram matching in Fiji. Scale bars: 10 µm. c Time-averaged fluorescence intensity profiles of MinDE (green) and streptavidin (cyan) oscillation in b showing clear concentration gradients for both MinD and streptavidin. d Time-averaged fluorescence intensity profiles (gray lines) for EGFP-MinD and streptavidin aligned and projected to a unit box (see Supplementary Fig. 14 for details). Bold, colored lines represent the mean profiles, generated from three independent experiments with N= 35 microcompartments. e Representative time-lapse images and kymographs of MinDE oscillations and mCh-MTS(BsD) counter-oscillations in PDMS microcompartments (1 µM MinD (30% EGFP-MinD), 2 µM MinE, 0.5 µM mCh-MTS(BsD)). Scale bars: 10 µm. f Time-averaged fluorescence intensity profiles of MinDE (green) and mCh-MTS(BsD) (magenta) oscillations in e showing a clear protein gradient for MinD and homogenous protein distribution of mCh-MTS(BsD). g Time-averaged fluorescence intensity profiles (gray lines) for EGFP-MinD and mCh-MTS(BsD) aligned and projected to a unit box. Bold, colored lines represent the mean profiles, generated from three independent experiments with in total N = 45 microcompartments. h Schematic explaining how the MinDE system positions lipid-anchored streptavidin and mCh-MTS constructs in rod-shaped microcompartments. MinDE oscillations drive counter-oscillations of lipid-anchored streptavidin and mCh-MTS constructs, thereby establishing a time-averaged concentration gradient of lipid-anchored streptavidin with maximal concentration in the geometric center, but no concentration gradient of mCh-MTS
Fig. 5
Fig. 5
MinC enhances spatiotemporal regulation of FtsZ-YFP-MTS by MinDE. a Representative images of MinDE self-organization in the presence of FtsZ-YFP-MTS with high and low free Mg2+ (~5 and ~1 mM Mg2+) and with and without MinC (1 µM MinD (30 % EGFP-MinD), 1 µM MinE, 0.5 µM FtsZ-YFP-MTS, with and without 0.05 µM MinC) corresponding to the timepoint of 6.5 min. All images of the same spectral channel were acquired and displayed using the same instrumental settings. b Kymographs of the line selections shown in a. The kymograph for FtsZ-YFP-MTS is displayed for unprocessed images (middle panels) and preprocessed images (see Methods) (right panels). c MinC increases the regulation of FtsZ-YFP-MTS. Box plot of the contrast of FtsZ-YFP-MTS, lines are median, box limits are quartiles 1 and 3, whiskers are 1.5× IQR and points are outliers. Blue line marks no difference between the intensities in the minima and maxima of the MinDE wave (zero contrast). d Average FtsZ-YFP-MTS intensity of the full image normalized to a fluorescent standard. d Average mRuby3-MinD density of the full image normalized to a fluorescent standard. Each data point (square, sphere, triangle) (exp 1–3) was generated from one time series consisting of 150 frames. Cross and error bars represent the mean value and standard deviation of the three independent experiments
Fig. 6
Fig. 6
MinDE spatiotemporally regulate membrane-anchored DNA. a MinDE self-organization can regulate short membrane-anchored DNA fragments. Representative images and kymograph of a time-series of MinDE self-organization in the presence of 30 bp P1 dsDNA bound to the membrane by a cholesterol anchor (1 µM MinD (30% EGFP-MinD), 1 µM MinE, 10 nM TEG-cholesterol-dsP1). b Representative images and kymograph of a time-series of MinDE self-organization spatiotemporally regulating 300 bp long dsDNA bound to lipid-anchored streptavidin (1 µM MinD (30% EGFP-MinD), 1 µM MinE, 300 bp lambda DNA, streptavidin). c Representative images and kymograph of a time-series of MinDE self-organization spatiotemporally regulating 2000 bp long dsDNA bound to lipid-anchored streptavidin. All experiments were performed independently two (c) or three (a, b) times under similar conditions. Scale bars: 50 µm
Fig. 7
Fig. 7
MinDE-driven dynamics of model membrane proteins in vitro suggest that MinDE form a propagating diffusion barrier. a Representative images and kymographs of colliding MinDE waves in the presence of mCh-MTS(BsD) and lipid-anchored streptavidin bound to biotinylated lipids (1 µM MinD (30% EGFP-MinD), 1 µM MinE, 1 µM mCh-MTS(BsD) or streptavidin-Alexa647). Scale bars: 50 µm. b Schematic of the underlying protein behavior resulting in spatiotemporal regulation of model peripheral and membrane-anchored proteins. While mCh-MTS and MinDE can also attach and detach to and from the membrane, streptavidin can only diffuse laterally on the membrane. Schematic density profiles and protein localization on the membrane (magenta: mCh-MTS, green: MinD, orange: MinE, cyan: lipid-anchored streptavidin). The MinDE wave propagates directionally, even if individual proteins show a random movement on the membrane. Both model peripheral and membrane-anchored proteins show a wave propagation in the direction of the MinDE wave. mCh-MTS while more abundant in the MinDE minima covers the membrane homogenously. In contrast the resulting secondary wave of streptavidin shows an inhomogeneous profile and results in a net transport of the membrane-anchored protein

References

    1. Lutkenhaus J. The ParA/MinD family puts things in their place. Trends Microbiol. 2012;20:411–418. doi: 10.1016/j.tim.2012.05.002. - DOI - PMC - PubMed
    1. Surovtsev IV, Jacobs-Wagner C. Subcellular organization: a critical feature of bacterial cell replication. Cell. 2018;172:1271–1293. doi: 10.1016/j.cell.2018.01.014. - DOI - PMC - PubMed
    1. Leonard TA, Butler PJ, Löwe J. Bacterial chromosome segregation: structure and DNA binding of the Soj dimer--a conserved biological switch. EMBO J. 2005;24:270–282. doi: 10.1038/sj.emboj.7600530. - DOI - PMC - PubMed
    1. Thanbichler M, Shapiro L. MipZ, a spatial regulator coordinating chromosome segregation with cell division in caulobacter. Cell. 2006;126:147–162. doi: 10.1016/j.cell.2006.05.038. - DOI - PubMed
    1. Schumacher D, et al. The PomXYZ proteins self-organize on the bacterial nucleoid to stimulate cell division. Dev. Cell. 2017;41:299–314. doi: 10.1016/j.devcel.2017.04.011. - DOI - PubMed

Publication types

MeSH terms

LinkOut - more resources